This project is a repo of The Sketchy Database: Learning to Retrieve Badly Drawn Bunnies.
The homepage of the original project.
Get the dataset via Google Drive sketchydataset SketchyDataset Intro
Sketchy Database
As I didn't notice that the Sketchy Database contained a list of the testing photos, I randomly chose the testing photos and their related sketches myself. The test data set are listed in TEST_IMG and TEST_SKETCH
| category | photo | sketch |
|---|---|---|
| airplane | 10 | 75 |
| alarm_clock | 52 | |
| ant | 53 | |
| . | . | |
| . | . | |
| . | . | |
| window | 54 | |
| wine_bottle | 52 | |
| zebra | 66 | |
| Total | 1250 | 7875 |
Dataset
  ├── photo-train               # the training set of photos
  ├── sketch-triplet-train      # the training set of sketches
  ├── photo-test                # the testing set of photos
├── sketch-triplet-test # the testing set of sketchesusing feature_extract.py to get the extracted feature files ('*.pkl')
using retrieval_test.py to get the testing result.
There is no GoogLeNet, which resulted the best in the original paper, implement in PyTorch, so I used vgg16 instead.
| model | epoch | recall@1 | recall@5 |
|---|---|---|---|
| resnet34(pretrained;mixed training set;metric='cosine') | |||
| 90 | 8.51% | 18.68% | |
| 150 | 9.31% | 20.44% | |
| resnet34(pretrained;mixed training set;metric='euclidean') | |||
| 90 | 6.45% | 14.79% | |
| 150 | 6.96% | 16.46% | |
| resnet34(150 epoch;triplet loss m=0.02;metric='euclidean';lr=1e-5 batch_size=16) | |||
| 85 | 9.87% | 22.37% | |
| vgg16(pretrained;triplet loss m=0.3;metric='euclidean';lr=1e-5;batch_size=16) | |||
| 0 | 0.17% | 0.72% | |
| 5 | 17.59% | 45.51% | |
| 190 | 31.03% | 67.86% | |
| 275 | 32.22% | 68.48% | |
| 975 | 35.24% | 71.53% | |
| vgg16(fine-tune(275epoch);m=0.15;metric='euclidean';lr=1e-7;batch_size=16) | |||
| 55 | 33.22% | 70.04% | |
| 625 | 35.78% | 72.44% | |
| 995 | 36.09% | 73.02% | |
| resnet50(pretrained; triplet loss m=0.15; metric='euclidean'; lr=1e-7;batch_size=16) | |||
| 0 | 0.71% | 11.48% | |
| 55 | 10.18% | 29.94% | |
| 940 | 15.17% | 47.61% | |
| resnet50(pretrained; triplet loss m=0.1; metric='euclidean'; lr=1e-6 batch_size=32) | |||
| 315 | 19.58% | 57.19% | |
| resnet50(pretrained; triplet loss m=0.3; metric='euclidean'; lr=1e-5 batch_size=48) | |||
| 20 | 21.56% | 57.50% | |
| 95 | 30.32% | 71.73% | |
| 265 | 40.08% | 78.83% | |
| 930 | 46.04% | 83.30% |
I have no idea about why the resnet34 got that bad result, while the vgg16 and resnet50 resulted pretty well.
I randomly chose 20 sketches as the query sketch and here is the retrieval result. The model I used is the resnet50(pretrained; triplet loss m=0.3; metric='euclidean'; lr=1e-5 batch_size=48) after 265 training epoch.
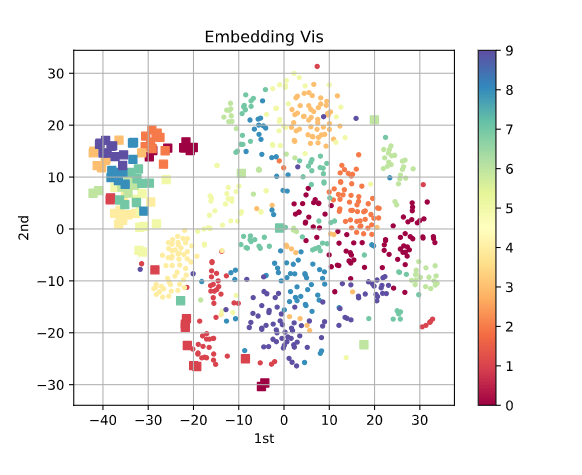
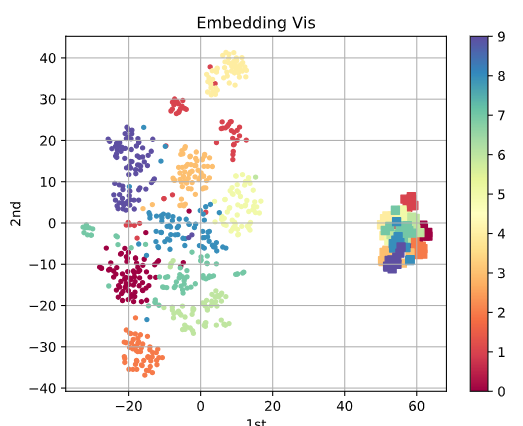
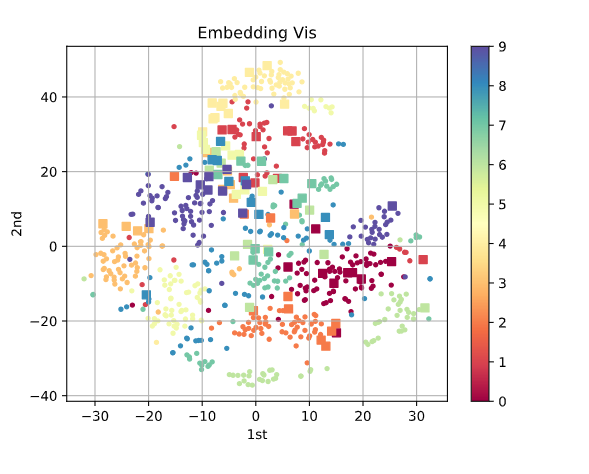
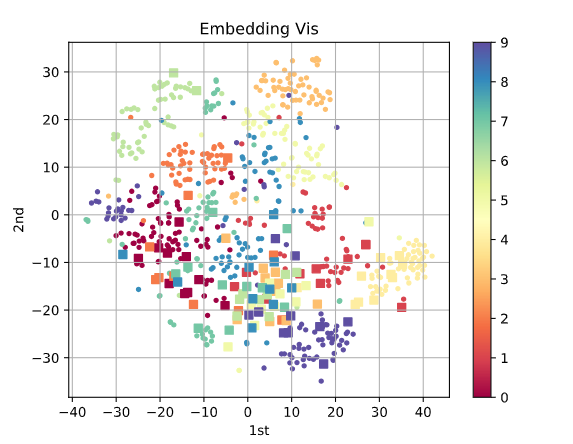
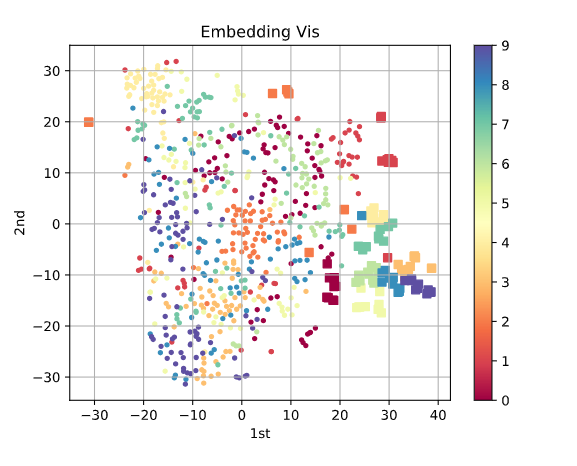
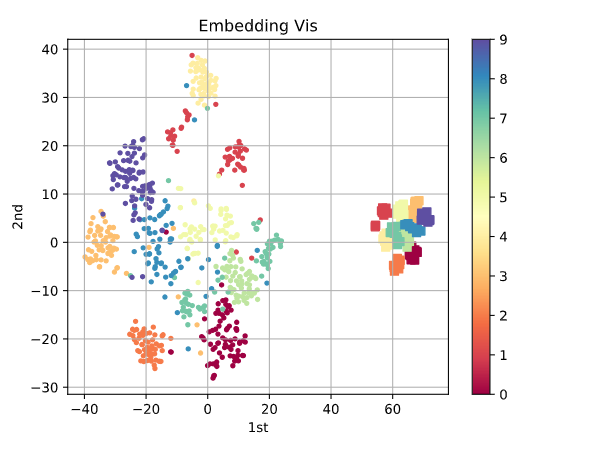
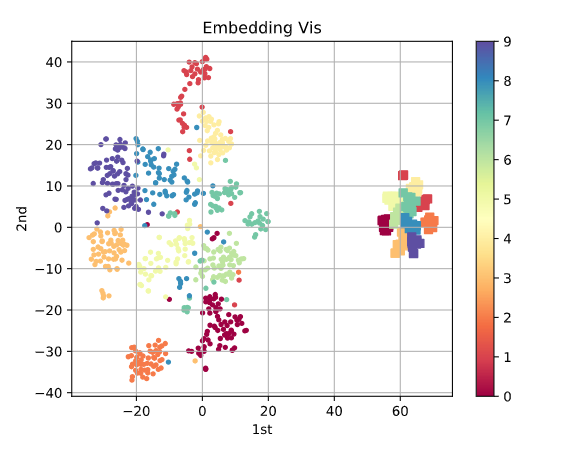
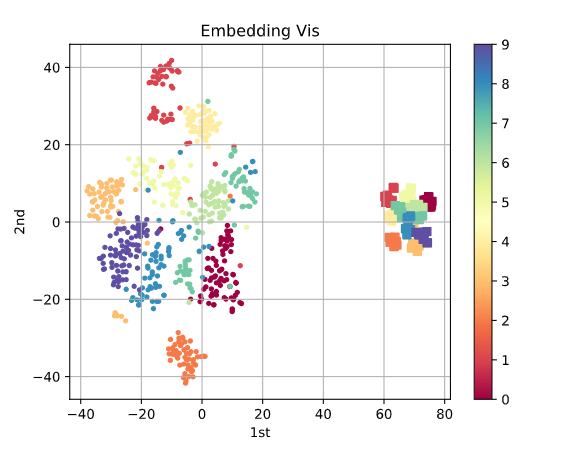
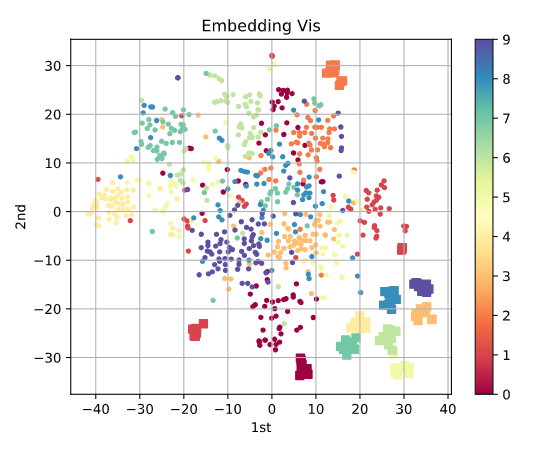
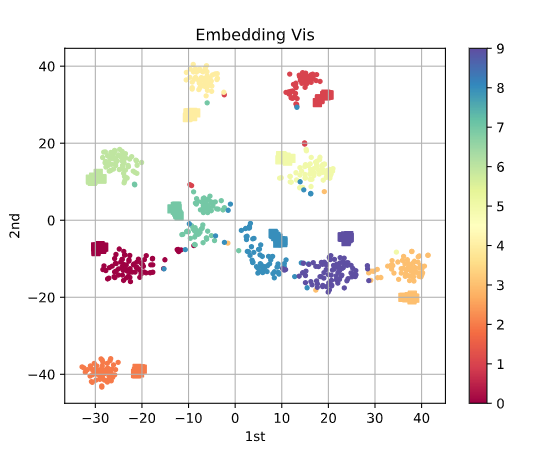
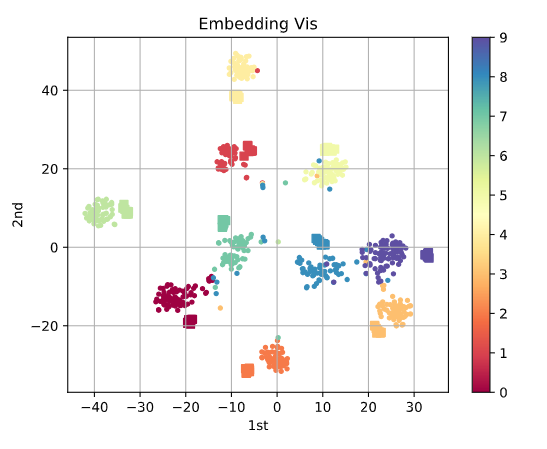
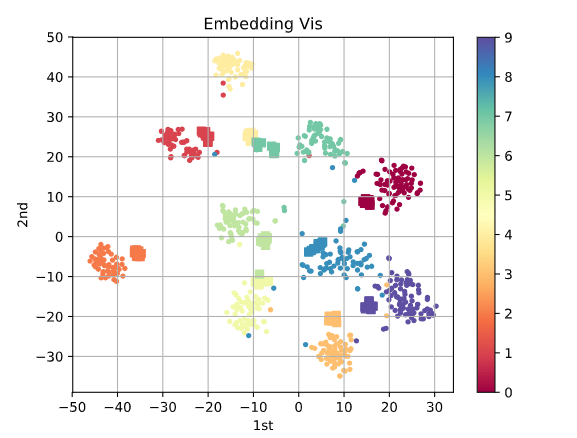
all the visulizated categories are the first ten categories in alphabetical order.
The boxes represent the photos, while the points represent the sketches.


