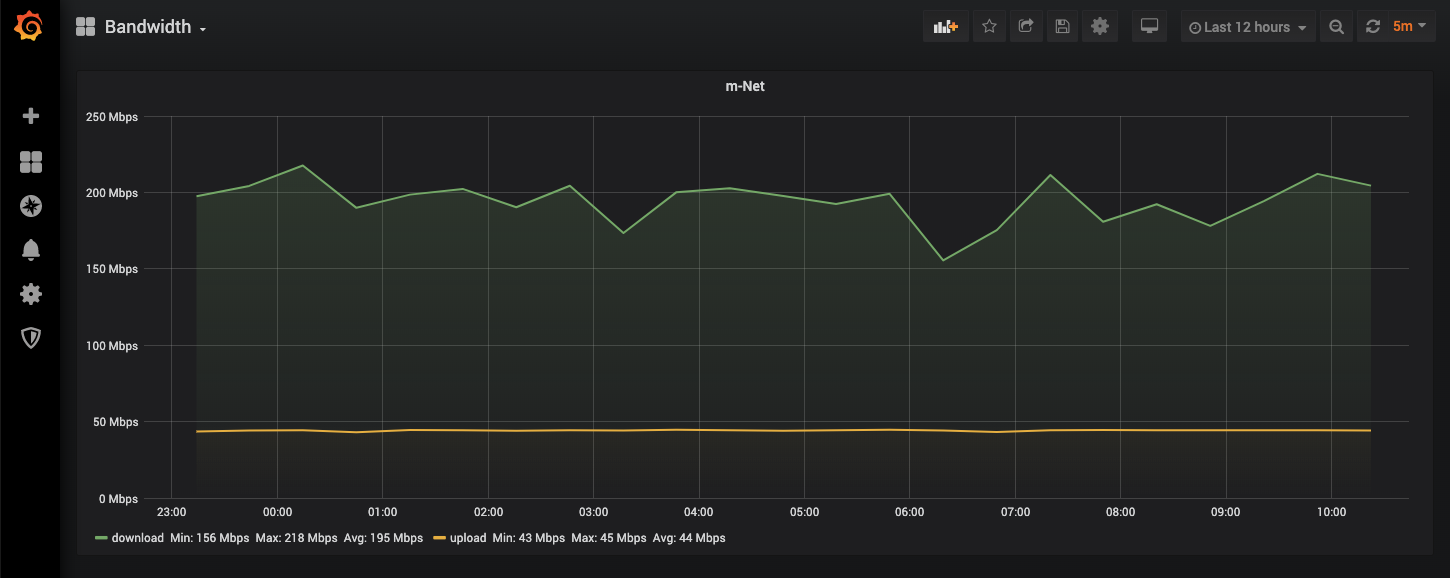
Check your internet bandwidth using the Speedtest CLI from a Docker container. You can configure the tool to run periodically and save the results to an InfluxDB for visualization or long-term records.
docker run --rm robinmanuelthiel/speedtest:latestThe result will then look like this:
Running a Speed Test...
Your download speed is 334 Mbps (29284399 Bytes/s).
Your upload speed is 42 Mbps (4012944 Bytes/s).
Your ping is 6.223 ms.| Environment variable | Default value | Description |
|---|---|---|
LOOP |
false |
Run Speedtest in a loop |
LOOP_DELAY |
60 |
Delay in seconds between the runs |
DB_SAVE |
false |
Save values to InfluxDB |
DB_HOST |
http://localhost:8086 |
InfluxDB Hostname |
DB_NAME |
speedtest |
InfluxDB Database name |
DB_USERNAME |
admin |
InfluxDB Username |
DB_PASSWORD |
password |
InfluxDB Password |
For a full visualization and long term tracking, I recommend InfluxDB as a time-series database and Grafana as a dashboard engine. Both come in Docker containers, so the whole setup can be achieved by starting a Docker Compose file.
version: "3"
services:
  grafana:
    image: grafana/grafana:7.5.2
    restart: always
    ports:
      - 3000:3000
    volumes:
      - grafana:/var/lib/grafana
    depends_on:
      - influxdb

  influxdb:
    image: influxdb:1.8.3
    volumes:
      - influxdb:/var/lib/influxdb
    ports:
      - 8083:8083
      - 8086:8086
    environment:
      - INFLUXDB_ADMIN_USER="admin"
      - INFLUXDB_ADMIN_PASSWORD="password"
      - INFLUXDB_DB="speedtest"

  speedtest:
    image: robinmanuelthiel/speedtest:latest
    environment:
      - LOOP=true
      - LOOP_DELAY=1800
      - DB_SAVE=true
      - DB_HOST=http://influxdb:8086
      - DB_NAME=speedtest
      - DB_USERNAME=admin
      - DB_PASSWORD=password
    privileged: true # Needed for 'sleep' in the loop
    depends_on:
      - influxdb

volumes:
  grafana:
  influxdb:
To configure Grafana, we need to add InfluxDB as a data source and create a dashboard with the upload and download values. You can find a demo dashboard configuration in the /demo folder.
Hint: The speedtest outputs values as bytes per second. Make sure to divide all values by 125000 in your dashboard to get the Mbps values.

