-
Online URL: https://github.com/CMU-IDS-Fall-2022/final-project-the-viz-kids
-
Team members:
-
Please note that you should run this locally to grade since we are unable to resolve the deploy issue.
-
Nikita Khatwani:
- Chapter 3
-
Ninad Bandewar:
- Chapter 1, Initial Data Cleaning
-
Jonghwa Na:
- Chapter 2, Miro Board (Interaction Flow)
-
Aditi Kanaujia:
- Machine Learning, Data Cleaning and Chapter 1
-
Pragnya Sridhar:
- Machine Learning, Data Cleaning and Chapter 1
We worked on our chapters independently and collaborated when needed. We met once every week to take account of the progress.
Towards the end of the project, we worked as a group to debug the script where needed.
- Link to paper: https://raw.githubusercontent.com/CMU-IDS-Fall-2022/final-project-the-viz-kids/main/Report.md
- Link to video: https://drive.google.com/file/d/1__EateuDJxnN5tKiUlrXCG1uegbMyDP9/view
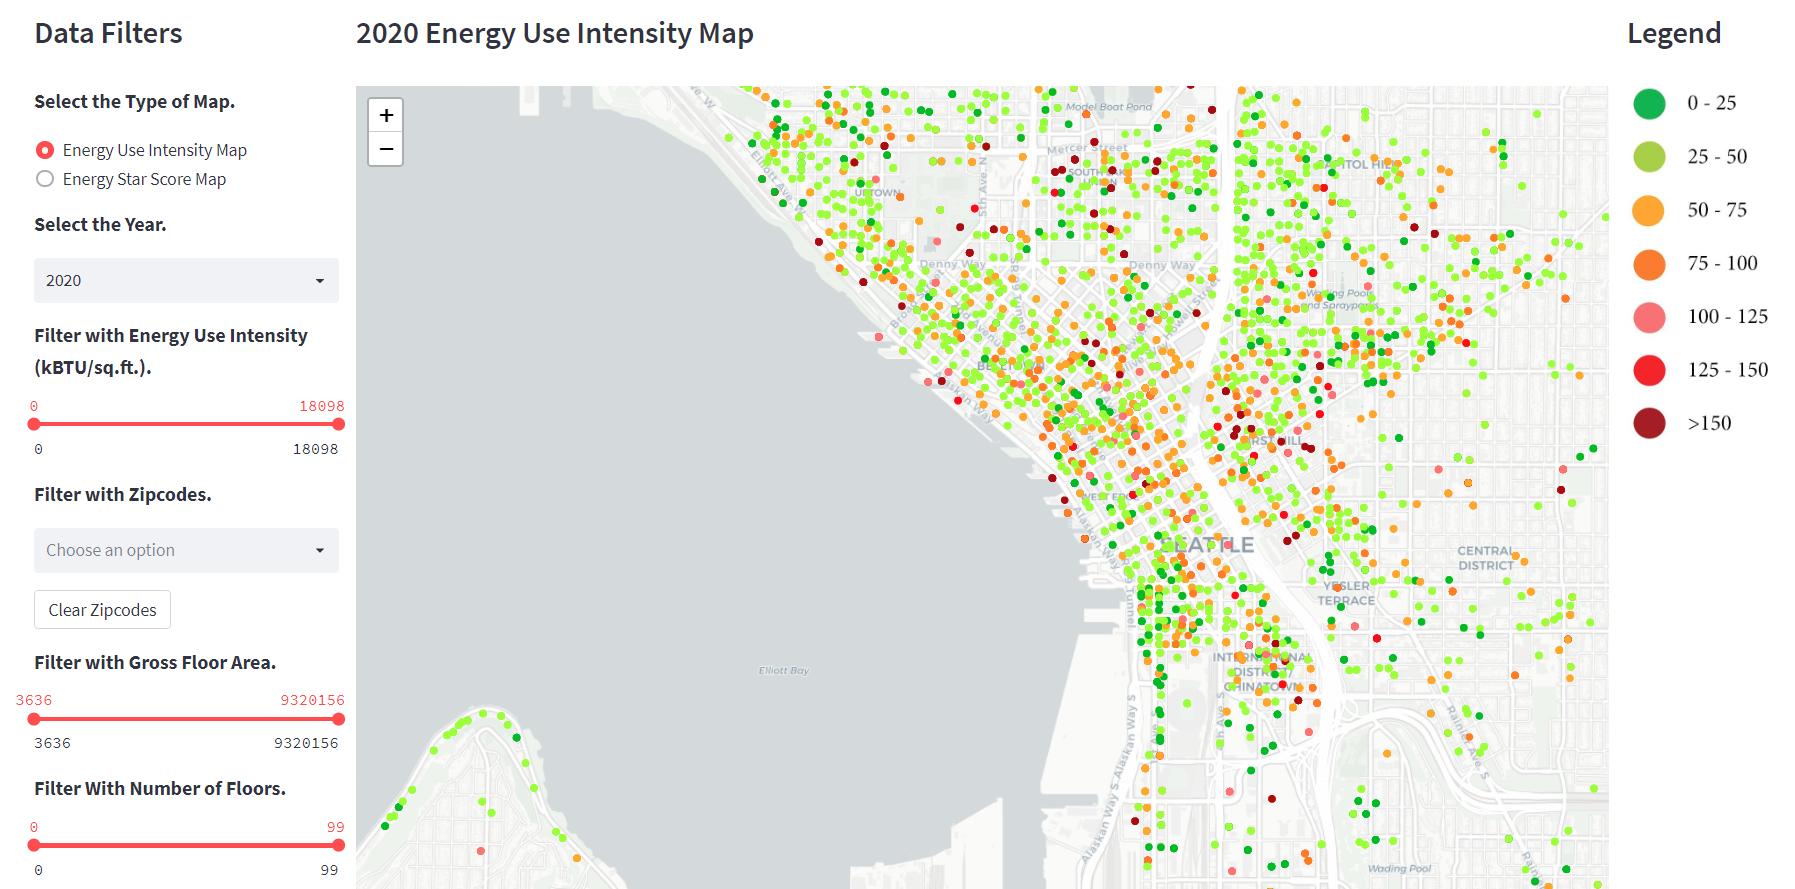
Buildings contribute to 38% of global emissions as per the UN Environmental Global Status Report 2020. Hence, it is crucial for us to make efforts to reduce energy consumption. Each building’s energy usage is mentioned in its monthly bill. However, it is quite challenging to assess if this amount would be higher/lower than others or the set average (threshold) consumption value for say, the 2050 goal. This can be achieved using the benchmark data. To be specific, Seattle has State Policies to require all public, commercial, and multifamily buildings to complete the benchmarking report of energy consumption in the building. This helps various policy makers, consultants and designers take informed decisions about building retrofits and it assists with setting standards for new buildings as well.
Given that energy is an important aspect for city planners and the government, data is maintained for each building in major cities every year. In Seattle alone, there are records for over 3,600 buildings for the year 2020 according to the Seattle government dataset. Manual inspection of such a large dataset is very difficult. There is a need to represent the data such that the users can choose the criteria they find important and gain insights from the data fitting those constraints. A dashboard can be used to meet this critical need. The existing dashboard of Seattle is informative, however, has scope for increased avenues for interaction and also, does not compare the relationship of various characteristics of the building with energy consumption. The available data set contains a couple of more unexplored features that could help answer conclusive questions and interactive techniques will aid in better comprehension of the performance in Seattle. It was also observed that the dataset contains missing values for the ENERGY STAR score, which rates building performance on a simple 1 - 100 scale, for about 25% of the buildings thus making the data represented incomplete.
In this regard, the motivation is to develop a new Dashboard to show the distribution of energy consumption across buildings in Seattle, incorporating more interactivity. Potential users of this dashboard include building occupants/owners, real estate developers, policy makers, consultants , designers, electricity board members and other interested parties. The dashboard can be used to identify energy efficient buildings to learn more about practices responsible for its efficiency and also to identify buildings that perform poorly. This will help the owners or other parties for further analysis and assess if the building must be retrofitted with newer green attributes like more energy efficient appliances, better heating/cooling systems, airtight construction, etc to reduce its energy consumption.
- The URL at the top of this readme needs to point to your application online. It should also list the names of the team members.
- A completed proposal. Each student should submit the URL that points to this file in their github repo on Canvas.
- Develop sketches/prototype of your project.
- All code for the project should be in the repo.
- Update the Online URL above to point to your deployed project.
- A detailed project report. Each student should submit the URL that points to this file in their github repo on Canvas.
- A 5 minute video demonstration. Upload the video to this github repo and link to it from your report.