This version of PanelCheck is unpolished. By this is meant that all the features Regarding the actual data-analysis works but miscellaneous functionality such as the about section or help section might not function as desired.
If you are using a windows mashine, please use PanelCheck distributed here http://www.panelcheck.com/Home/panelcheck_downloads
You will need at least iOS High Sierra
- Download this repository
- Unzip and place the folder somewhere meaningful on your computer ( Not in Downloads)
- When you want to open the program first time, you will NOT be able to doubleclick. Use Finder to direct to the folder with the program, and then cmd+click on the icon. Then you will be prompted with this window where you hit enter.
From now on you will be able to simple double-click on the program to get it running.
A real toy example data Data_Bread.xlsx is included. Here follows a short demonstration
Use File > Import > Excel... to locate the data. Here you need to make sure that the coloumns representing Assessors, Samples and Replicates are correctly identified by PanelCheck, furhter you are able to de-select some of the variables in the Import Coloumns.
When correctly mathced, hit Accept
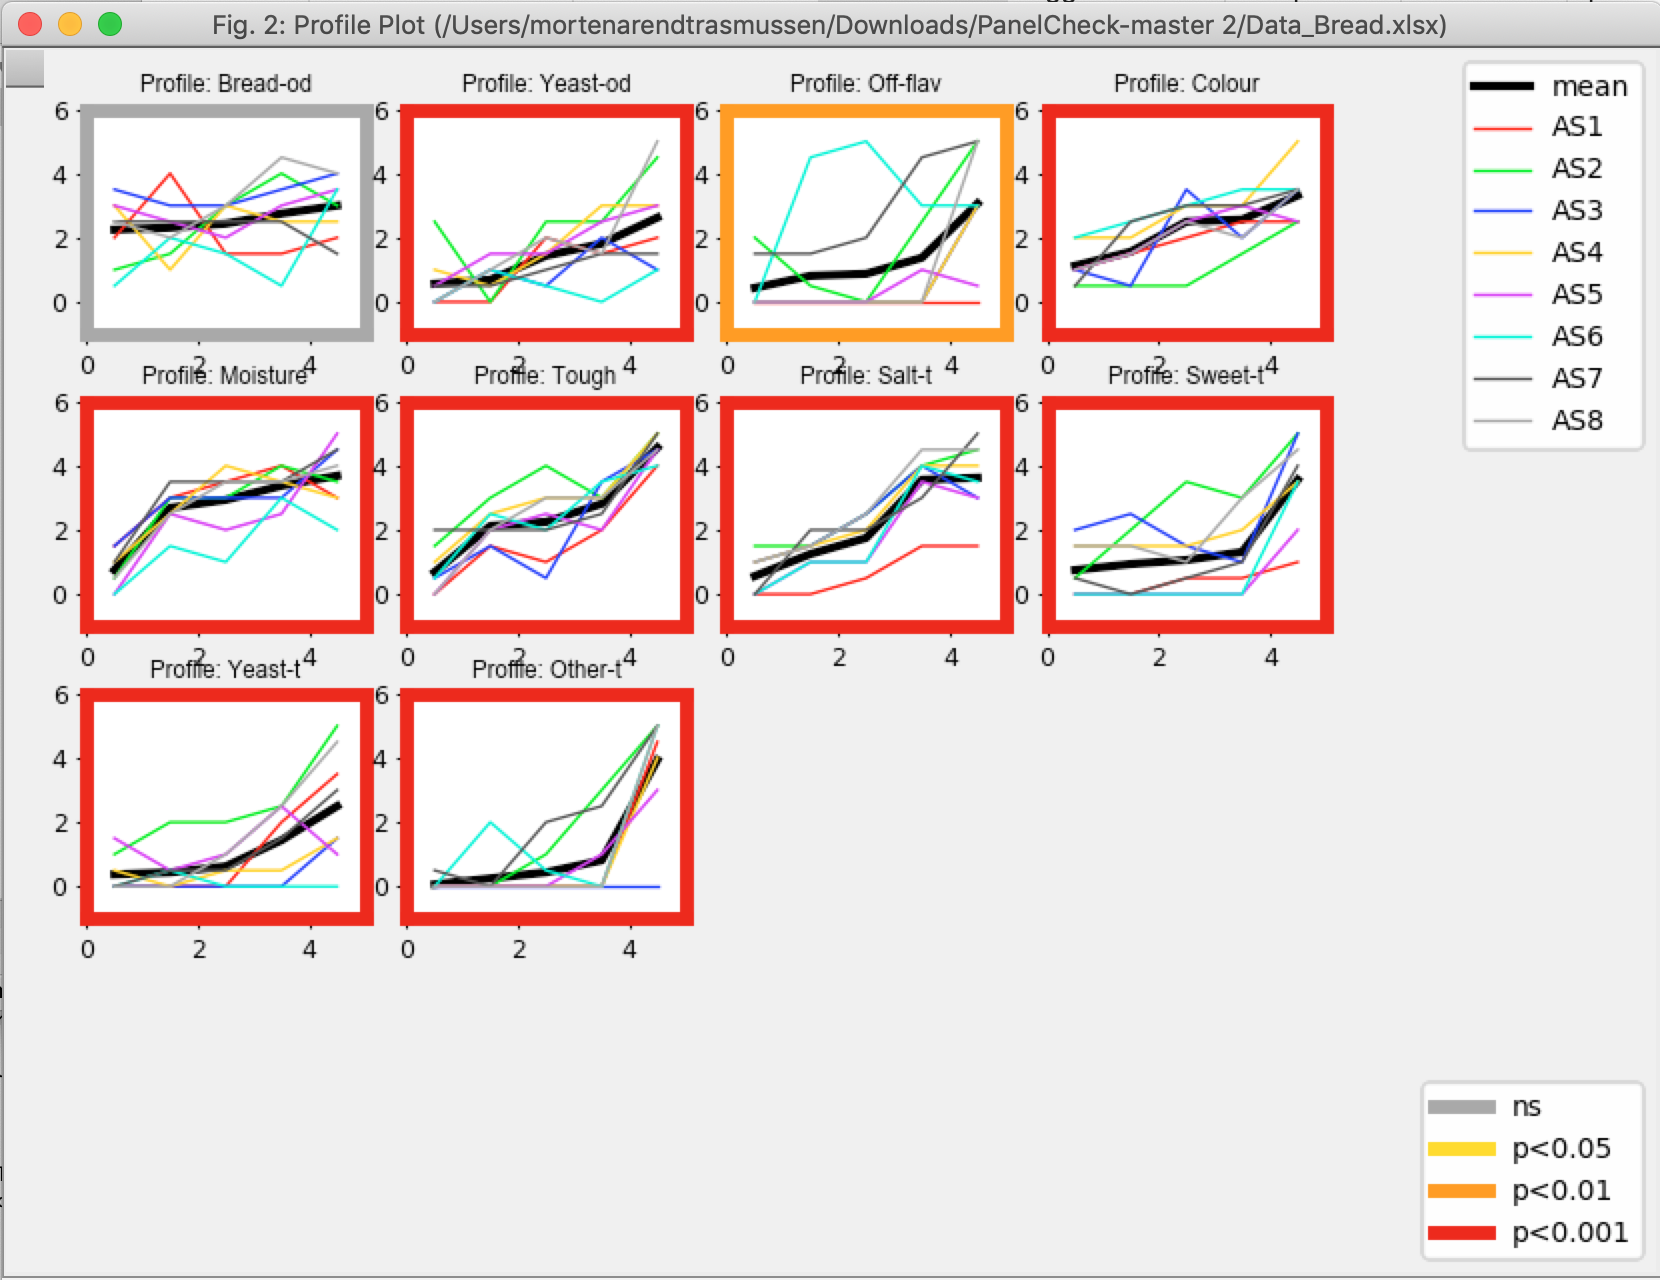
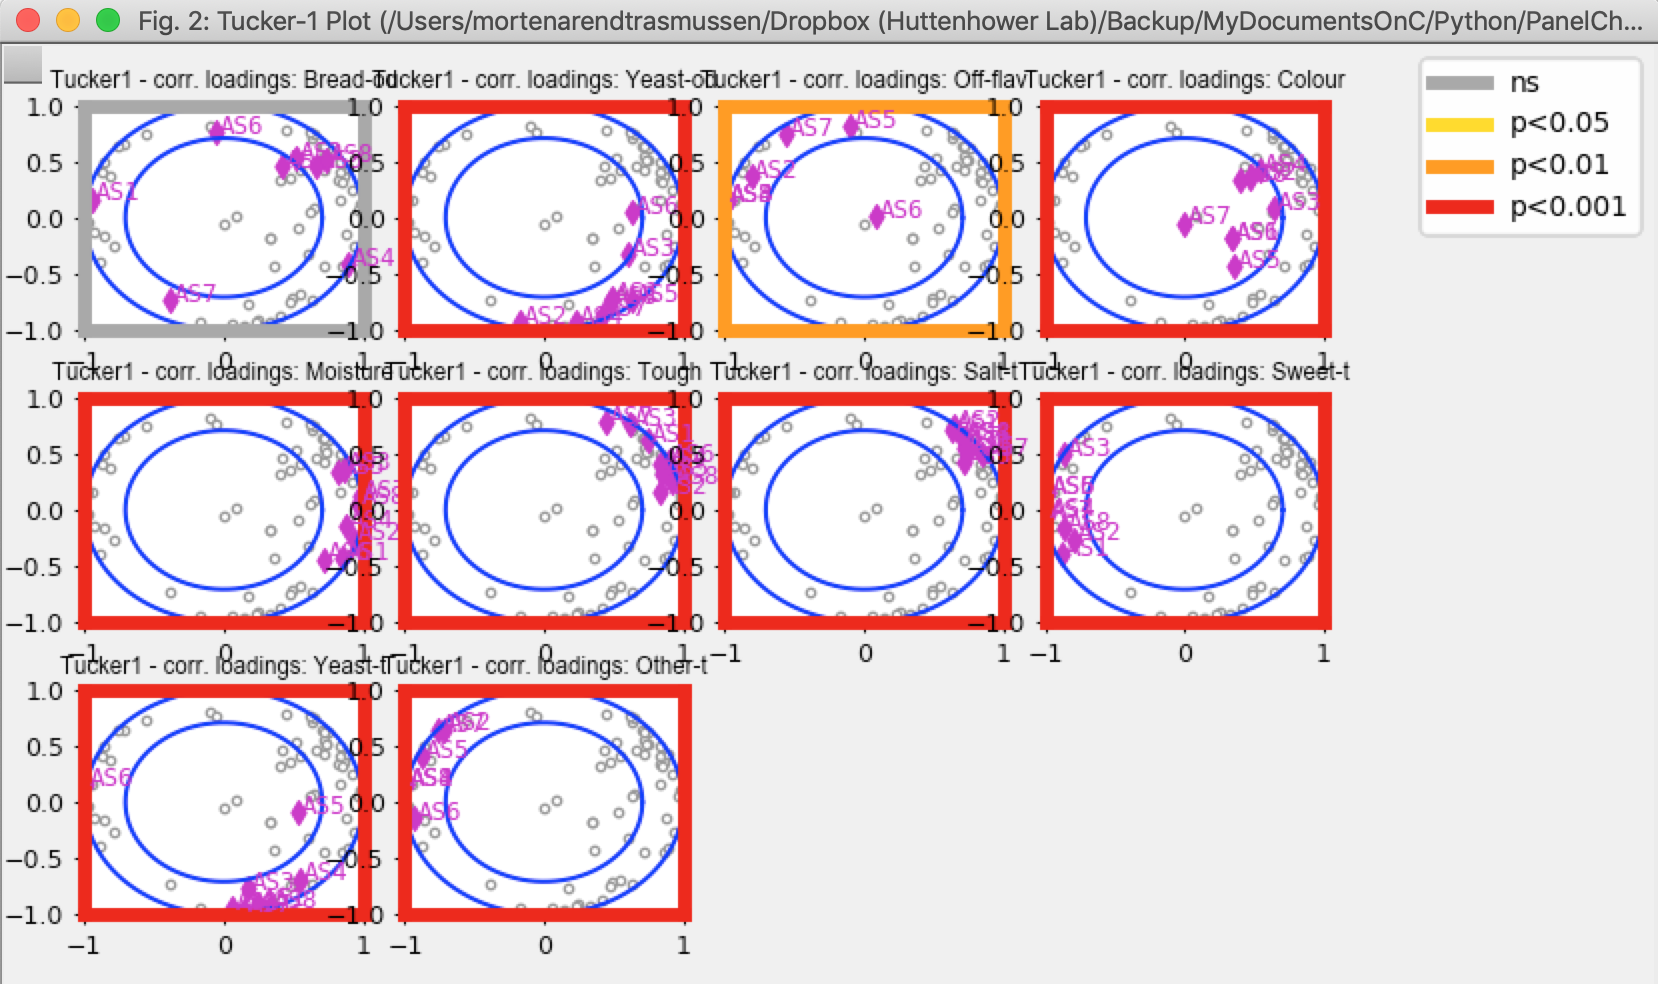
In the graphical user interface, you will find four main tabs; Univariate, Multivariate, Consensus and Overall. In each main tab, several different plots are available.The red/orange/grey frame indicates level of signifcanse related to differences between samples for the particular attribute. Try to click on the different plots e.g.
Profile plots show individual(coloured lines) and consensus (black bold line) scoring (Y-axis) and ranking (X-axis) of samples.
Select the Overview Plot (attributes). This plot shows the consensus among panellists for the different attributes. Assessors grouping together in a cluster indicates good agreement between these.
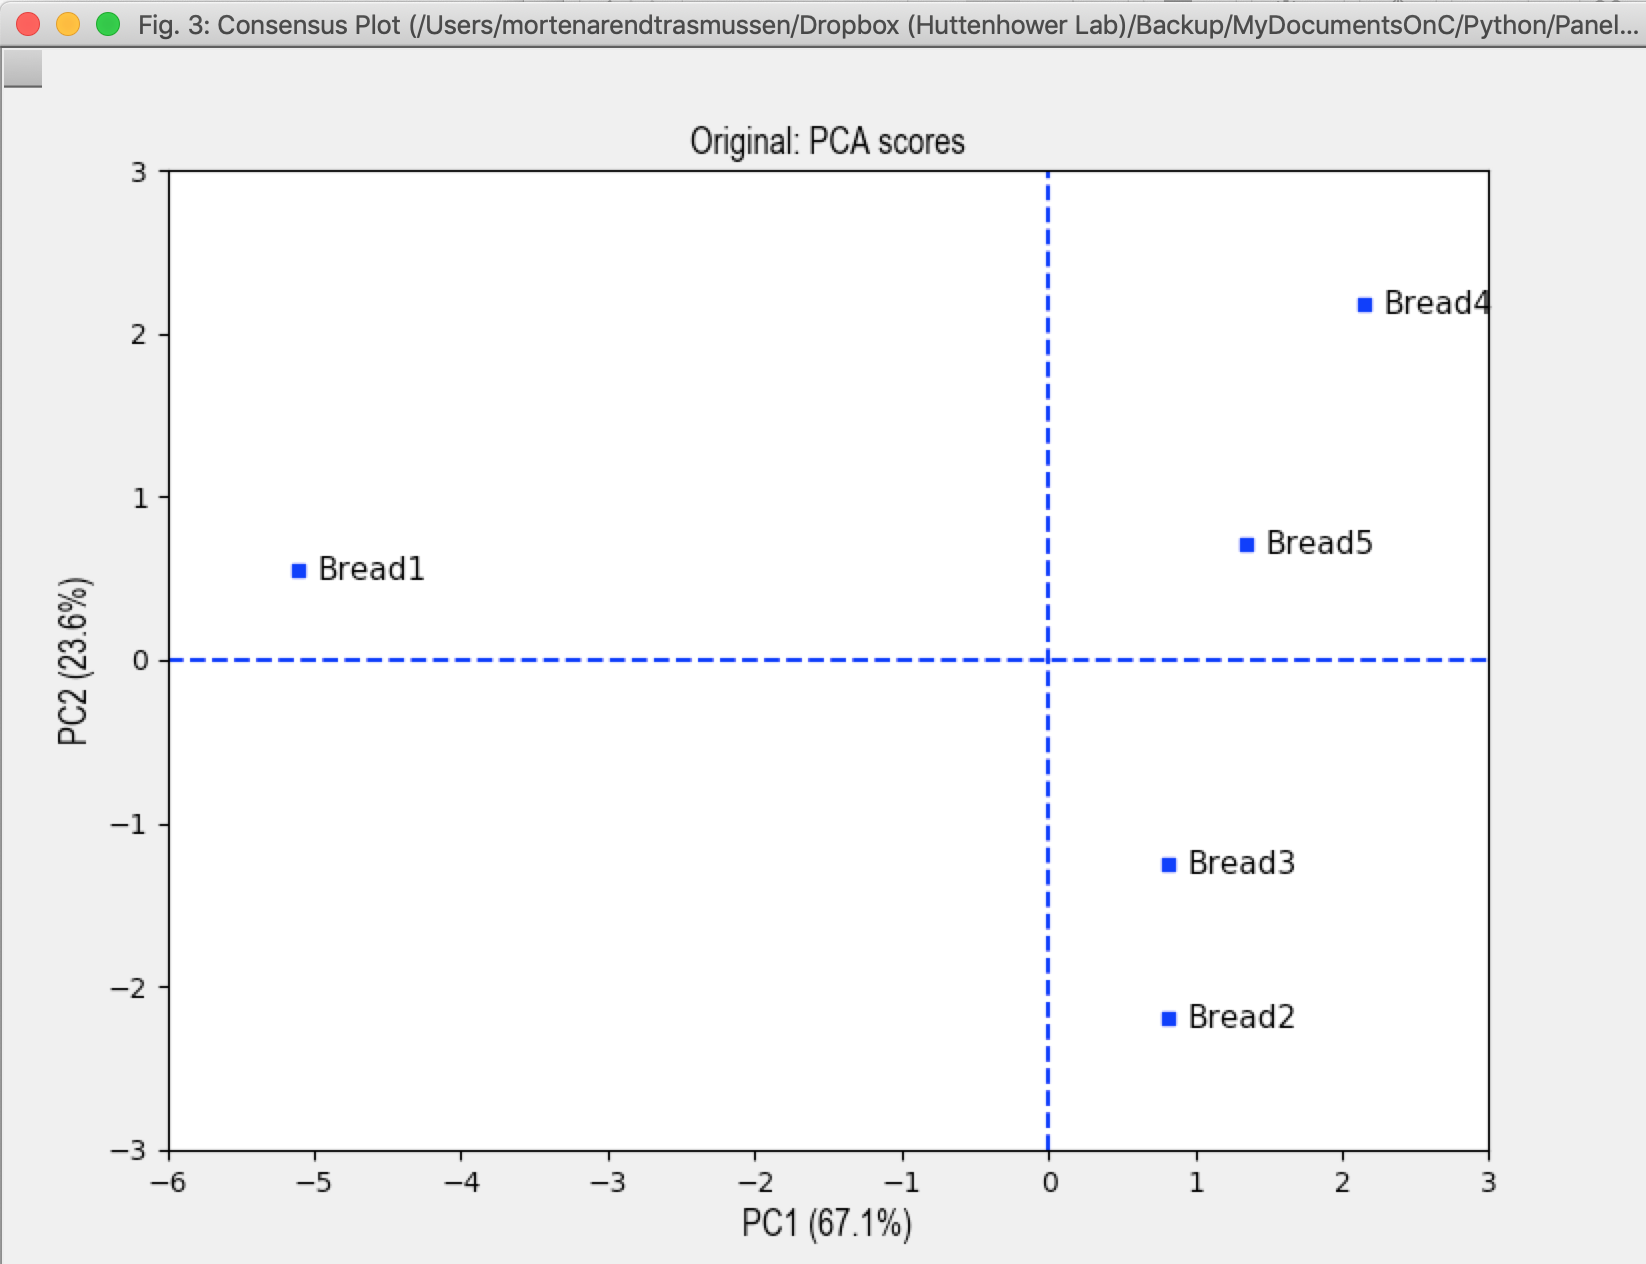
This plot shows which prodcuts are perceived similar and different.
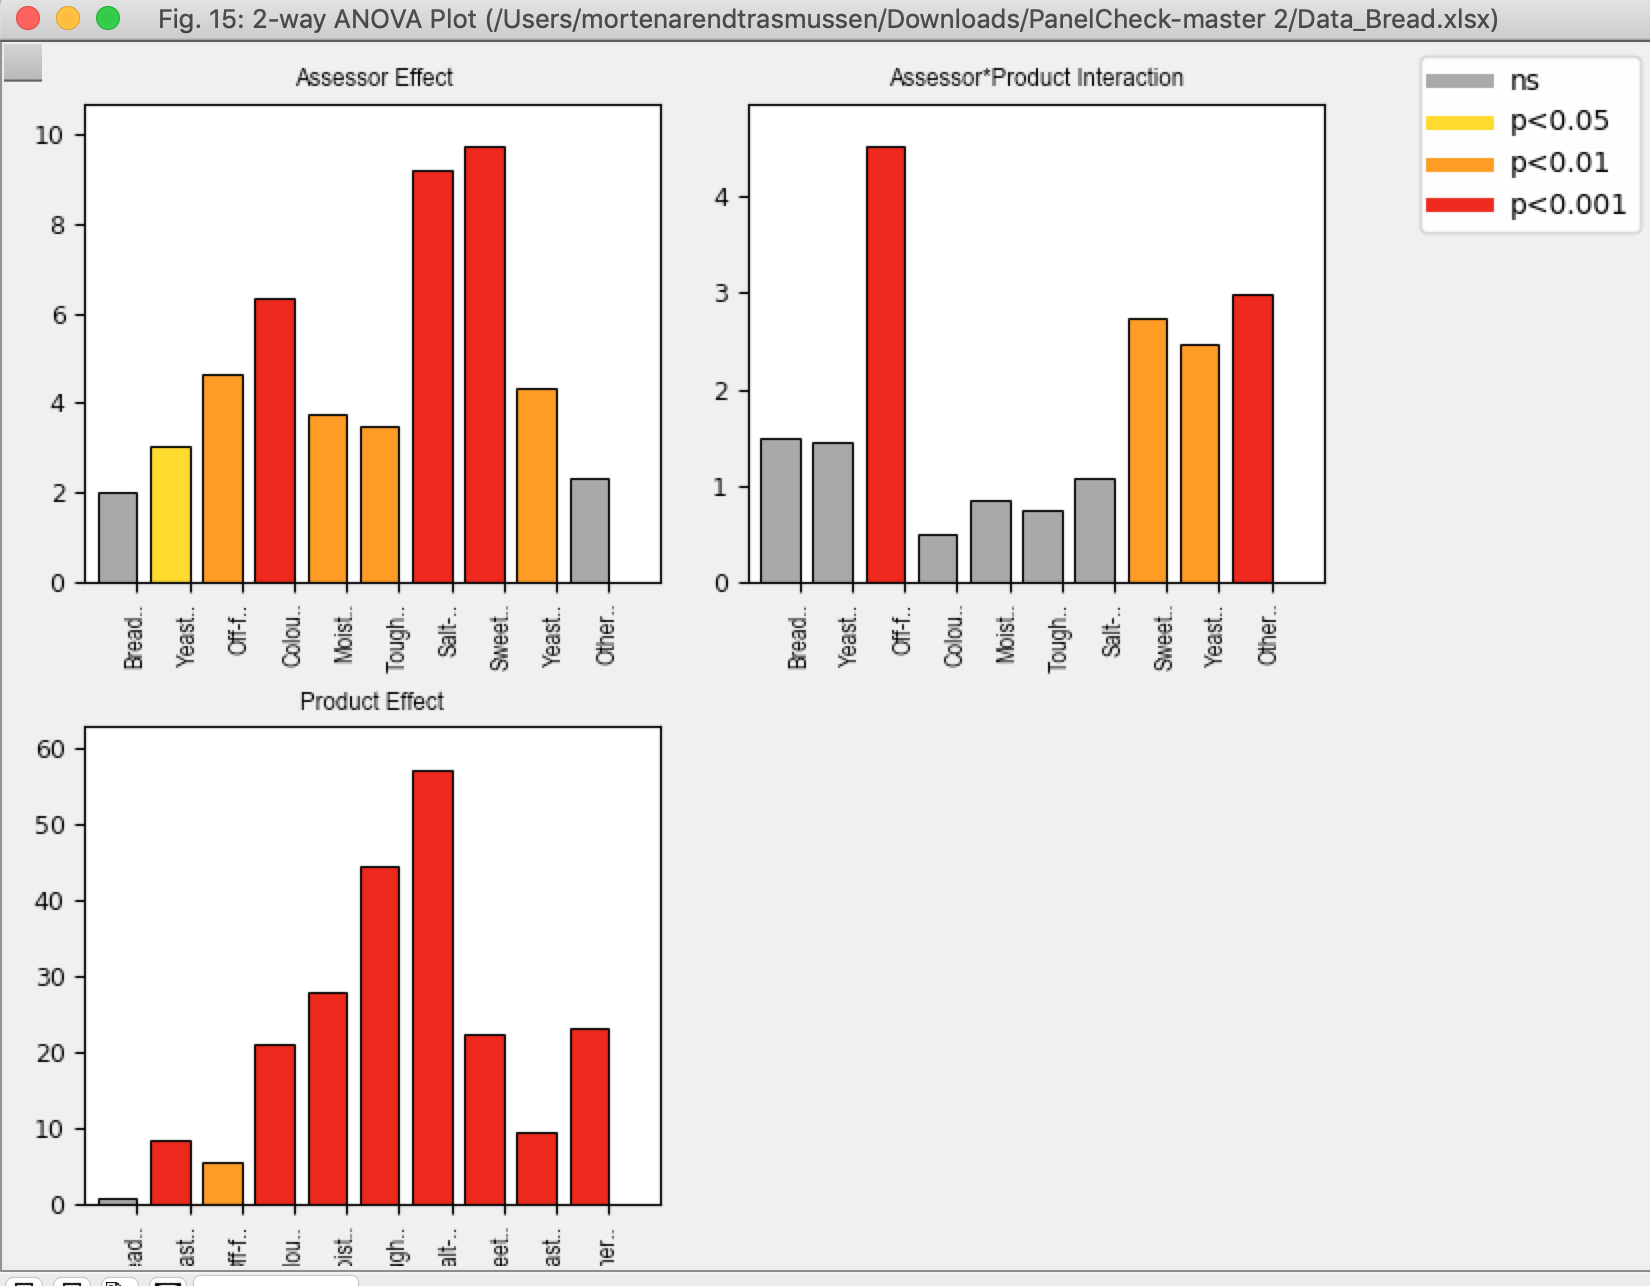
Several statistical analyses can be conducted in PanelCheck as an example, a two way anova with interactions is conducted.
Select Overall at the top (to the right), and select 2-way ANOVA as analysis. This one because there are replicates. Select the Overview Plot (F values). You should get something like this:
Here, the main effects (Assessor and Product) as well as their interaction, across all attributes (x-axis). The y-axis is the F-value, which indicates the level of differences with respect to the assessor or product or the combination: The higher, the larger the difference. Colors indicate the corresponding significance test p-value. A significant product/sample effect for a specific attribute tells that this attribute significantly discriminate the prodcuts/samples.
On the left at the bottom of a plot there are some action icons. The disk is used for saving the particular plot.


