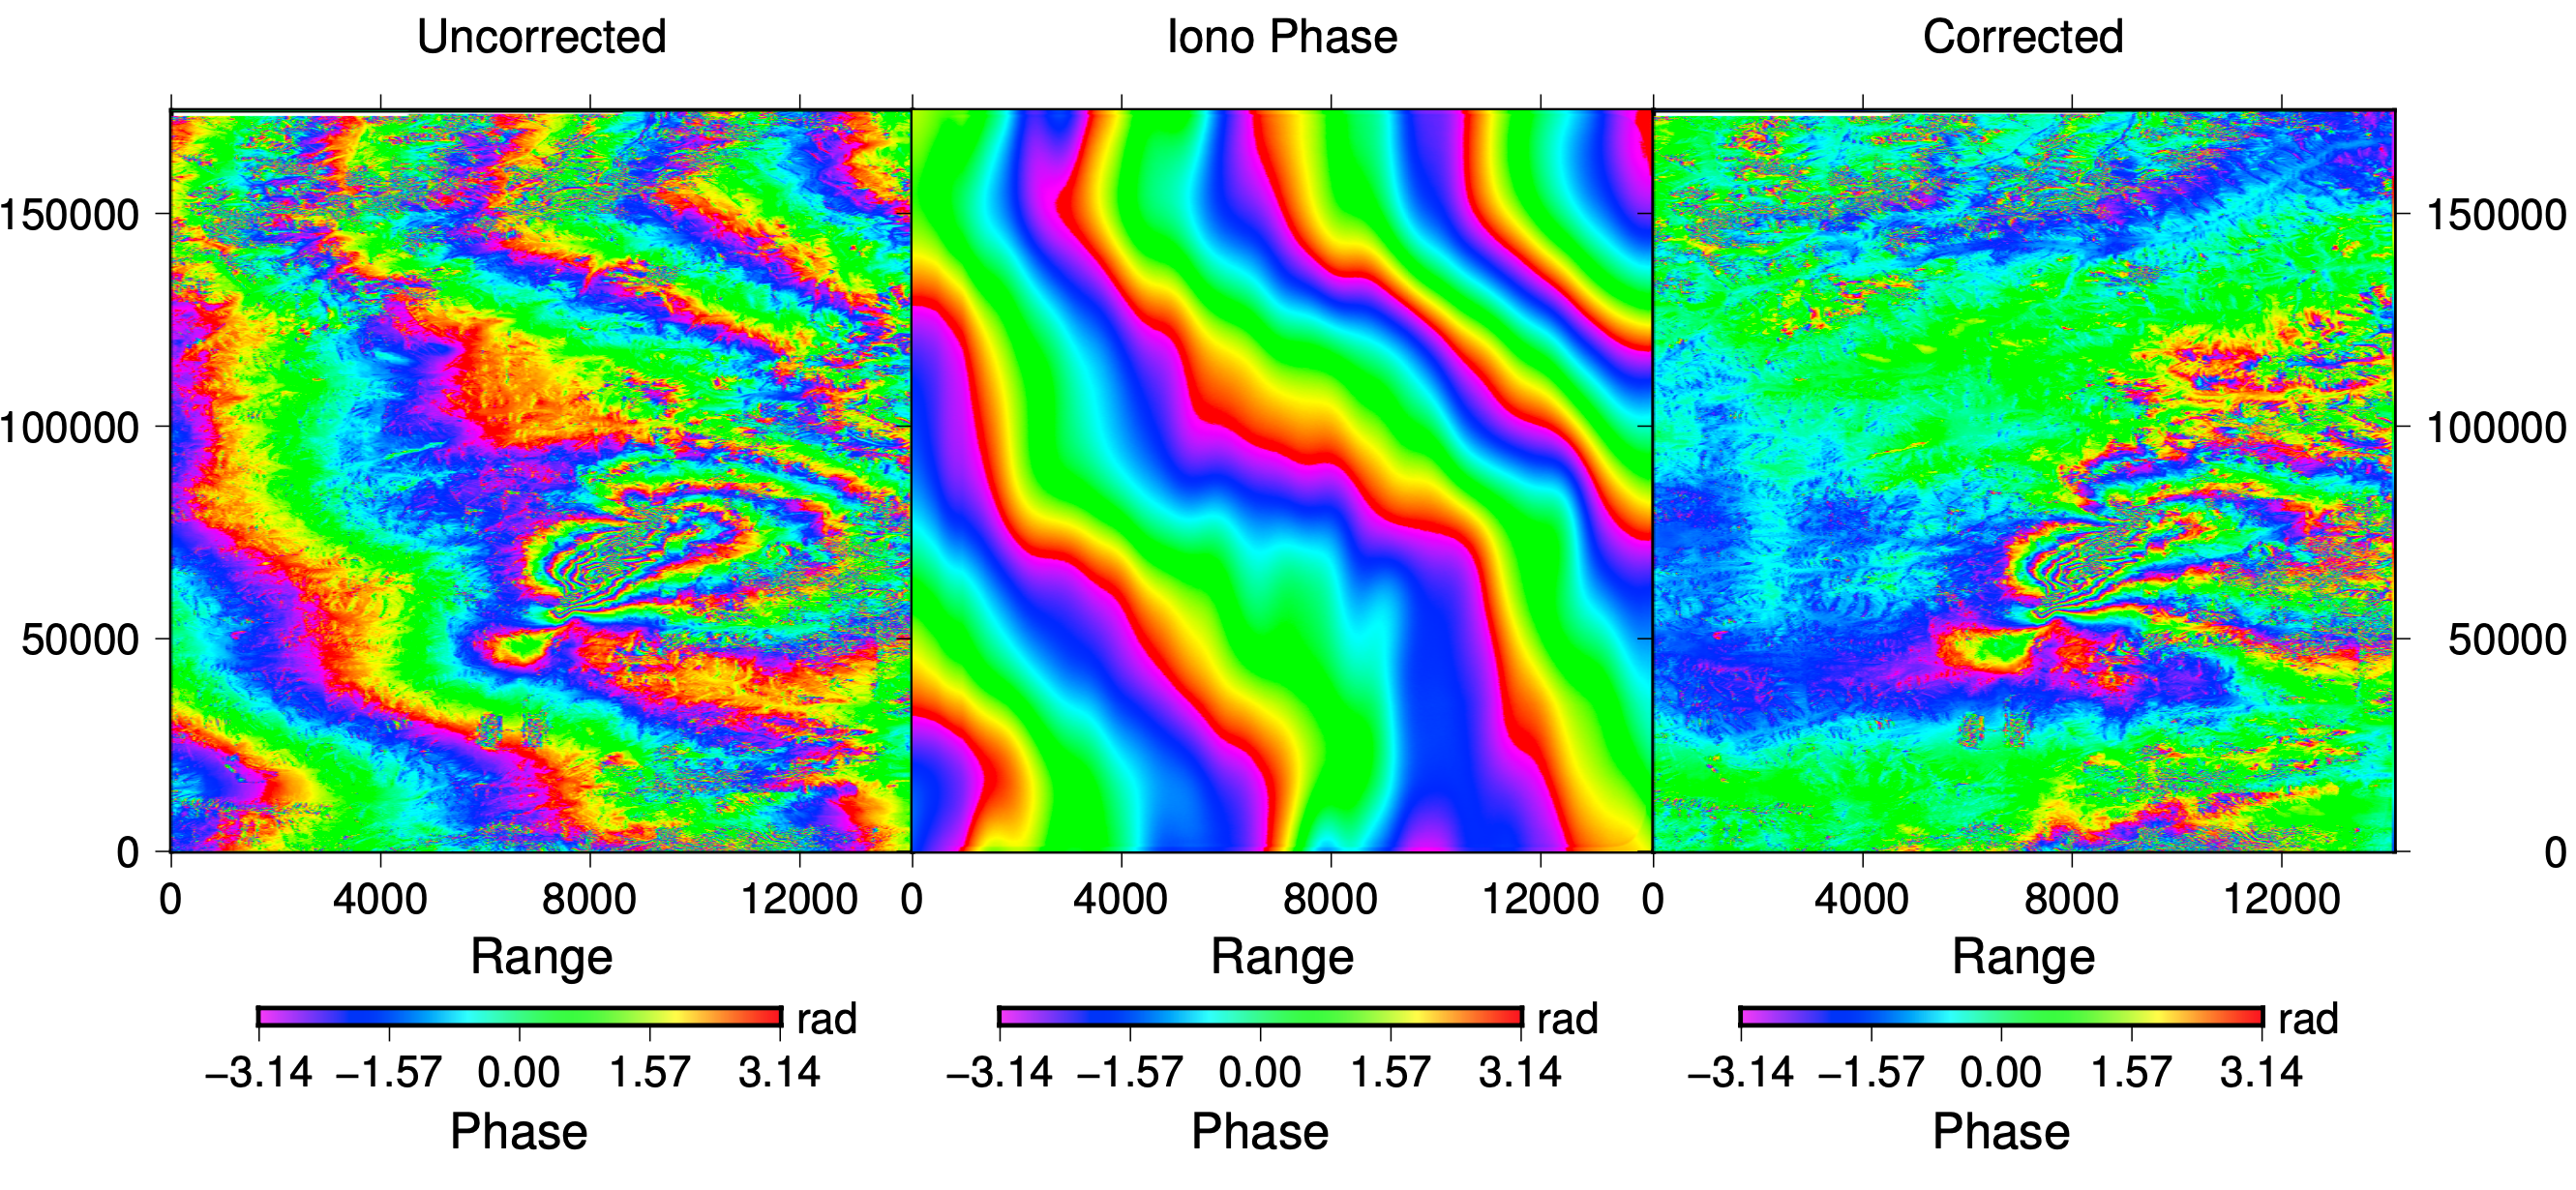
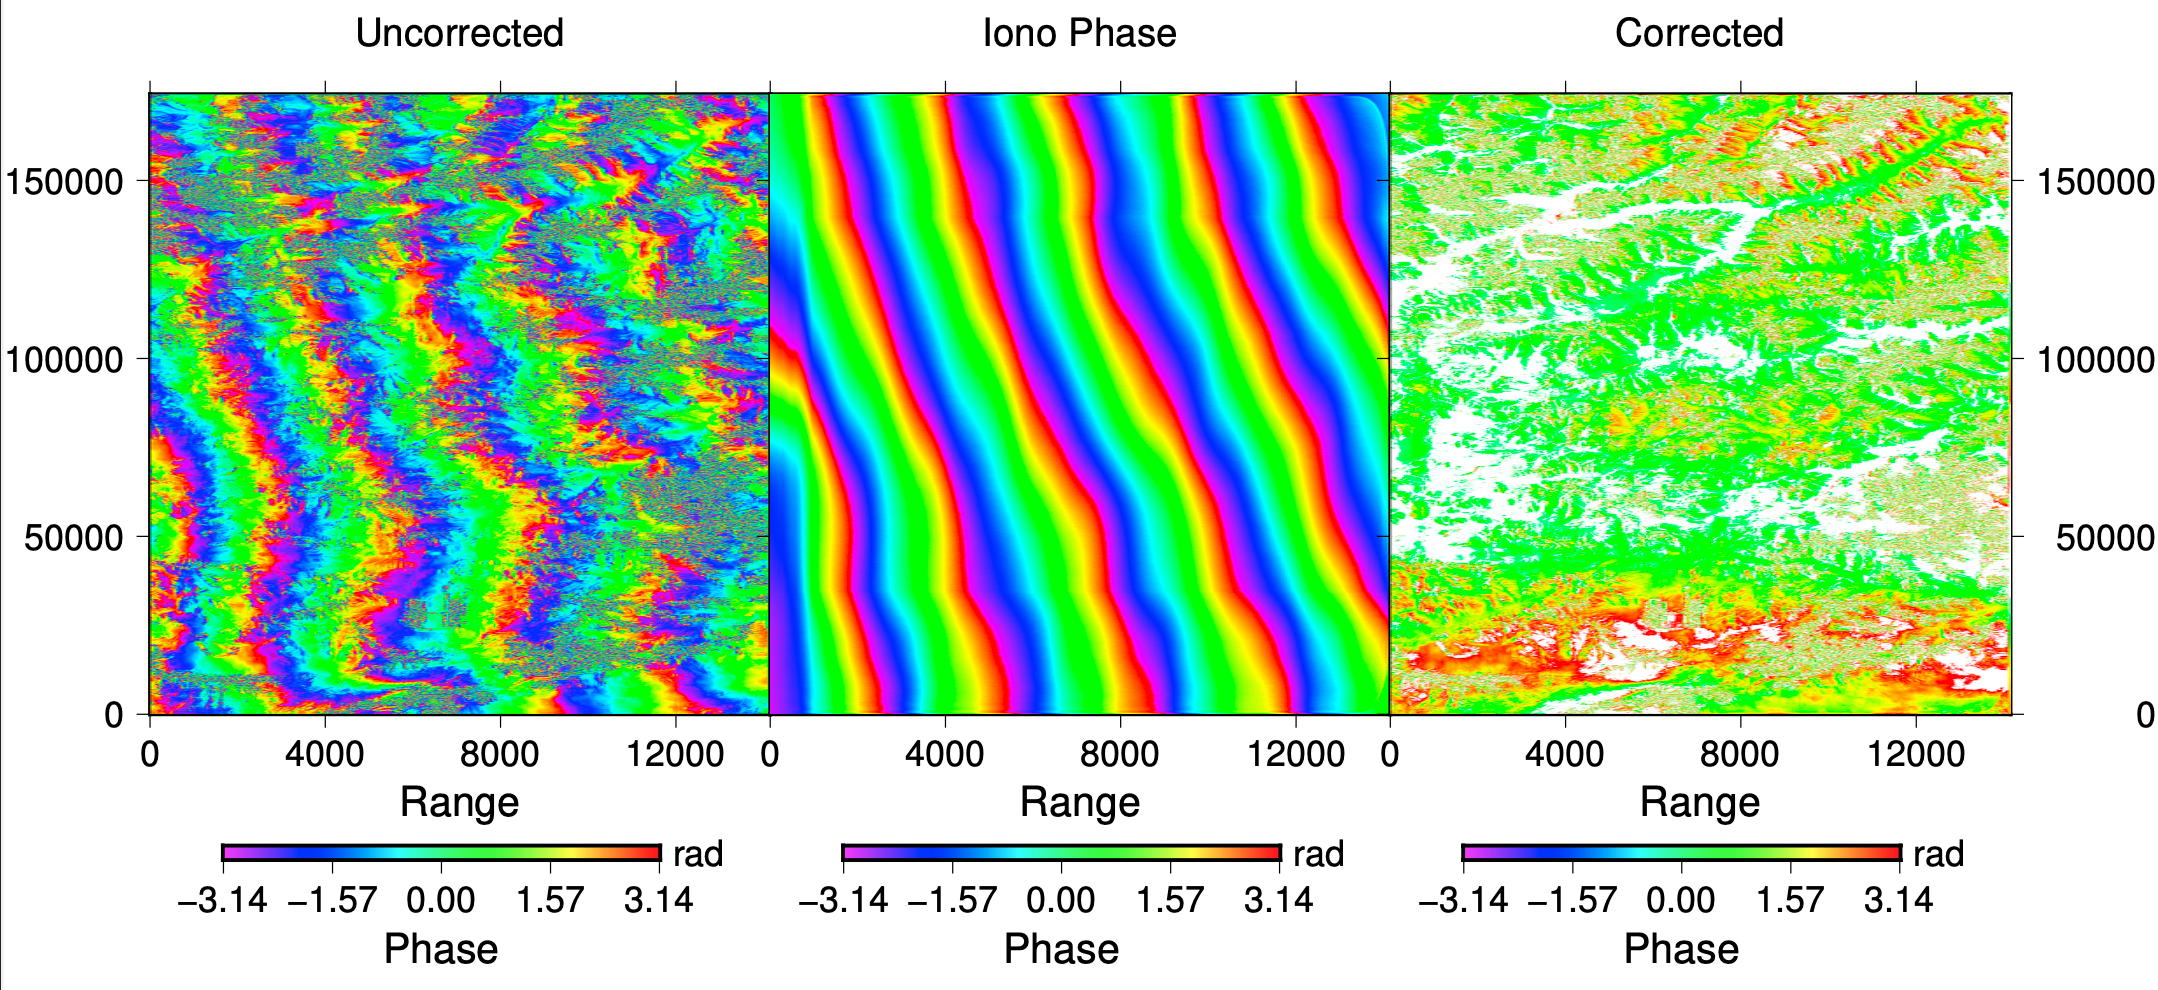
We use the split-spectrum method (Gomba etal., 2015; Heresh et al., 2017) to correct ionospheric noise
Because ALOS-2 data has a narrow bandwidth
To solve this issue, not only do we need a large filter, but also rule out pixels whose amplitude is too large after the correction.
The command to correct ionospheric noise:
cd iono_correction

estimate_ionospheric_phase_local.csh  ../../intf_h/20160518_20161019  ../../intf_l/20160518_20161019
../../intf_o/20160518_20161019  ../../20160518_20161019  0.82  7.5
The last two parameters denote the filter wavelength ratio along range and azimuth directions.
Sometimes, the corrected phase is centralized at
gmt grdmath ph_corrected.grd PI ADD 2 PI MUL MOD = ph_corrected.grd
Plot the comparison between original and corrected interferogram:
plot_iono.csh 20160518_20161019
It generates a figure named with "iono_correct.pdf" located in each directory.
Correction of coseismic interferogram
Correction of postseismic interferogram
Compared to traditional methods, we have some improvements/adjustments:
-
The traditional correction methods works only on single subswath. If we merge 3/5 subswaths for the whole interferogram, due to a amplifier in the split-spectrum formula, there may exist a very large discontinuity between each subswath. We need to remove the discontinuity using the file "boundary.txt" that gives the # of range pixels at each intersection of subswath. (correct_subswath_local.m)
-
We also need to remove noisy pixels by setting the amplitude threshold in correct_subswath_local.m. In this example, I set the threshold to be 220. In other real cases, it's better to write a program that chops off 5% ~ 10% pixels using its amplitude distribution.
-
During the iterative interpolation & filtering step, we use linear extrapolation instead of nearest interpolation methods that proposed in Heresh etal., 2017. Because the phase is NOT randomly distributed within an area, instead, it's somewhat linearly extended to the whole space of the interferogram. The nearest extrapolation would under-estimate the ionospheric signal.
-
Previous grdfilter uses a rectangular filter which is not good to filter irregular shape of ionospheric patterns. Instead, we design a non-isotropic filter shape (nancov.m). This filter could also reduce the edge effects in the interferogram during the filtering step.
Jin, Z., Fialko, Y., Zubovich, A., & Schöne, T. (2022). Lithospheric deformation due to the 2015 M7. 2 Sarez (Pamir) earthquake constrained by 5 years of space geodetic observations. Journal of Geophysical Research: Solid Earth, 127(4).
Fattahi, H., Simons, M., & Agram, P. (2017). InSAR time-series estimation of the ionospheric phase delay: An extension of the split range-spectrum technique. IEEE Transactions on Geoscience and Remote Sensing, 55(10), 5984-5996.
Gomba, G., Parizzi, A., De Zan, F., Eineder, M., & Bamler, R. (2015). Toward operational compensation of ionospheric effects in SAR interferograms: The split-spectrum method. IEEE Transactions on Geoscience and Remote Sensing, 54(3), 1446-1461.

