Cory Whitney CWWhitney
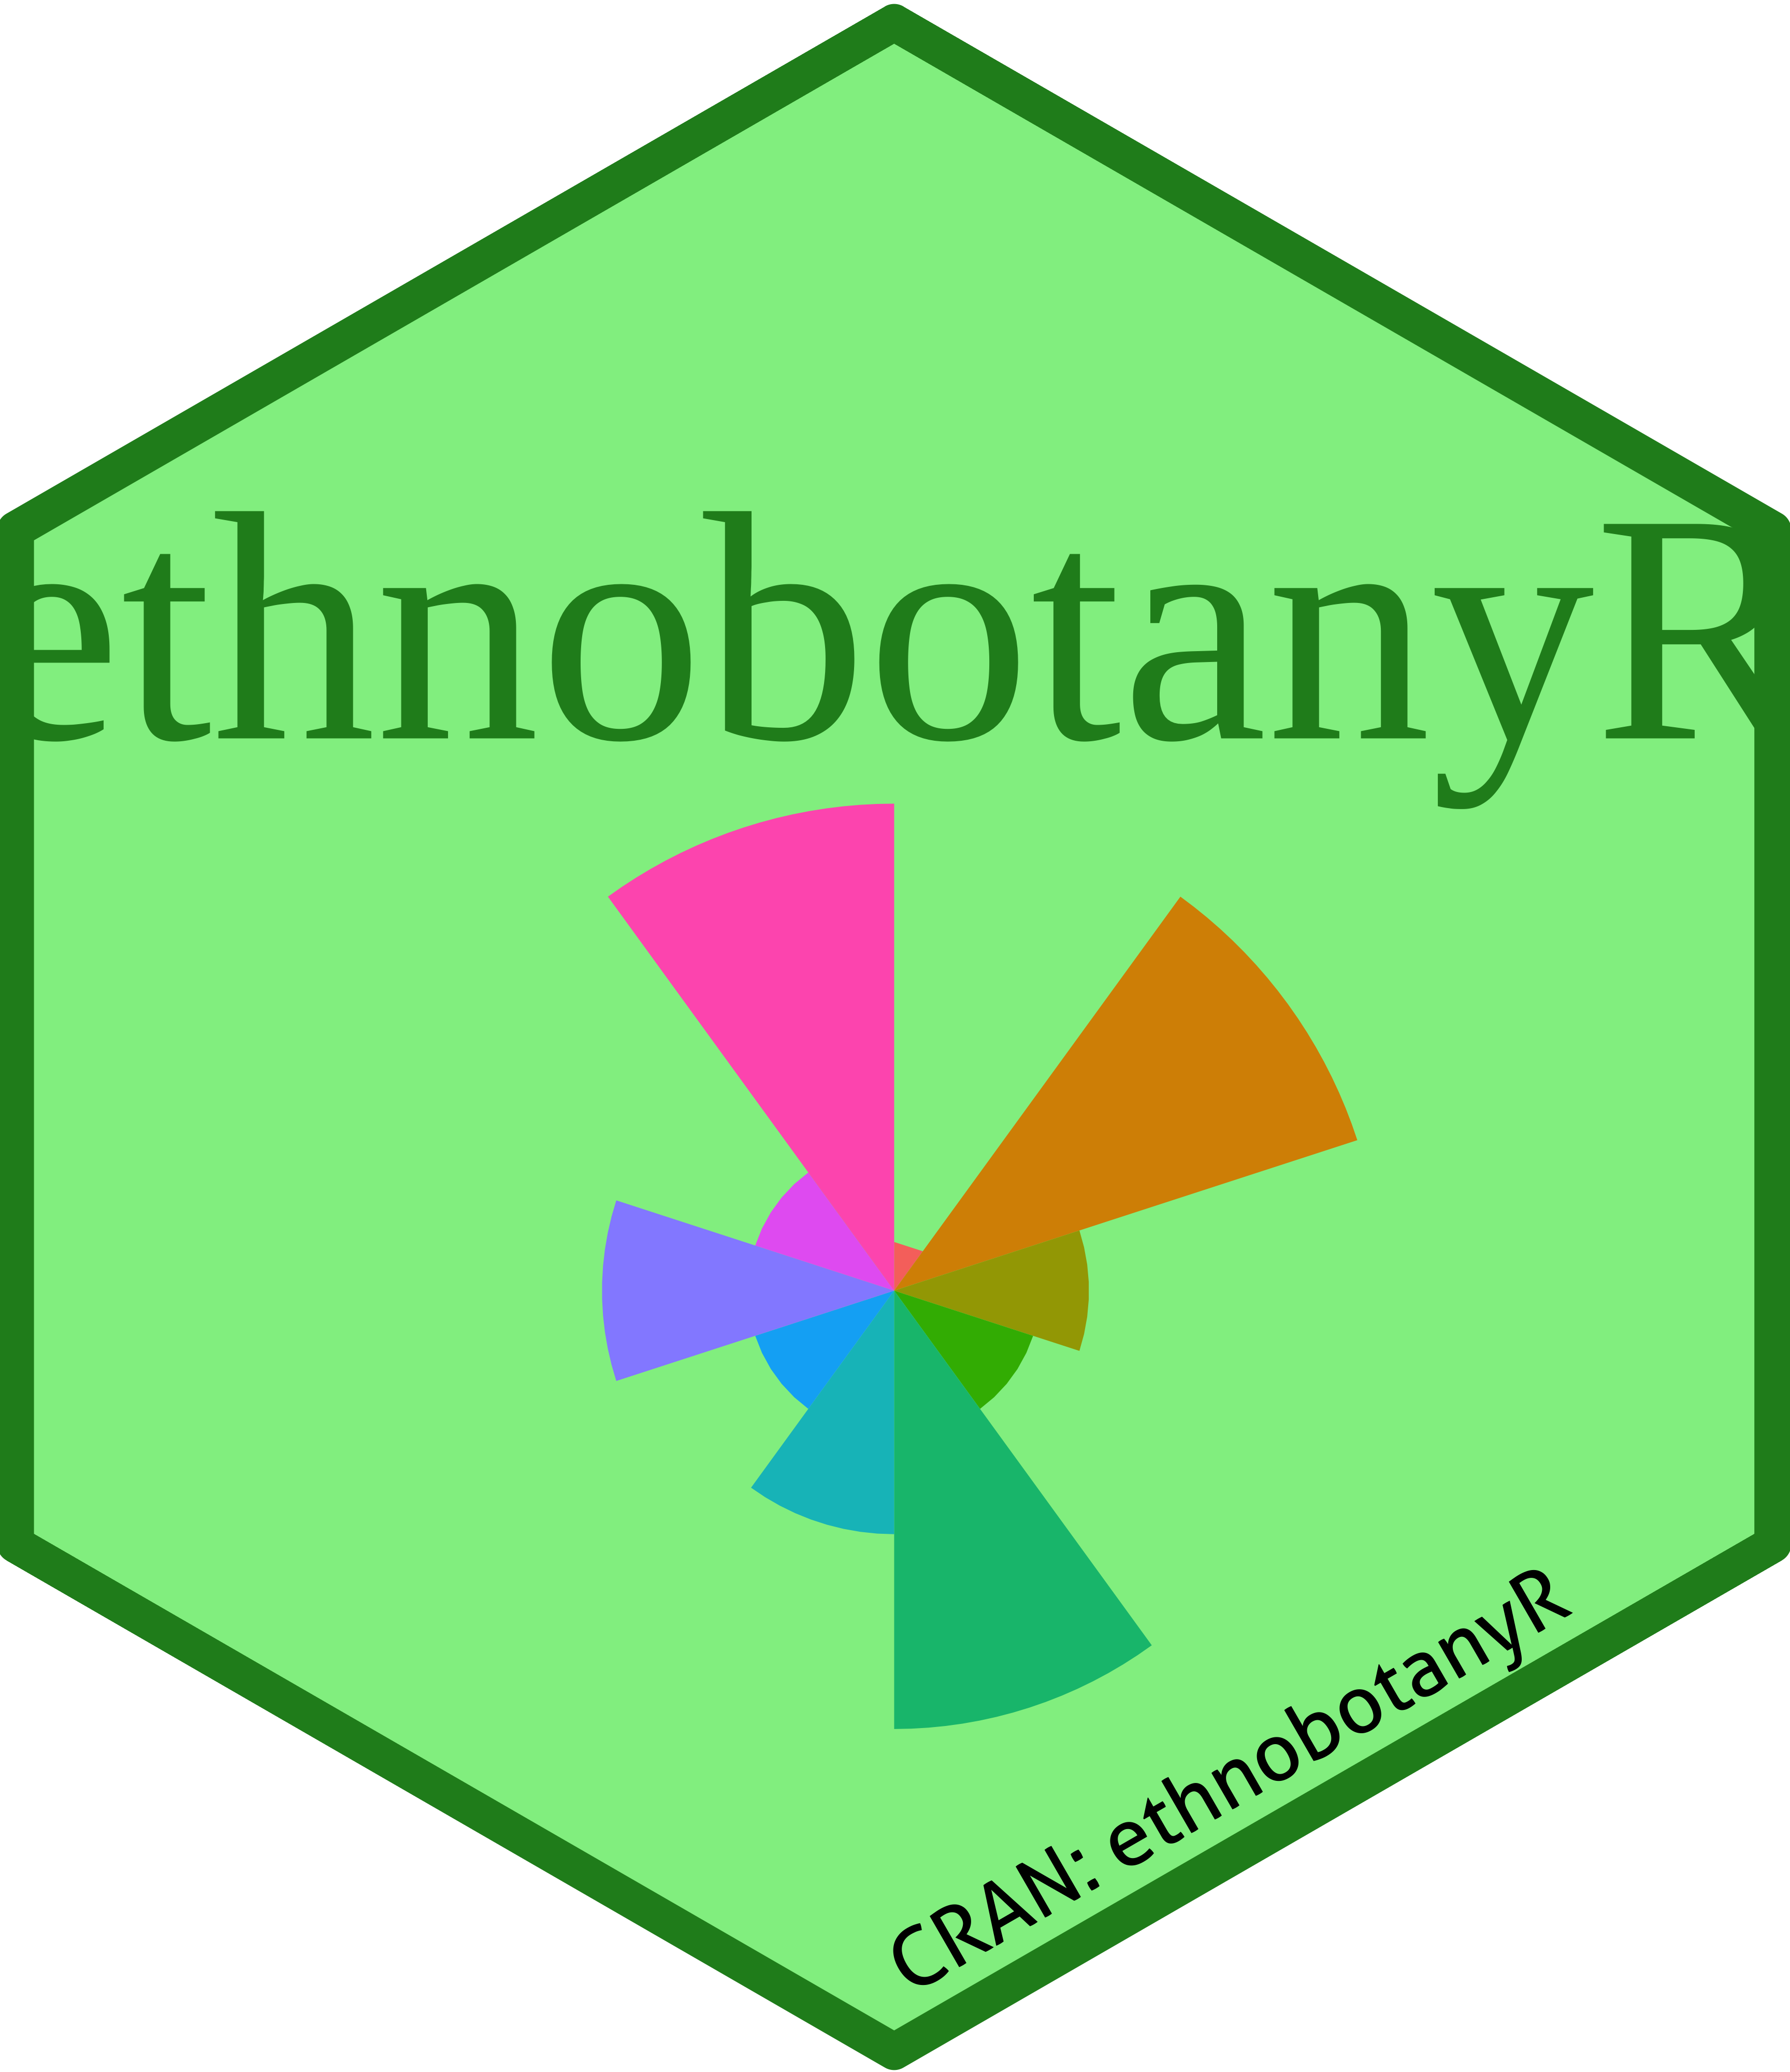
Here is a brief walk-through on how to use a version of the sticker
function from hexSticker (Yu 2021) to generate the hex sticker for the
ethnobotanyR package (Whitney 2021).
| Quick Links |
|---|
| Generate a sticker |
| Bordeless sticker |
| Small sticker |
Create a version of the sticker function from hexSticker. The new
function is, quite originally, named hex_sticker.
hex_sticker <-function (subplot, s_x = 0.8, s_y = 0.75, s_width = 0.4, s_height = 0.5,
    package, p_x = 1, p_y = 1.4, p_color = "#FFFFFF", p_family = "Aller_Rg",
    p_size = 8, h_size = 1.2, h_fill = "#1881C2", h_color = "#87B13F",
    spotlight = FALSE, l_x = 1, l_y = 0.5, l_width = 3, l_height = 3,
    l_alpha = 0.4, url = "", u_x = 1, u_y = 0.08, u_color = "black",
    u_family = "Aller_Rg", u_size = 1.5, u_angle = 30, white_around_sticker = FALSE,
    ..., filename = paste0(package, ".png"), asp = 1, dpi = 2000)
{
    hex <- ggplot() + geom_hexagon(size = h_size, fill = h_fill,
        color = NA)
    if (inherits(subplot, "character")) {
        d <- data.frame(x = s_x, y = s_y, image = subplot)
        sticker <- hex + geom_image(aes_(x = ~x, y = ~y, image = ~image),
            d, size = s_width, asp = asp)
    }
    else {
        sticker <- hex + geom_subview(subview = subplot, x = s_x,
            y = s_y, width = s_width, height = s_height)
    }
    sticker <- sticker + geom_hexagon(size = h_size, fill = NA,
        color = h_color)
    if (spotlight)
        sticker <- sticker + geom_subview(subview = spotlight(l_alpha),
            x = l_x, y = l_y, width = l_width, height = l_height)
    sticker <- sticker + geom_pkgname(package, p_x, p_y, p_color,
        p_family, p_size, ...)
    sticker <- sticker + geom_url(url, x = u_x, y = u_y, color = u_color,
        family = u_family, size = u_size, angle = u_angle)
    if (white_around_sticker)
        sticker <- sticker + white_around_hex(size = h_size)
    sticker <- sticker + theme_sticker(size = h_size)
    save_sticker(filename, sticker, dpi = dpi)
    invisible(sticker)
}
Create a small data set for the plot in the middle of the sticker.
eth_data <- data.frame(variable = as.factor(1:10),
                 value = sample(10, replace = TRUE))
Use the coord_polar function from ggplot2 to make the central chord
bar plot (Wickham et al. 2020). Different each time this is run.
ethnobotanyR_sticker <- ggplot(eth_data,
  aes(variable, value, fill = variable)) +
  geom_bar(width = 1, stat = "identity") +
  scale_y_continuous(breaks = 0:nlevels(eth_data$variable)) +
  theme_minimal() +
  coord_polar()+
  theme_void() +
  theme_transparent() +
  theme(legend.position="none")
Generate a png file of the hex sticker using the new hex_sticker
function.
hex_sticker(ethnobotanyR_sticker, p_size=6, s_x=1, s_y=.75, s_width=1.5, s_height=1.2, h_fill = "lightgreen", h_color = "forestgreen", p_family = "serif", p_color = "forestgreen", package="ethnobotanyR", url = "CRAN: ethnobotanyR", u_size = 2)
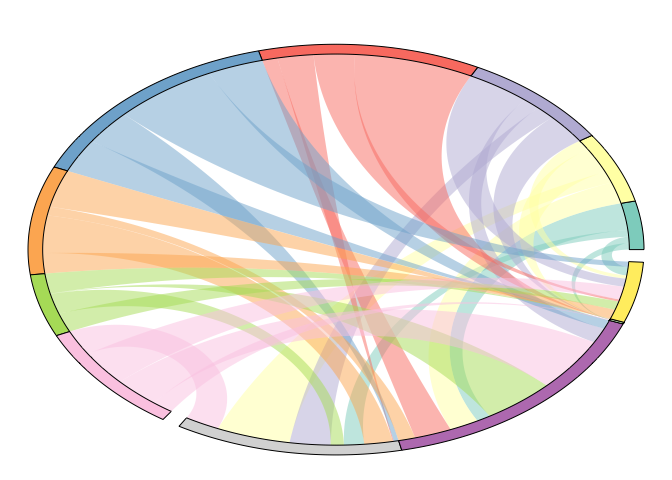
Create a simple chord plot in R (R Core Team 2021) and use colors from
RColorBrewer to fill the connections (Neuwirth 2014).
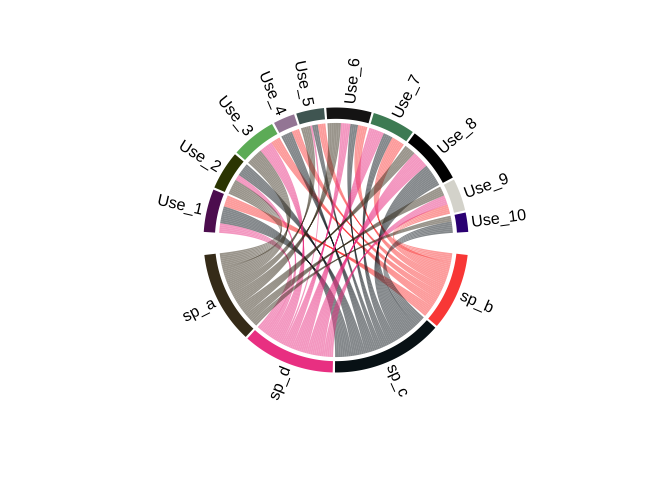
The ethnobotanyR package also has options for producing chord diagrams
with (Gu 2021) that may be part of future stickers (Whitney 2021). Here
is an example with the built-in data set ethnobotanydata.
ethno_chord_plot_sticker_mid <- ethnoChord(ethnobotanydata, by = "sp_name")
Gu, Zuguang. 2021. Circlize: Circular Visualization. https://CRAN.R-project.org/package=circlize.
Neuwirth, Erich. 2014. RColorBrewer: ColorBrewer Palettes. https://CRAN.R-project.org/package=RColorBrewer.
R Core Team. 2021. R: A Language and Environment for Statistical Computing. Vienna, Austria: R Foundation for Statistical Computing. https://www.R-project.org/.
Whitney, Cory. 2021. EthnobotanyR: Calculate Quantitative Ethnobotany Indices. https://CRAN.R-project.org/package=ethnobotanyR.
Wickham, Hadley, Winston Chang, Lionel Henry, Thomas Lin Pedersen, Kohske Takahashi, Claus Wilke, Kara Woo, Hiroaki Yutani, and Dewey Dunnington. 2020. Ggplot2: Create Elegant Data Visualisations Using the Grammar of Graphics. https://CRAN.R-project.org/package=ggplot2.
Yu, Guangchuang. 2021. HexSticker: Create Hexagon Sticker in R. https://github.com/GuangchuangYu/hexSticker.


