- Download the dataset for the project from this link.
- Open your terminal and run the following command to clone the project repository:
git clone https://github.com/CaglarGuher/IDRiD-Eye-Fundus-Dataset-Lesion-Segmentation.git-
Navigate to the
task_runner.pyfile in the cloned repository. -
Modify the following settings in the file:
-
Change the dataset root to the folder you downloaded and named "square format".
-
Choose whether to run the script with the preprocessed dataset (set to
True) or test the preprocessed version (also set toTrue, but not both). -
Adjust the cropping size (e.g., 576x576) and stride (ensure it is divisible by the original dataset size, 3456x3456).
-
Set the black ratio to determine the percentage of cropped images with black to delete (1 means delete every cropped image with black, which can improve model performance).
-
Specify the lesion type to work with (e.g., microaneurysm:
ma, hard exudate:ex, soft exudate:se, hemorrhage:he). -
Choose the encoder-decoder model to use (e.g., Unetplusplus with VGG19 as the encoder).
-
Decide whether to freeze all encoder layers during training (set to
Trueto freeze). -
Set the activation function (e.g., sigmoid, relu).
-
To see the full list of encoder ,decoder with preferable activation functions check the original repository Segmentation Models Pytorch
-
Adjust other parameters like batch size, epochs, learning rate, and weight decay as needed.
- Once the configuration is complete, run the script by executing the following command in your terminal:
python task_runner.py- After the script completes, check the
outfolder for the results. - You'll find mismatched images, models, and prediction arrays.
- Mismatched images are displayed with green representing True Positives (TP), red representing Ground Truth, and blue representing False Positives (FP).
- If you've run the code once with the same image type and cropping size, you can set
prepare_data_steptoFalseto save time. - The loss function for the project is Binary Cross Entropy (BCE) loss, and the optimizer is Adam with weight decay.
will be added soon
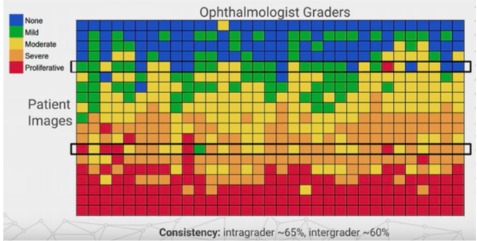
Diabetic retinopathy (DR) is a leading cause of blindness in adults due to diabetes, affecting over 400 million people worldwide. Early diagnosis through fundus photography is crucial for effective treatment. However, there's inconsistency among specialists in diagnosing DR due to the lack of specific criteria for classifying its stages.
The table shows the inconsistency for spesific DR stages.
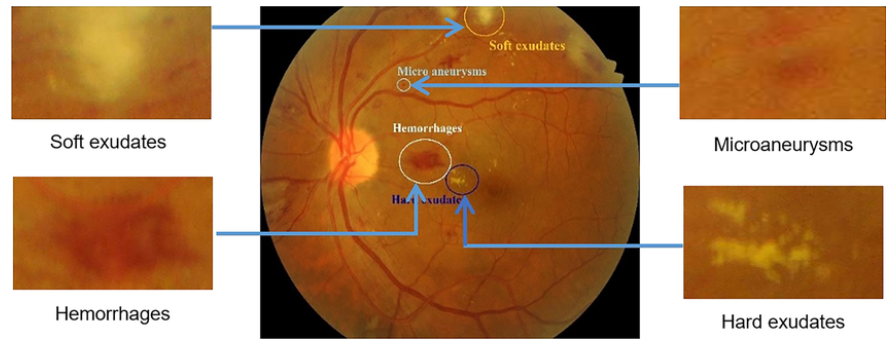
Microaneurysms are the earliest signs of DR, appearing as small, round, dark red dots. They can be up to 125 micrometers in size, smaller than the thickest blood vessels.
Hemorrhages result from the rupture of microaneurysms or blood vessels, causing bleeding. They are usually larger than microaneurysms and vary in shape. Unlike microaneurysms, they may not have sharp borders or colors.
Exudates refer to the leakage of fluids, proteins, and other substances from retinal blood vessels. There are various types, including hard exudates and cotton wool spots. Hard exudates appear as small, yellow-white deposits, while cotton wool spots are cloud-like, fuzzy, white, or gray lesions observed in the retina.
All lesions can be seen here.
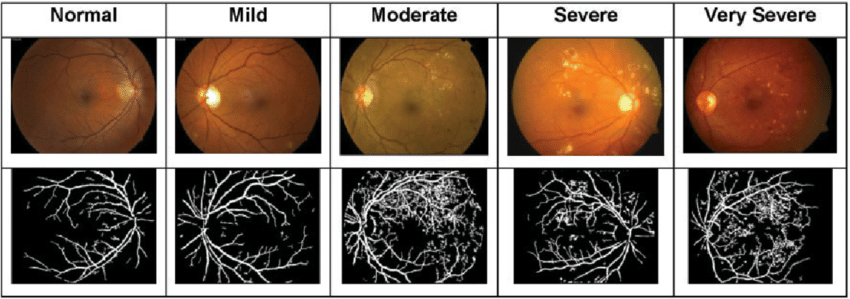
DR has two main stages: proliferative and non-proliferative, with the non-proliferative stage further divided into three. This makes a total of four stages:
- Mild NPDR (Non-Proliferative Diabetic Retinopathy): Minor damage and swelling in the retinal blood vessels, with microaneurysms present. Vision problems are usually minimal, and treatment may not be necessary.
- Moderate NPDR: More pronounced vessel damage, with increased narrowing and deposits on the retinal surface. Vision blurring and other symptoms may occur, and treatment involves monitoring and improved diabetes control.
- Severe NPDR: Significant vessel damage leading to reduced eye nourishment. Bleeding and yellow spots on the retina become more prominent. Without treatment, vision problems can become permanent.
- PDR (Proliferative Diabetic Retinopathy): The most severe stage, characterized by serious vessel damage and the formation of abnormal new vessels. This stage can lead to serious complications requiring urgent medical intervention.
Stages of DR disease can be seen here.
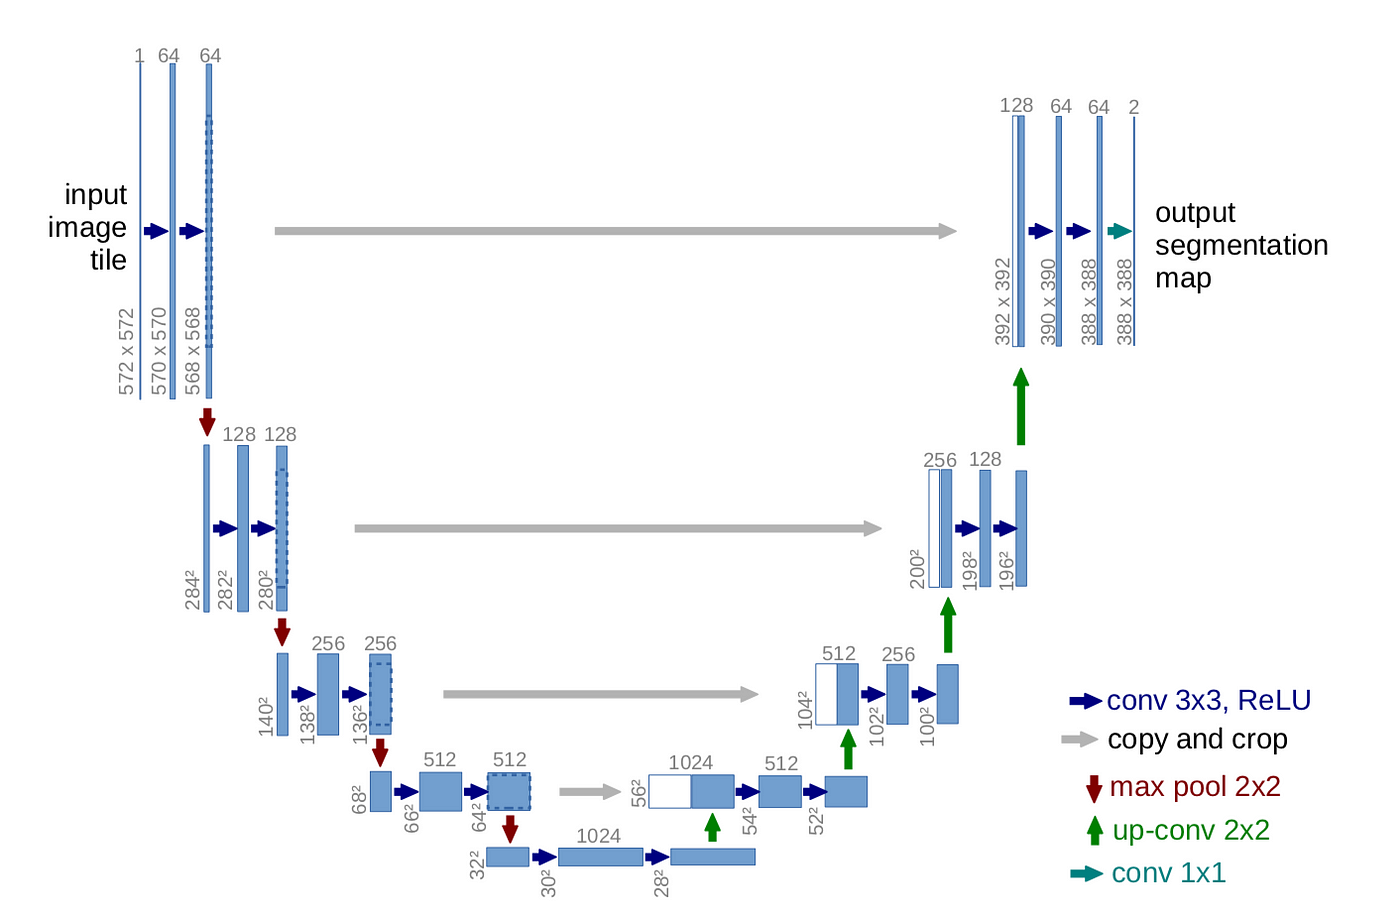
- UNet: Known for its encoder-decoder structure, capturing hierarchical features using convolutional and pooling layers. Skip connections preserve detailed information.
Unet Architecture.
- DeepLab: Uses dilated convolutions and atrous spatial pyramid pooling (ASPP) to capture multi-scale features. Variants like DeepLabv3 enhance its capabilities.
- FCN (Fully Convolutional Networks): Composed of convolutional layers, preserving spatial information throughout the network.
- Mask R-CNN: Originally for object detection, includes a mask prediction branch for pixel-level segmentation.
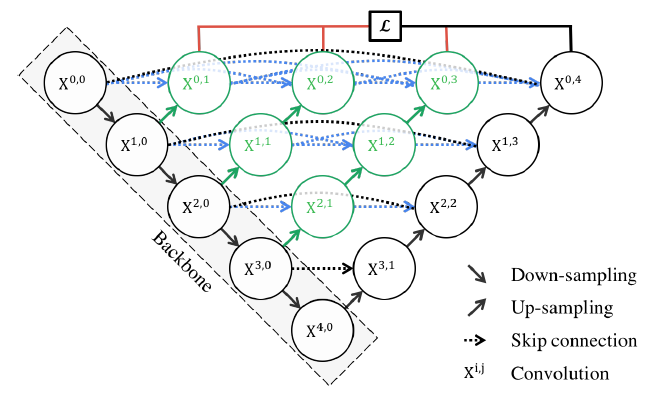
- UNet++: Extends UNet with nested skip pathways for improved feature capture.
UnetPlusPlus Architecture.
- Attention U-Net: Incorporates attention mechanisms to focus on specific regions of the image.
- ResUNet: Combines UNet with residual connections from ResNet, enabling deeper networks.
These models are widely used in biomedical imaging due to their effectiveness in segmenting images, including those related to diabetic retinopathy.
Table 1 presents results of studies on the IDRiD dataset, showing AUPR for various lesion types.
| Method | AUPR (EX) | AUPR (HE) | AUPR (MA) | AUPR (SE) | Average |
|---|---|---|---|---|---|
| L-Seg | 79.45 | 63.74 | 46.27 | 71.13 | 65.15 |
| Local-Global UNets | 88.90 | 70.30 | 52.50 | 67.90 | 69.90 |
| VRT | 71.27 | 68.04 | 49.51 | 69.95 | 64.69 |
| PATech | 88.50 | 64.90 | 47.40 | - | - |
| iFLYTEK-MIG | 87.40 | 55.88 | 50.17 | 65.88 | 64.84 |
| PBDA | 86.43 | 71.53 | 53.41 | 73.07 | 71.11 |
| PBDA (UNet++) | 81.04 | 64.08 | 49.17 | 68.88 | 65.48 |
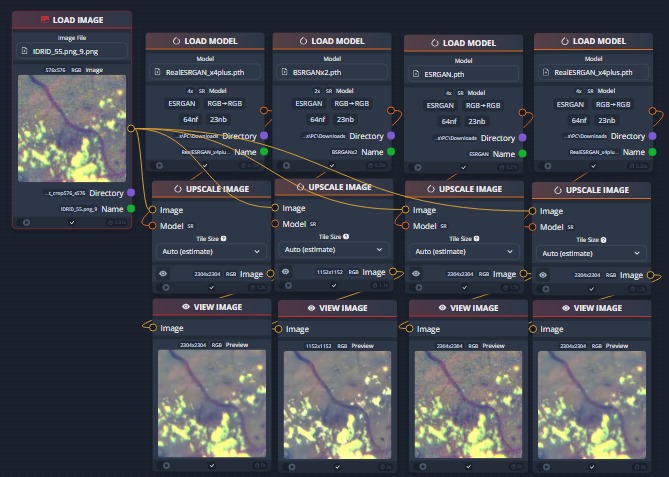
The BSRGAN model is used for noise reduction, producing efficient results.All the possible candidates for the noise reduction models (upscale models) is tested using Chainner.For more detailed information check the original reporsitory. ChaiNNer
Testing different upscale images using ChaiNNer
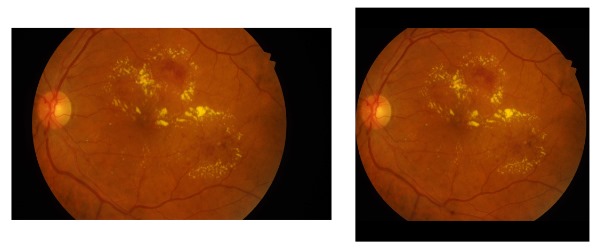
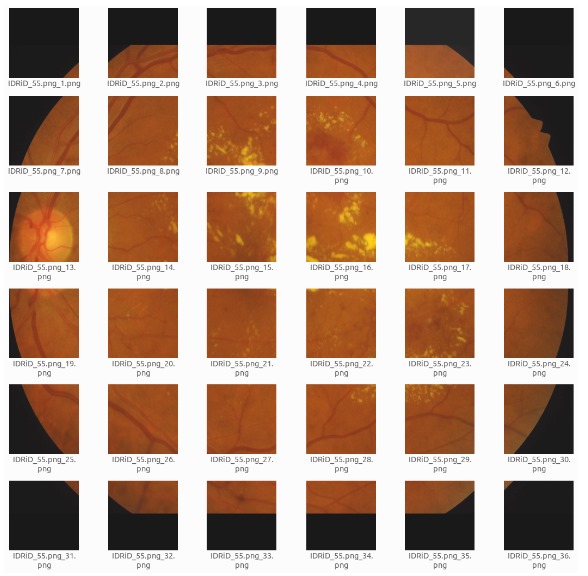
To address the limited number of annotated images in medical datasets like retinal images, a cropping strategy is used to resize the images into 576x576-pixel patches, balancing dataset size and information content. in order to crop the images by 576x576 the images are reshaped in to 3456x3456 with adding black borders as it can be seen in.
Reshaping and adding black border
Cropping images into 576*576
The sliding window technique is then applied with a specified overlap to augment the dataset, ensuring lesion coverage while increasing the diversity of training samples.
| Lesion Location | Accuracy | Precision | Recall | F1 Score | IoU |
|---|---|---|---|---|---|
| Central | 0.80 | 0.58 | 0.43 | 0.49 | 0.34 |
| Peripheral | 0.81 | 0.57 | 0.39 | 0.46 | 0.33 |
Patches created by sliding a window over the image were merged to form a complete prediction image. The center merge algorithm used only the center region of each patch for composition.
The model's edge detection is weaker due to partial lesions at the edges, which affects pixel adjacency and lesion structure. To address this, only the center part of the patches was used.
Explanation of Centre Merge Algorithm
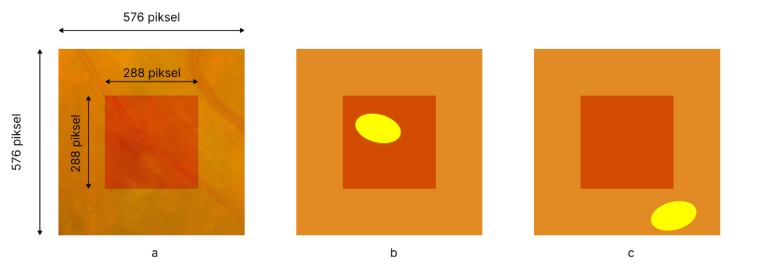
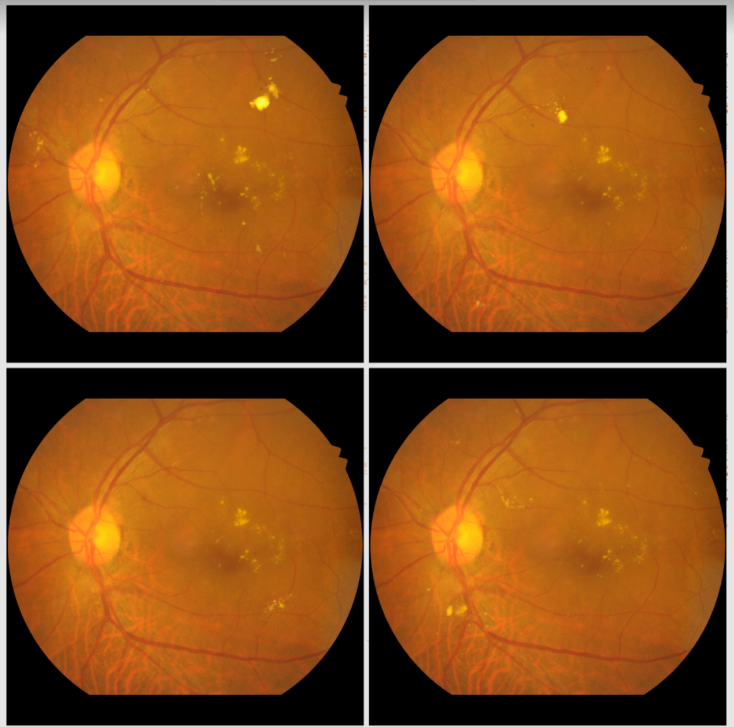
The PBDA method seamlessly integrates synthetic lesions into retinal images, enhancing dataset diversity. Small lesion images with masks are placed in various positions within the retinal images, and the Poisson blending method is used to ensure realistic integration. Random transformations are applied to the synthetic lesions to increase diversity and prevent overfitting. This method not only introduces lesions but also creates variations of retinal images, contributing to the model's robustness.
Generating different fundus images using PBDA method
During the study, the methods explained in the previous sections were individually tested with isolated experiments. Additionally, each of the 4 lesion types was independently tested, and the results are presented. The effects of cropping, sliding window, preprocessing techniques, noise reduction techniques, the PBDA method, and the use of healthy images for each lesion are listed. The experimental results are presented using the following metrics: Accuracy, Recall, Precision, F1 Score, IoU, and AUC under the precision-recall curve.
| Cropping Size | Accuracy | F1 Score | IoU | Precision | Recall | AUC PR |
|---|---|---|---|---|---|---|
| 288 | 0.6707 | 0.4729 | 0.3096 | 0.4846 | 0.4616 | 0.4670 |
| 576 | 0.7331 | 0.4985 | 0.3432 | 0.55439 | 0.4528 | 0.4948 |
| 1152 | 0.7670 | 0.4691 | 0.3077 | 0.5682 | 0.3995 | 0.3650 |
The highest-performing cropping size was 576x576 pixels, providing a balance between local information and the overall image.
| Cropping Size | Sliding Size | Accuracy | F1 Score | IoU | Precision | Recall | AUC PR |
|---|---|---|---|---|---|---|---|
| 576 | 576 | 0.7331 | 0.4985 | 0.3432 | 0.5543 | 0.4528 | 0.4948 |
| 576 | 288 | 0.7443 | 0.5068 | 0.3508 | 0.5703 | 0.4560 | 0.5120 |
Overlapping sliding windows during training and testing improved performance compared to non-overlapping windows.
| Preprocessing | Accuracy | F1 Score | IoU | Precision | Recall | AUC PR |
|---|---|---|---|---|---|---|
| None | 0.7443 | 0.5068 | 0.3508 | 0.5703 | 0.4560 | 0.5120 |
| Applied | 0.7853 | 0.4983 | 0.3538 | 0.6072 | 0.4225 | 0.5239 |
The preprocessing technique improved the model's performance for microaneurysms.
| Noise Reduction | Accuracy | F1 Score | IoU | Precision | Recall | AUC PR |
|---|---|---|---|---|---|---|
| None | 0.7853 | 0.4983 | 0.3538 | 0.6072 | 0.4225 | 0.5239 |
| Applied | 0.8253 | 0.4819 | 0.3586 | 0.6451 | 0.3845 | 0.5297 |
The noise reduction technique improved various performance metrics.
| PBDA | Accuracy | F1 Score | IoU | Precision | Recall | AUC PR |
|---|---|---|---|---|---|---|
| None | 0.8253 | 0.4819 | 0.3538 | 0.6451 | 0.3845 | 0.5297 |
| Applied | 0.8331 | 0.4764 | 0.3238 | 0.6521 | 0.3752 | 0.5454 |
The PBDA method, which involved augmenting the dataset, resulted in a model with improved confidence in predictions.
| Data Used | Accuracy | F1 Score | IoU | Precision | Recall | AUC PR |
|---|---|---|---|---|---|---|
| PBDA | 0.8331 | 0.4764 | 0.3238 | 0.6521 | 0.3752 | 0.5454 |
| PBDA + Healthy | 0.8376 | 0.4831 | 0.3298 | 0.6623 | 0.3802 | 0.5646 |
By adding healthy retina images to the dataset, the model's performance improved across all metrics.
Comparison between 576x576 and 1152x1152 pixel cropping sizes showed that 576x576 pixels provided better performance for exudate detection.
| Cropping Size | AUC PR | F1 Score | Accuracy | Precision | Recall | IoU |
|---|---|---|---|---|---|---|
| 576x576 | 0.8902 | 0.7998 | 0.9021 | 0.8719 | 0.7386 | 0.6664 |
| 1152x1152 | 0.8231 | 0.7399 | 0.8761 | 0.8258 | 0.6701 | 0.6015 |
The sliding window technique improved the model's performance for both 576x576 and 288x288 pixel cropping sizes.
| Sliding | AUC PR | F1 Score | Accuracy | Precision | Recall | IoU |
|---|---|---|---|---|---|---|
| 576 | 0.8902 | 0.7998 | 0.9021 | 0.8719 | 0.7386 | 0.6664 |
Preprocessing techniques improved the model's performance for exudate detection.
| Preprocessing | F1 Score | Accuracy | Precision | Recall | IoU | AUC PR |
|---|---|---|---|---|---|---|
| None | 0.7998 | 0.9021 | 0.8719 | 0.7386 | 0.6664 | 0.8902 |
| Applied | 0.8132 | 0.8823 | 0.8535 | 0.7766 | 0.6852 | 0.8972 |
The noise reduction technique had varying effects based on the cropping size, showing improvements for 1152x1152 but a decrease for 576x576.
| Noise Reduction | F1 Score | Accuracy | Precision | Recall | IoU | AUC PR |
|---|---|---|---|---|---|---|
| None | 0.7399 | 0.8761 | 0.8258 | 0.6701 | 0.6015 | 0.8231 |
| Applied | 0.7645 | 0.8607 | 0.8162 | 0.7189 | 0.6341 | 0.8497 |
####Effect of PBDA Method: The PBDA method improved the model's performance for detecting exudates.
| PBDA | F1 Score | Accuracy | Precision | Recall | IoU | AUC PR |
|---|---|---|---|---|---|---|
| None | 0.7998 | 0.9021 | 0.8719 | 0.7386 | 0.6664 | 0.8902 |
| Applied | 0.8174 | 0.8800 | 0.8520 | 0.7855 | 0.7526 | 0.9019 |
####Effect of Healthy Data: Including healthy data did not significantly improve the model's performance for exudate detection.
| Healthy Data | F1 Score | Accuracy | Precision | Recall | IoU | AUC PR |
|---|---|---|---|---|---|---|
| PBDA | 0.8174 | 0.8800 | 0.8520 | 0.7855 | 0.7526 | 0.9019 |
| Healthy | 0.8042 | 0.9060 | 0.8774 | 0.7423 | 0.7345 | 0.8959 |
@article{wang2022DRseg,
  title={Anomaly Segmentation in Retinal Images with Poisson-Blending Data Augmentation},
  author={Hualin Wang, Yuhong Zhou, Jiong Zhang, Jianqin Lei, Dongke Sun, Feng Xu, Xiayu Xu},
  journal={Medical Image Analysis},
  year={2022},
  doi={https://doi.org/10.1016/j.media.2022.102534}
}
@misc{Iakubovskii:2019,
  Author = {Pavel Iakubovskii},
  Title = {Segmentation Models Pytorch},
  Year = {2019},
  Publisher = {GitHub},
  Journal = {GitHub repository},
  Howpublished = {\url{https://github.com/qubvel/segmentation_models.pytorch}}
}
