A statistical analysis tool for game benchmarks using Bokeh and Numpy.
The goal is to enable visual and mathematical analysis of benchmark data generated by PresentMon, a tool developed by Intel for collecting frame time data on Windows. PresentMon supports any graphics API (DX, OpenGL, Metal, etc) as well as UWP, so this tool can in principle be used to analyze the performance of a wide range of Windows applications.
PresentMon outputs data in CSV format, either to file or standard output (STDOUT). PresentMonAnalysis is intended to easier gain insights from the generated data using relatively simple tools.
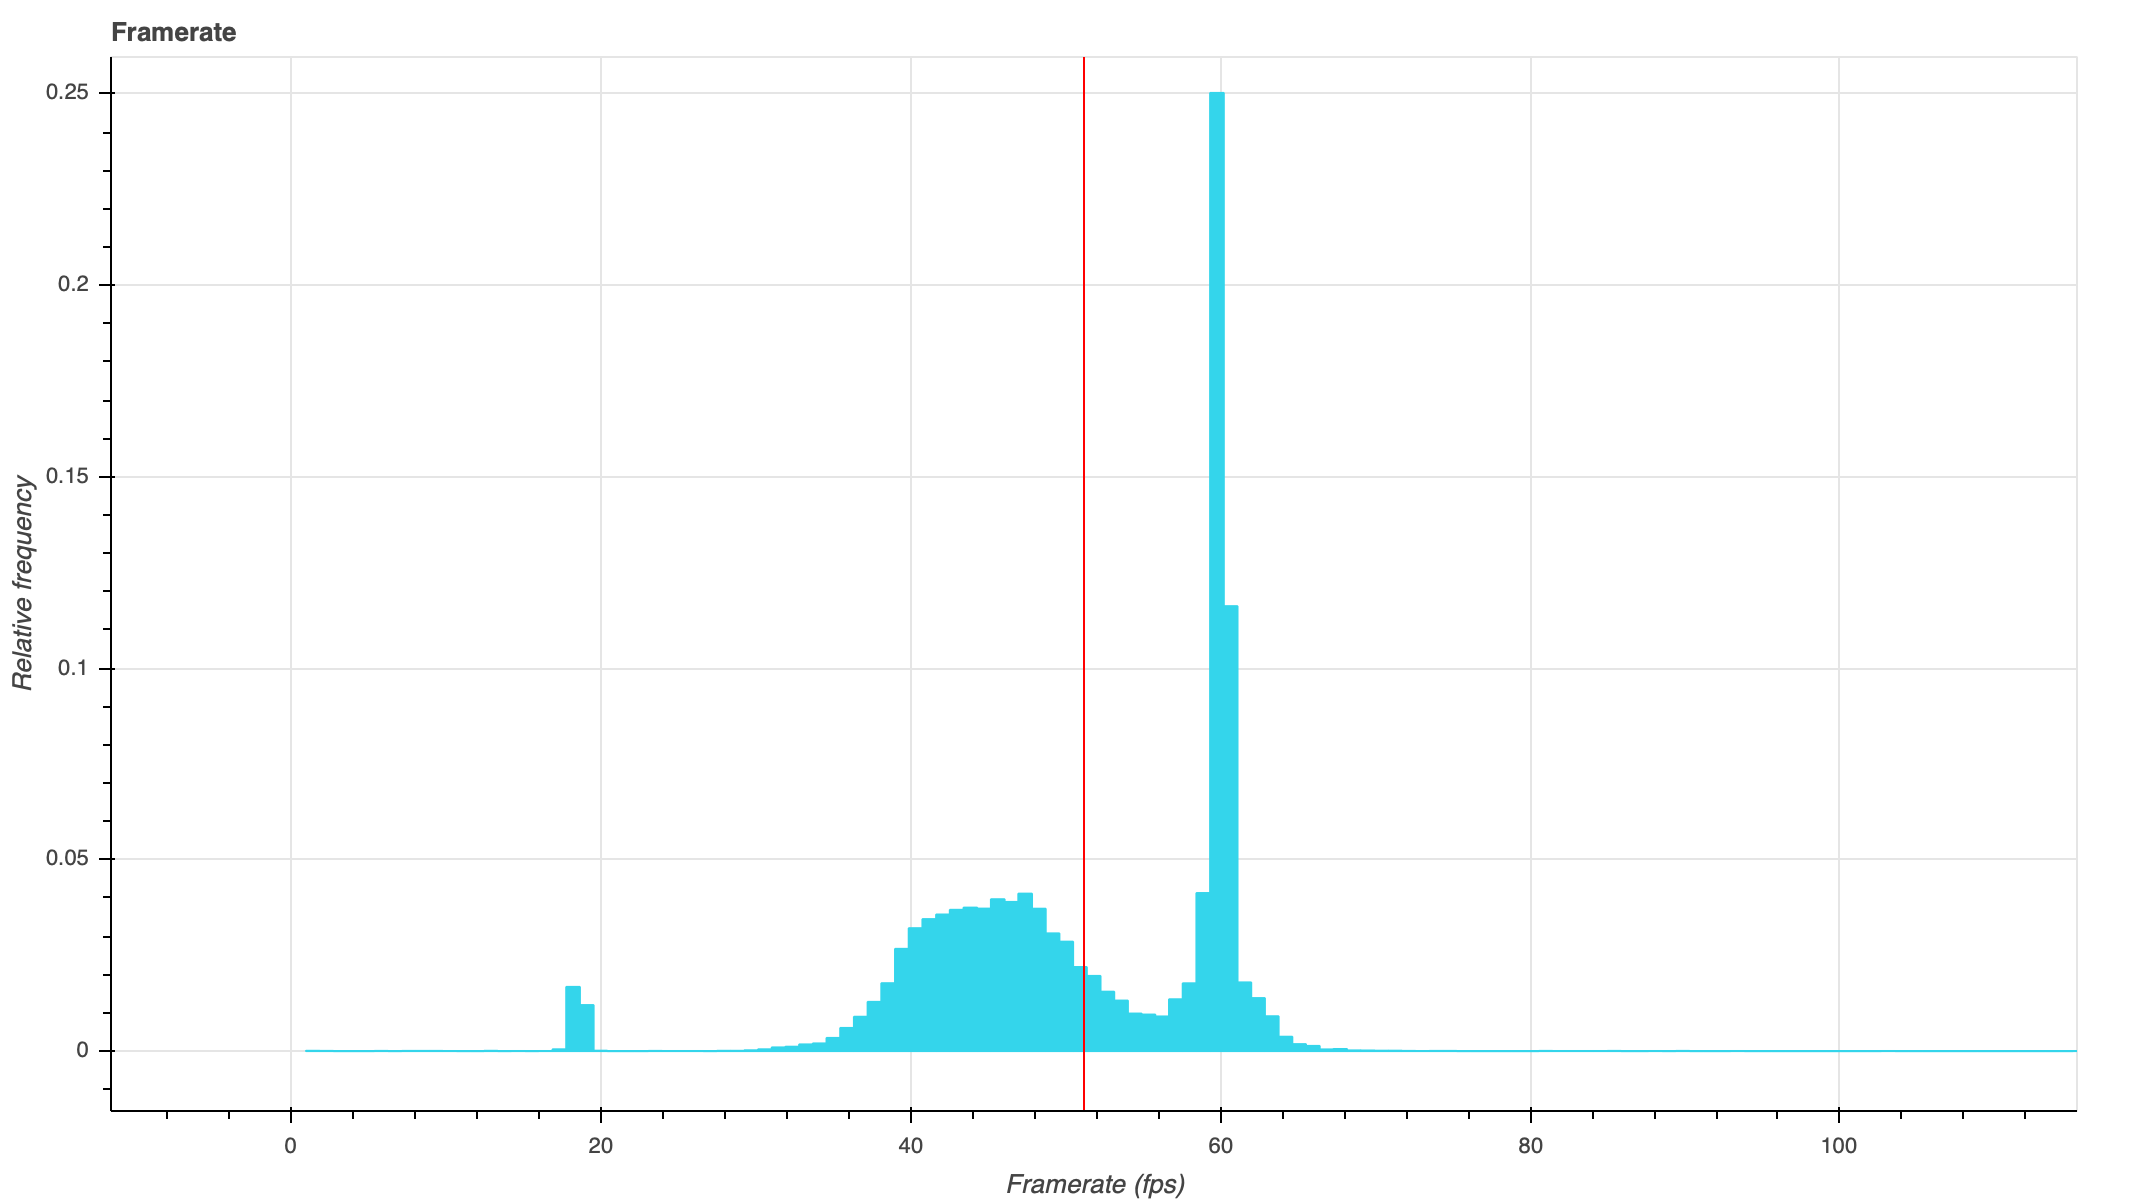
 Example output of a framerate distribution, representing the proportion of frames corresponding to a framerate in any interval.
This tool uses Bokeh to generate interactive charts in HTML and JS.
Python PresentMonAnalysis [-f PATH] [-debug]
Use the -f PATH argument to manually supply a CSV file (single file for now).
Use the -debug argument to print debug info during runtime (such as total script time).
You can use either -f PATH, -debug or both.
Using -debug without specifying -f PATH will make use of a supplied example file. Using them in conjuction will print debug info for the manually selected file. Using no argument at all will print an error.
Example:
Python PresentMonAnalysis -f ./TestData/csgo.csv
- Histogram view with fixed values representing the relative frequency of FPS values or frametimes.
- Frametimes and FPS plotted against time
- Tabbed switching between frame times and framerate
- Text box with basic frame-to-frame statistics (maximum, minimum and average difference in rendering time between two successive frames)
- Some basic styling (via dictionaries)
- Multi-file support (appending time stamps)
- Hover tool for reading exact data points in interactive charts
- Real CSS stylesheet
- Switching between frame data (for instance, between msBetweenPresents and msUntilDisplayed)
- More advanced statistics
- Analysis by percentile
- Stutter analysis
- Average/max/min time before framerate drops under certain thresholds (60/120/144 Hz etc)
- Python 3.7
- Numpy
- Bokeh
