LightPipes
Simulations of optical phenomena where diffraction is essential
LightPipes is a set of functions written in C++. It is designed to model coherent optical devices when the diffraction is essential.
The toolbox consists of a number of functions. Each function represents an optical element or a step in the light propagation. There are apertures, intensity filters, beam-splitters, lenses and models of free space diffraction. There are also more advanced tools for manipulating the phase and amplitude of the light. The program operates on a large data structure, containing square two-dimensional arrays of complex amplitudes of the optical field of the propagating light beam.
The LightPipes routines are modifications of the LightPipes C routines written by Gleb Vdovin for Unix, Linux, DOS and OS2 workstations.
Visit the website of Flexible Optical: http://www.okotech.com, where you can find the source code of LightPipes and a manual.
Install
LightPipes support Windows 32bit and 64bit, Macintosh OSX, Linux 32bit and 64bit. It support python 2.7, 3.4, 3.5, 3.6, 3.7 currently. The newest version, 1.2.0, can also be installed on a Raspberry Pi with Python 3.7.
The packages are on PyPi, so simply open a terminal window and type at the prompt:
pip install LightPipesYou can also download packages from Releases.
Document
https://opticspy.github.io/lightpipes/
Example: Young interferometer
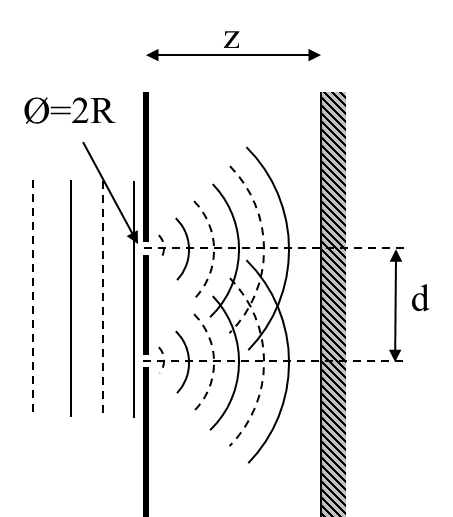
A plane wave is diffracted by two small holes, separated a distance, d. So two more or less spherical waves will propagate from these holes.
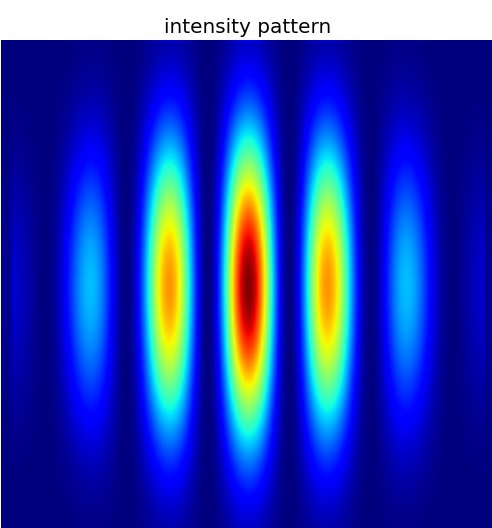
The resulting interference pattern on a screen at distance z looks like:
The Python program Young.py described in detail.
The first step in Python is to import the LightPipes library:
from LightPipes import *Besides the LightPipes library, we import units and a few more in this way.
If the LightPipes library is successful installed on your computer Python can proceed with the next step. You probably want to plot the results, so import matplotlib:
import matplotlib.pyplot as pltNext we define some variables: a wavelength of 20 micrometer , a 30 x 30 mm2 square grid with 500 x 500 pixels.
wavelength = 20*um
size = 30.0*mm
N = 500
Now we are ready to start the simulation. The Begin command generates a field with amplitude 1.0 and phase zero, a plane wave. So, all the 500 x 500 elements of array, F, contain the complex number: 1.0 + j0.0. The next commands generate two waves, F1 and F2, which are apertured by the two circular apertures and combined (simply added) by the BeamMix command. The combined wavefront is propagated a distance z=30 cm by the Fresnel command. After that the intensity is caculated and normalized to 255 (2 -> 255, 1 -> 1.0, 0 -> not normalized) by the Intensity command.
F = Begin(size,wavelength,N)
F1 = CircAperture(0.15*mm, -0.6*mm,0, F)
F2 = CircAperture(0.15*mm, 0.6*mm,0, F)
F = BeamMix(F1,F2)
F = Fresnel(10*cm,F)
I = Intensity(2,F)
The result is plotted using the fantastic matplot routines. We are not interested in axis around the pattern and we like to write a title above the plot.
plt.imshow(I, cmap='rainbow');
plt.axis('off');
plt.title('intensity pattern')
plt.show()
Build wheels
Linux
- install docker from https://www.docker.com/products/docker
cd tools/linux- build for linux 32bit:
bash build-linux-x32.sh - build for linux 64bit:
bash build-linux-x64.sh
MacOS
- install Miniconda3 from https://conda.io/miniconda.html
- install invoke and delocate:
pip install invoke delocate cd tools/macostheninv build_all
Windows
- install Miniconda3 32bit(name it
Miniconda32) and Miniconda3 64 bit(name itMiniconda64), they can be downloaded from https://conda.io/miniconda.html - install invoke:
pip install invoke cd tools/windowstheninv build_all

