A set of plots developed with version 7 of D3.JS and integrated with ReactJS version 18.
This pack of plots includes:
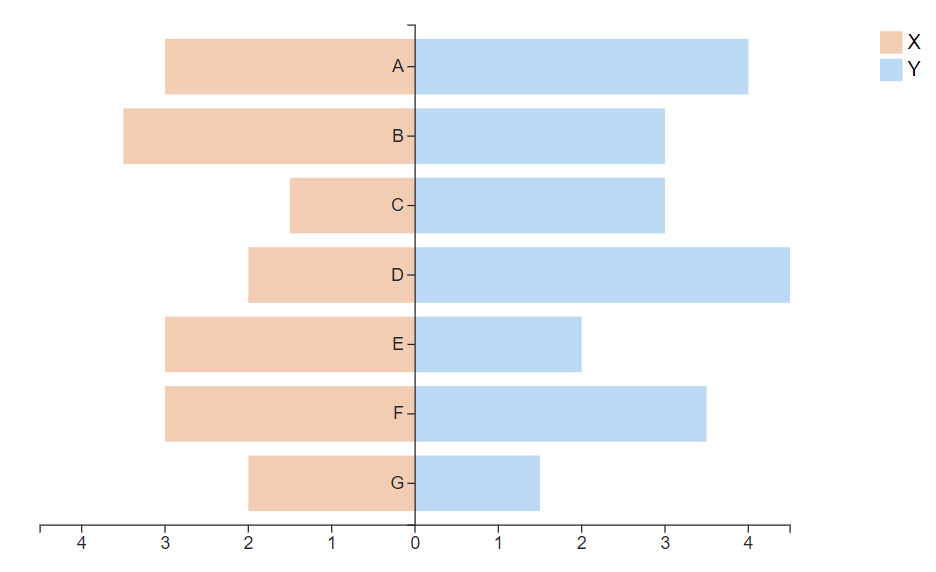
- Bidirectional bar chart
- Grouped bar chart
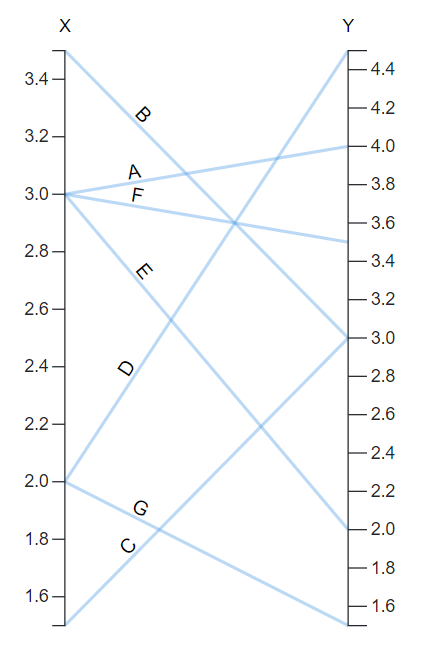
- Parallel coordinates plot
- Scatterplot
Interaction allowed:
- Hovering
- Selecting
git clone https://github.com/CarolinaMPereira/D3-V7-React-Visualizations.git
cd D3-V7-React-Visualizations
npm i
npm run start
Open http://localhost:3000/ in your web browser.


