Simple financial applications & analysis programs written in R language
SHY: The 'SHarpe Yield' Strategy // SHY strategy on the whole Taiwan Stock Market
The R programming language is designed for statistical analysis, and is widely used in many area recently. Here, I will focus on one of the most adopting domain, financial analysis, to demonstrate the strength of R. Besides, I shall pay extra attention to data visualizaiton in R.
The introduced investment strategy, SHY 'SHarpe Yield', has a very simple computation model. It evaluates each stock by the SHY value, simply yield represents in a sharpe ratio way, i.e., its mean divided by its standard deviation. Given a list of sample stocks in folder csv/ (a dozen stock csv files reside), we can compute the SHY values and report the SHY value as follows:
    source("shy.R")
    shy_list = get_shy_suggestion()
Then, it shows
[1] "( 1) 個股:2382, SHY:3.529709"
[1] "( 2) 個股:2912, SHY:3.470507"
[1] "( 3) 個股:1101, SHY:3.037783"
[1] "( 4) 個股:2330, SHY:2.506207"
[1] "( 5) 個股:2207, SHY:2.486131"
[1] "( 6) 個股:2801, SHY:3.330069"
[1] "( 7) 個股:2701, SHY:3.978262"
[1] "( 8) 個股:2357, SHY:2.116582"
[1] "( 9) 個股:2325, SHY:2.385228"
[1] "(10) 個股:1434, SHY:3.511784"
[1] "(11) 個股:2354, SHY:1.811173"
[1] "(12) 個股:0050, SHY:NA"
[1] "(13) 個股:2408, SHY:NA"
Based on the computed SHY value, we can form a strategy that selects stocks with better SHY, for example, buy a bunch of stocks with better SHY value periodically, just as the way as ETF (Exchange Traded Funds) does.
Would you like to believe a strategy is good when someone throws it to you and claims that it is? I hope not.
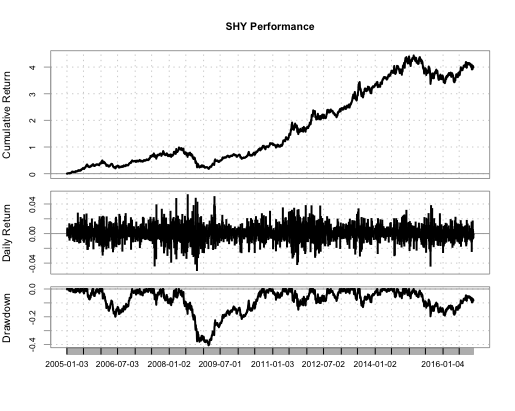
Here, PerformanceAnalytics, a powerful module in finance evaluation in R is adopted, to express the quality of SHY:
    source("shy_eval.R")
    eval_res = evaluate_shy()
The result is then shown in your RStudio console:
(Note: here we buy 3 stocks based on SHY values periodically, among the candidates)
In case that the performance comparison between two targets is interested, we can put the two targets in same evaluation:
eval_pair_res = evaluate_shy_stock('2330')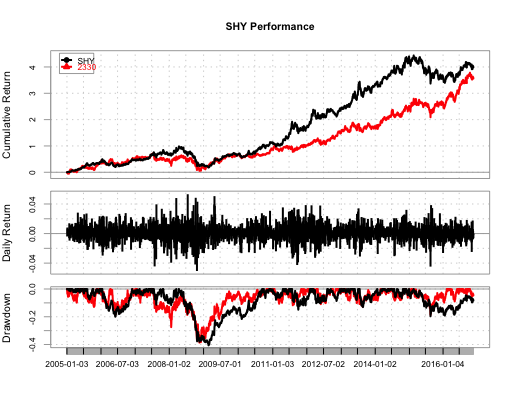
Another way to compare performance is to use a relative performance view:
eval_rel_res = evaluate_shy_stock_relative('2357')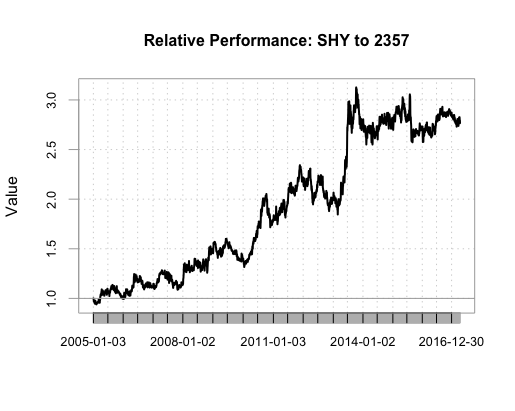
If some stocks, instead of SHY are interested, we can do the following:
    source('stock_eval.R')
    evaluate_stock('2330')
    evaluate_stock_pair('2330', '2357')
    evaluate_stock_pair_relative('2330', '2357')
Don't forget to try above yourself to see how the result is. :)
Note: have 'DEBUG=1' to show more message during computation
Visualization is always a good idea for better comprehension, especially when it is presented by a web page. Shiny is yet one perfect web visualization framework to help R programmers present their work as a web page, in less effort without downgraded outcome. A page on how SHY performs, under the whole Taiwan Stock Market, can be found at:
SHY: The 'SHarpe Yield' Strategy // SHY strategy on the whole Taiwan Stock Market
There is also a page for simple data visualization, which you can open it locally as follows:
    library(shiny)
    setwd("SHY_draft")
    runApp()
Or visit the online page: SHY_draft: Simple demonstration for data visualization
For future plan, I will present programs utilize some other R features in terms of financial analysis:
- Probability Distributions
- Linear Least Square Regression
- Confidence Intervals
- pValues
- Power of a test