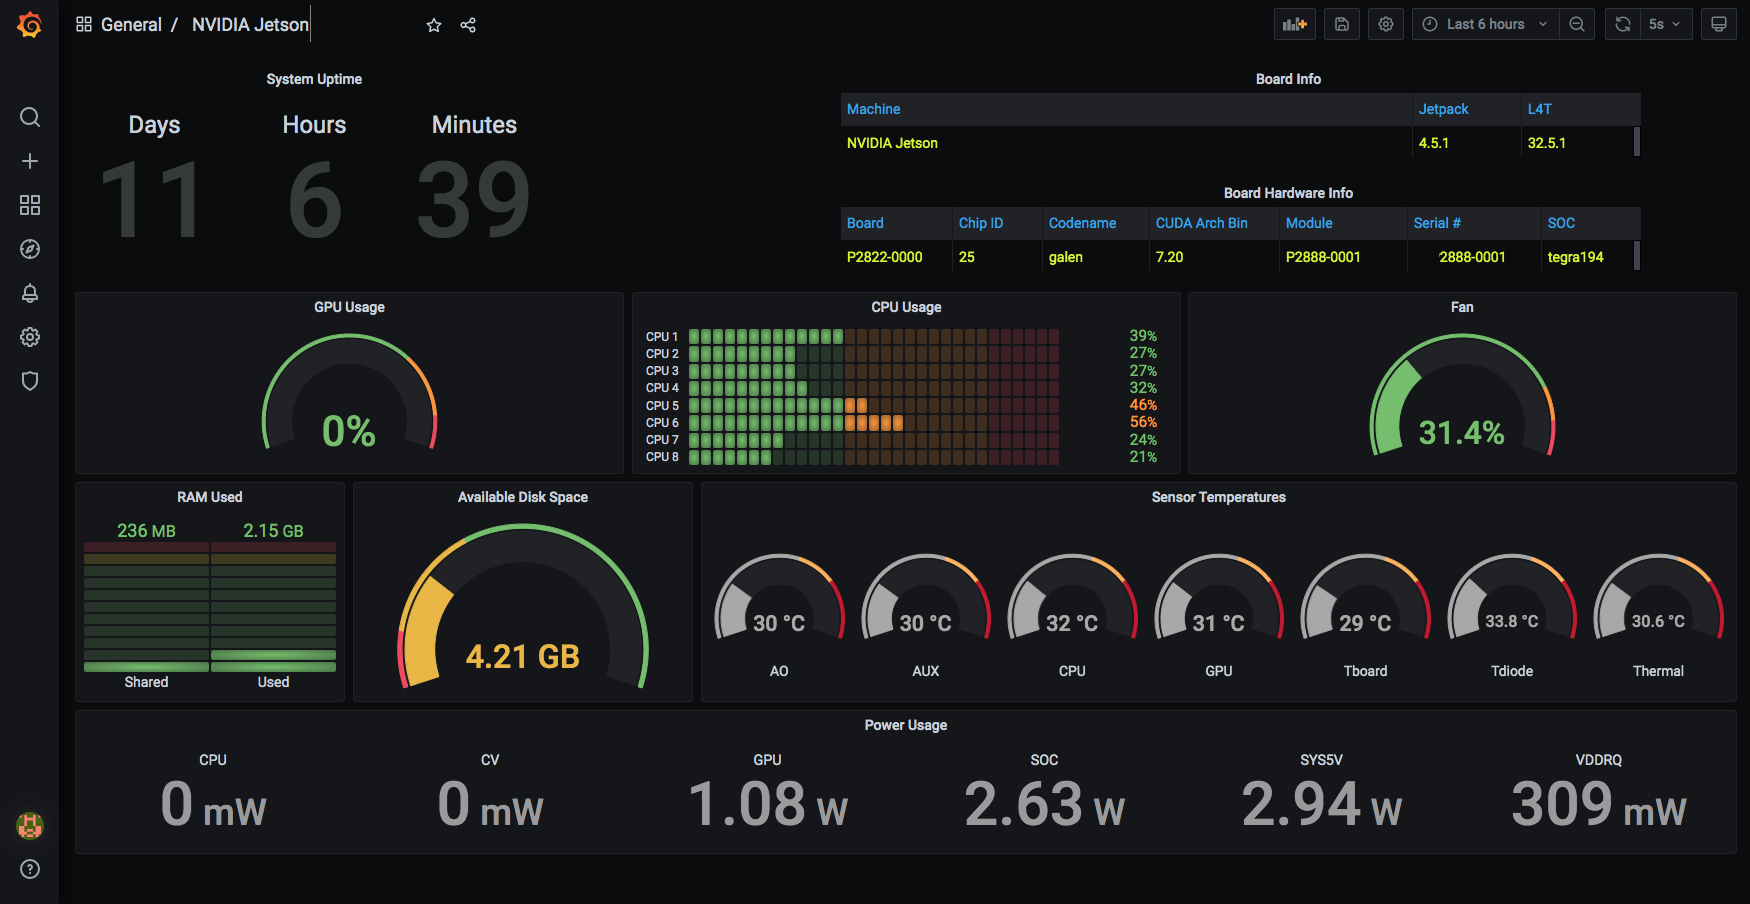
This project is a Grafana dashboard, driven by a Prometheus metrics collector, for monitoring NVIDIA Jetson devices [Xavier NX, Nano, AGX Xavier, TX1, TX2] operating autonomously in a headless fashion (i.e. no connected display and associated user-input devices).
The following hardware and software should already be configured and operational:
- NVIDIA Jetson device
- A host running Grafana
- A host running Prometheus
-
Ensure
jetson_statsis installed on your Jetson device. Full instructions can be found on the project GitHub repo -
Next, install the Prometheus metrics collector
nvidia@agx-desktop $ pip install prometheus-client
nvidia@agx-desktop $ sudo cp jetson_stats_prometheus_collector.py /usr/local/bin/
-
Install the Prometheus metrics collector as a system background
systemdservicenvidia@agx-desktop $ sudo cp jetson_stats_prometheus_collector.service /etc/systemd/system/ nvidia@agx-desktop $ sudo systemctl daemon-reload nvidia@agx-desktop $ sudo systemctl start jetson_stats_prometheus_collector nvidia@agx-desktop $ sudo systemctl status jetson_stats_prometheus_collector
Alternatively, you can install the
systemdservice for the current user as shown below:nvidia@agx-desktop $ mkdir -p ~/.config/systemd/user nvidia@agx-desktop $ sudo cp jetson_stats_prometheus_collector.service /etc/systemd/system/ nvidia@agx-desktop $ systemctl --user daemon-reload nvidia@agx-desktop $ systemctl --user start jetson_stats_prometheus_collector nvidia@agx-desktop $ systemctl --user status jetson_stats_prometheus_collector
Note: The Prometheus metrics collector listens on port 8000 by default. If you wish to change this you will need to edit the jetson_stats_prometheus_collector.service file and change the --port argument to your required port number. You will also need to ensure to use the same port value later in this readme when referencing REPLACEME_YOUR_JETSON_PROMETHEUS_COLLECTOR_PORT.
-
Install required Grafana plugins and restart the Grafana service
$ grafana-cli plugins install marcusolsson-dynamictext-panel
$ sudo systemctl restart grafana-server.service
-
Open the Prometheus config:
$ sudo nano /etc/prometheus/prometheus.yml
-
Add metrics collection job config for the Jetson device
scrape_configs:
  - job_name: 'nvidia_jetson'
    static_configs:
    - targets: ['REPLACEME_YOUR_JETSON_HOST_IP:REPLACEME_YOUR_JETSON_PROMETHEUS_COLLECTOR_PORT']
Note: Replace the
REPLACEME_XXparts with the corresponding values. -
Restart the Prometheus service for the changes to take effect
$ sudo systemctl restart /etc/systemd/system/prometheus.service
-
From the Grafana Admin Dashboard select
+Create->Import -
Open the file
jetson_stats_grafana_dashboard.jsonand update the__inputsentry for theDS_MY_PROMETHEUSvalue and save the file -
Next, copy and paste the contents of modified
jetson_stats_grafana_dashboard.jsoninto the text box namedImport via panel jsonor select the file using theUpload JSON filebutton -
The
jetson-stats-grafana-dashboardshould now be available
