This repository was used for a comparative study between backpropagation trained feed forward networks and the same using genetic algorithms and particle swarm optimization in lieu of backpropagation.
I was interested in using PSO to train a neural network and decided to compare it, along with GA, to BP. Results are interesting: PSO-NN works very well for smaller data but BP-NN is the clear winner in higher dimensional data. GA-NN was found to be impractical or inefficient for training irrespective of problem size likely due to genetic algorithms being unoptimized for continuous data.
I wrote a paper describing my experimental methodology and results in more detail. I also wrote three tutorials for implementing a BP-NN, a GA-NN, and a PSO-NN. The code found in this repository is more or less taken straight from these tutorials as I made the tutorials to prepare for my experimentation.
- GNU/Linux
- Python 3.6
pandas
pandas is used to load and normalize input data and is necessary to reproduce the results found here. It can, however, be rewritten using Python standard libraries if you so desire.
- X11 or similar
gnuplotmatplotlib
On execution, the mean squared error of the network as well as training/testing accuracy is outputted to console. Optionally, matplotlib is used to generate a plot showing these results visually. If matplotlib is not met, no plot will be made. gnuplot is necessary for the automated results collection script (but not normal execution). Both require X11 or similar windowing system.
You can clone this repository to your computer like so:
$ git clone https://www.github.com/stratzilla/metaheuristic-training-networksYou can run any of the training scripts in /code like so:
 $ ./backprop_network.py <arg>
 $ ./genetic_network.py <arg>
 $ ./particle_network.py <arg>
This will train a single network and output a matplot plot showing the mean squared error over epochs as well as training and testing accuracy per epoch.
If you want to automate training multiple networks to find the mean between training runs, you can instead execute the below from /helpers:
$ ./results_collection.sh <arg>This will train fifty networks of each type, concatenate the results into a master CSV file, then use gnuplot to make a master plot comparing each training technique. You can edit this file manually to change how many runs per network and how many concurrent runs (default is 50 and 10 respectively, chosen for my system configuration, yours may differ).
These scripts use these for <arg>:
irisfor Iris data setwheatfor Wheat Seeds data setwinefor Wine data setbreastfor Breast Cancer data setallas argument forresults_collection.shwill perform all four experiments
These data sets are defined in /data.
The algorithms are data agnostic and will take any data, you just need to preprocess data to be accepted: final columnar value for data is the classification while the others are attributes. Classes must be enumerated starting at 0, and attributes should be numerical (continuous or integer).
BP, GA, PSO parameters can be found in /code/network_params.py: it's separated so you can edit and test parameters without editing each network's code. The parameters as seen there work generally well but of course you can probably find better parameters through experimentation.
I tested four data sets as found in /data: Iris, Wheat Seeds, Wine, and Breast Cancer. Here is some information about each data set:
| Data Set | Instances | Attributes | Classes |
|---|---|---|---|
| Iris | 151 | 4 | 3 |
| Wheat Seeds | 211 | 7 | 3 |
| Wine | 178 | 13 | 3 |
| Breast Cancer | 570 | 31 | 2 |
Each network structure was different for each data set. Since dimensionality of the problem is based on the network topology, it was also found (NB: HL and OL have one bias neuron):
| Data Set | IL Size | HL Size | OL Size | Dimensionality |
|---|---|---|---|---|
| Iris | 4 | 3 | 3 | 27 |
| Wheat Seeds | 7 | 5 | 3 | 58 |
| Wine | 13 | 6 | 3 | 105 |
| Breast Cancer | 31 | 8 | 2 | 274 |
Dimensionality is simply (HL * (IL + 1)) + (OL * (HL + 1)). These data sets were chosen to visualize results on iteratively increasing dimensionality and to see if one network training method was better for a specific problem size.
You can see CSV results in /results or for a visualization of mean squared error over epochs for each network, you can see these in /results/plots. Below is a summary of results:
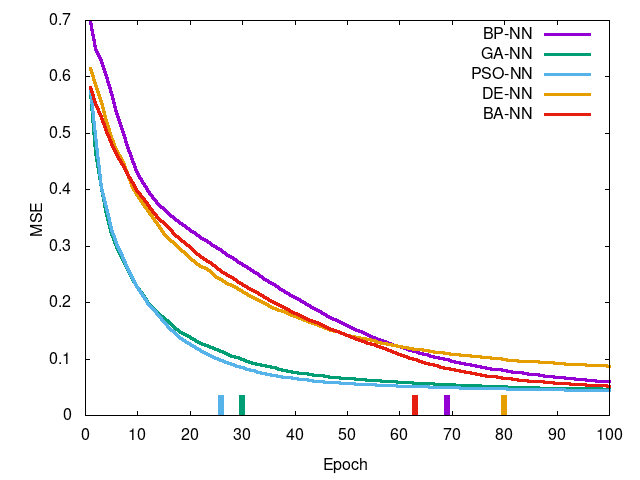
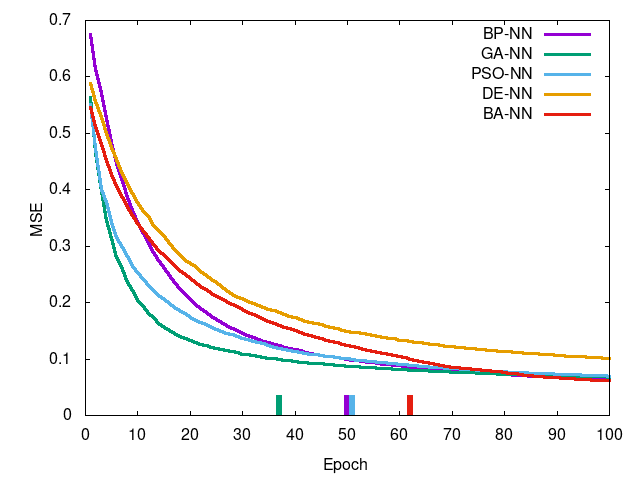
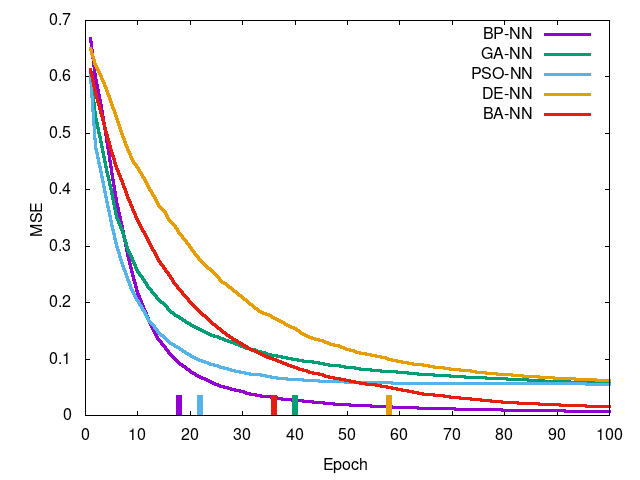
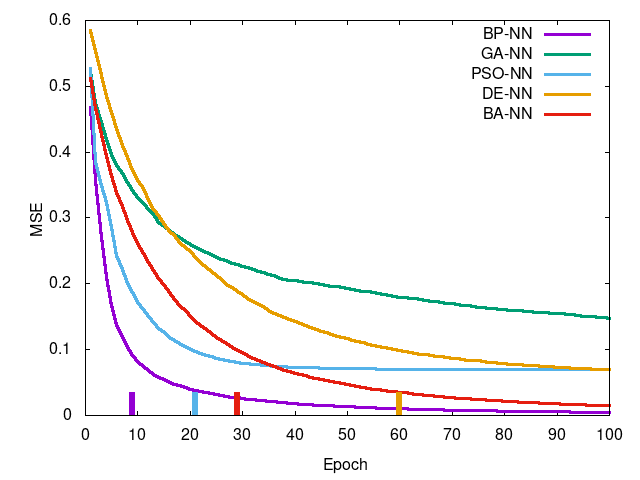
Left-to-right, top-to-bottom: Iris data set, Wheat Seeds data set, Wine data set, Breast Cancer data set. Curve is mean squared error per epoch and the tick at the bottom is the epoch in which training reached a termination condition (MSE <= 0.1).
You can see PSO-NN and GA-NN outperform BP-NN for Iris (of which an ANOVA test shows there is stochastic dominance), for Wheat Seeds there is no dominance between training methods, and the remaining two showing statistically significant difference in favor of BP-NN. This suggests PSO-NN is suitable for smaller problem sized whereas BP-NN is generally preferred for higher dimensional problems. GA-NN results suggest some promise but in practice it was found impractical for network training.
The number of training instances should also be considered: if every data set is limited to 100 random instances, the results are different. Backpropagation favors large amounts of training instances whereas I found metaheuristics do not (and in fact, slightly suffer from it, particularly with regards to speed). I find PSO in particular to perform very well with smaller amounts of training instances, so much so that it outperforms backpropagation in nearly every metric. It is worth a further look if interested.