A R Interface to ECharts 3.0
This package is under development, more features will be added.
这个包目前在开发中。
devtools::install_github('ChanningWong/REcharts3')
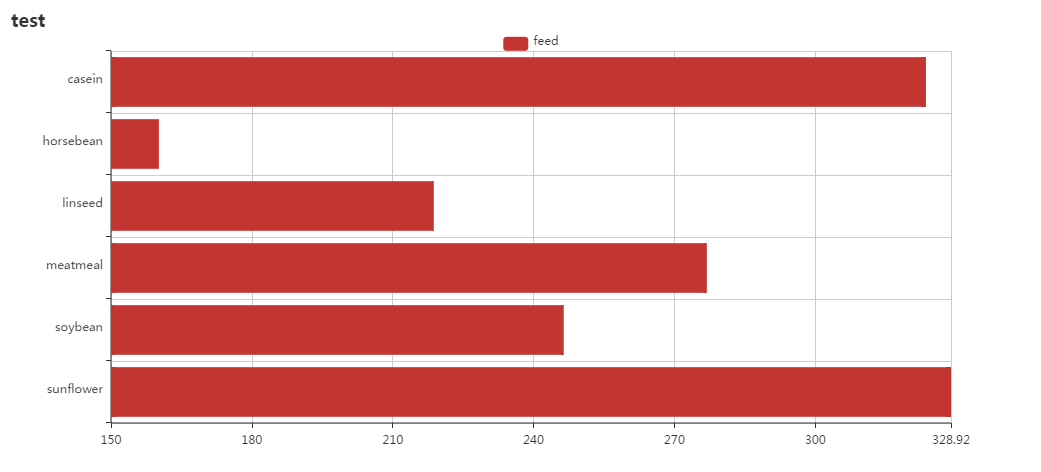
library(REcharts3)dat1 = aggregate(weight ~ feed, data = chickwts, mean)
bar(dat1, feed, weight, label = round(weight, 0), title = 'test')
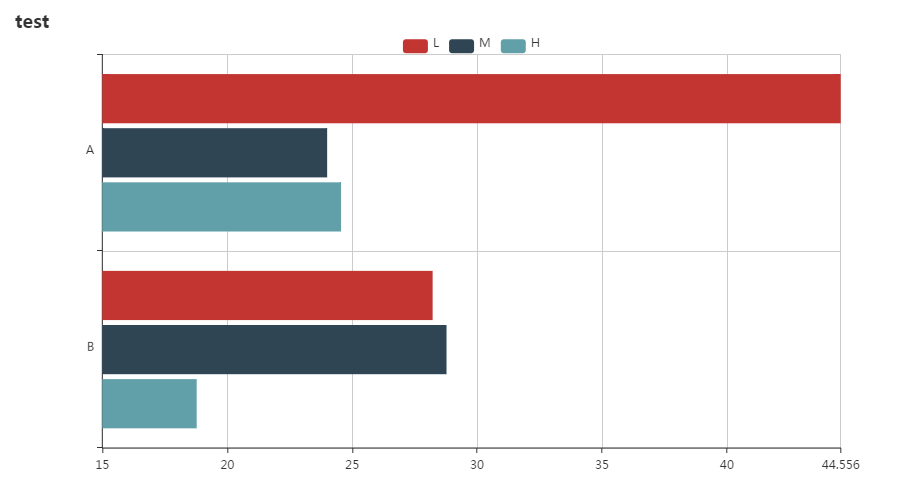
dat2 = aggregate(breaks ~ wool + tension, data = warpbreaks, mean)
bar(dat2, wool, breaks, tension, label = round(breaks*10, 0), title = 'test')
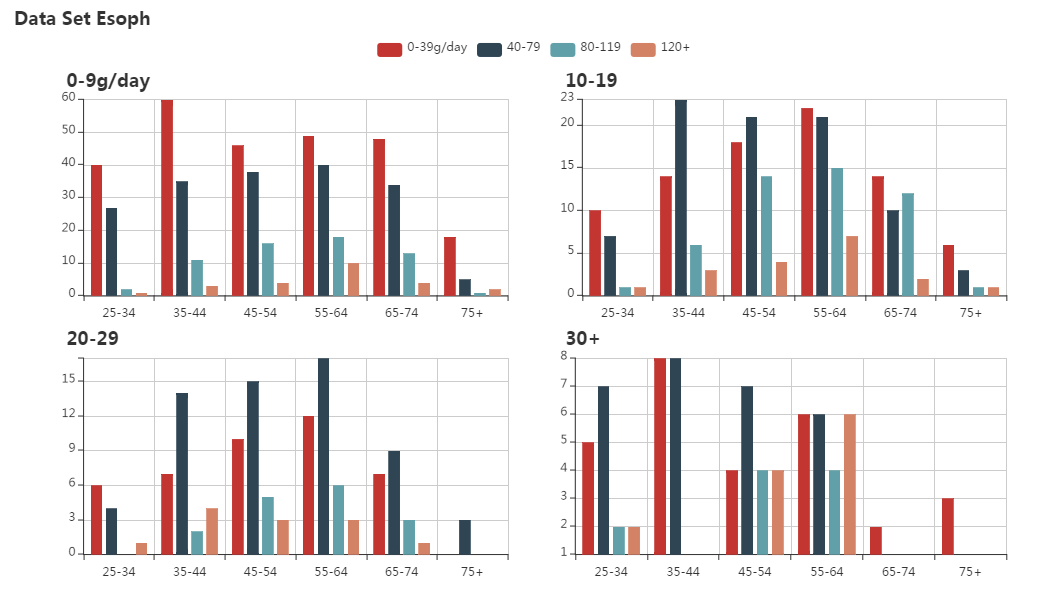
his(esoph, agegp, ncontrols, alcgp, facets = tobgp, title = 'Data Set Esoph')
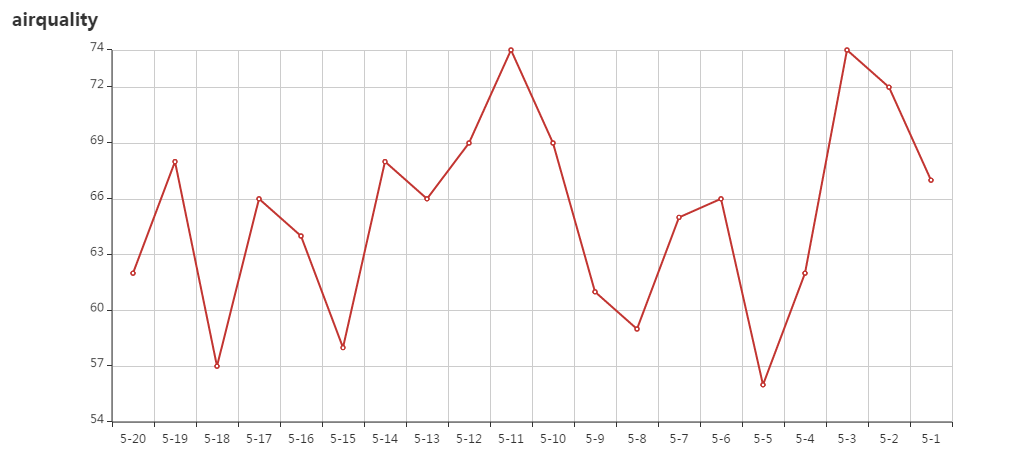
line(airquality[1:20, ], paste0(Month, '-', Day), Temp, title = 'airquality')dat1 = aggregate(weight ~ feed, data = chickwts, mean)
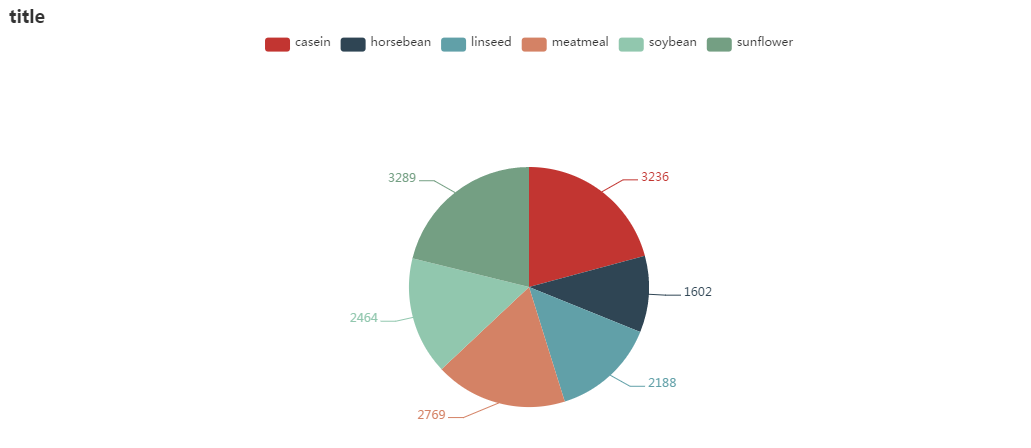
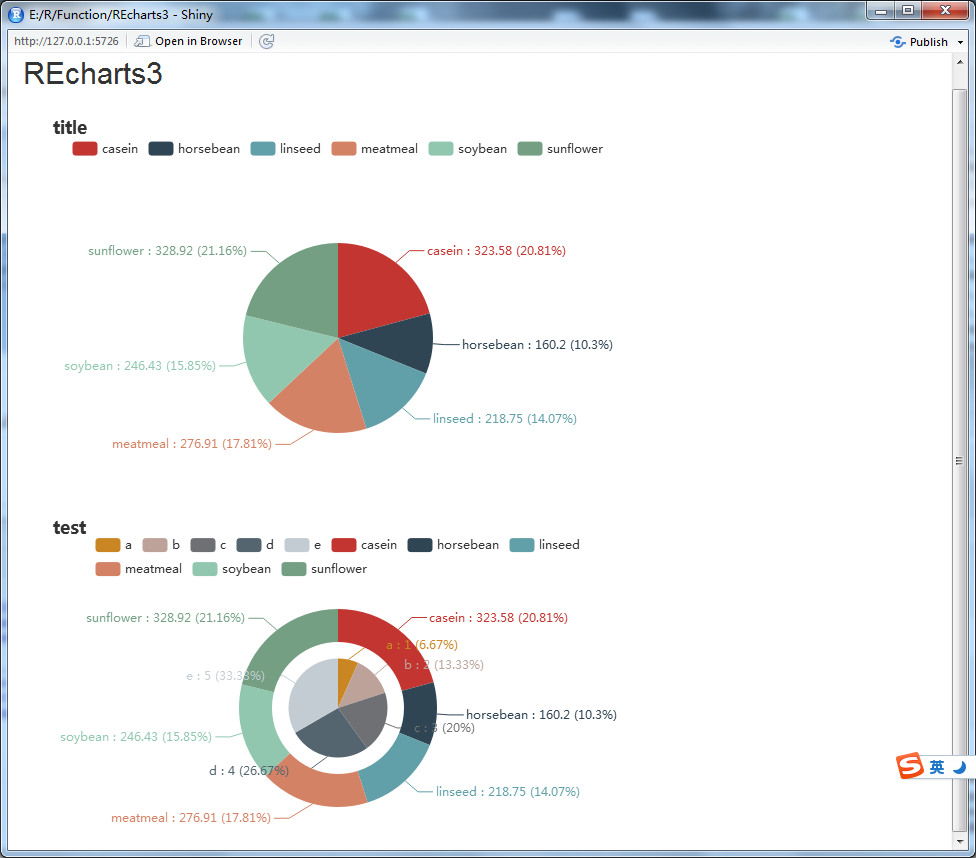
pie(dat1, feed, weight, label = round(weight*10, 0), title = 'Pie Plot')
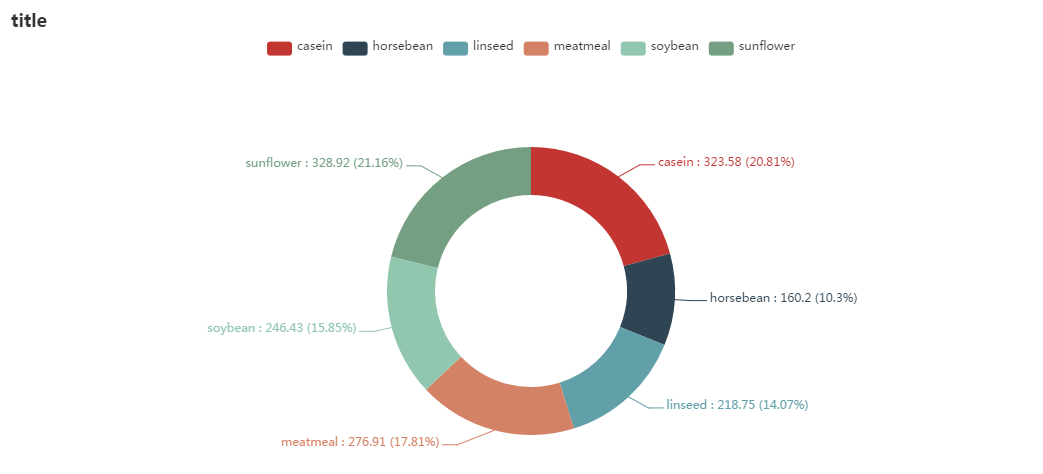
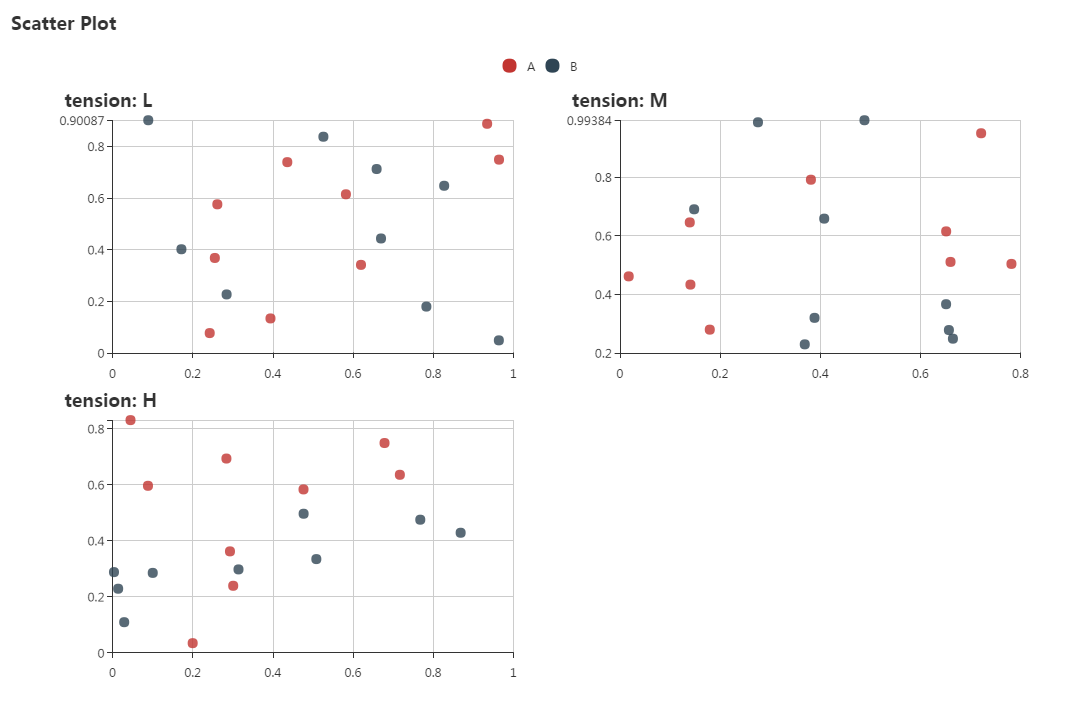
donut(dat1, feed, weight, title = 'Pie Plot')warpbreaks$x1 = runif(nrow(warpbreaks))
warpbreaks$y1 = runif(nrow(warpbreaks))
scatter(warpbreaks, x1, y1, wool, paste0('tension: ', tension), title = 'Scatter Plot')library(tidyr)
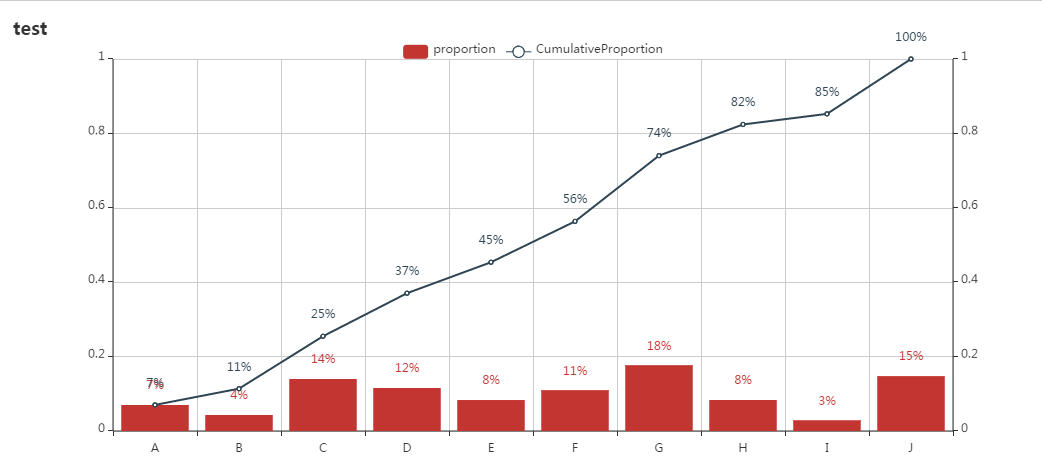
y = runif(10, min = 1, max = 10)
dat = data.frame(x = LETTERS[1:10])
dat$proportion = y / sum(y)
dat$CumulativeProportion = cumsum(dat$proportion)
dat2 = gather(dat, key, value, -x)
p = his(dat2, x, value, key, label = percent(value, 0),
title = 'test', label.show = T, label.position = 'top', yAxis.max = 1)
p2 = p %>% addSecAxis(series = 'CumulativeProportion', type = 'line', yAxis.max = 1)
p2dat1 = data.frame(
n = 1:10,
type = rep(c('day1', 'day2'), each = 5),
rbind(c(120.210813,27.321733), c(120.220813,27.321733), c(120.230813,27.351733),
c(120.220813,27.351733), c(120.230813,27.311733), c(120.215,27.322),
c(120.220,27.323), c(120.230,27.350), c(120.220,27.352), c(120.230,27.312)))
names(dat1) = c('n', 'type', 'lng', 'lat')
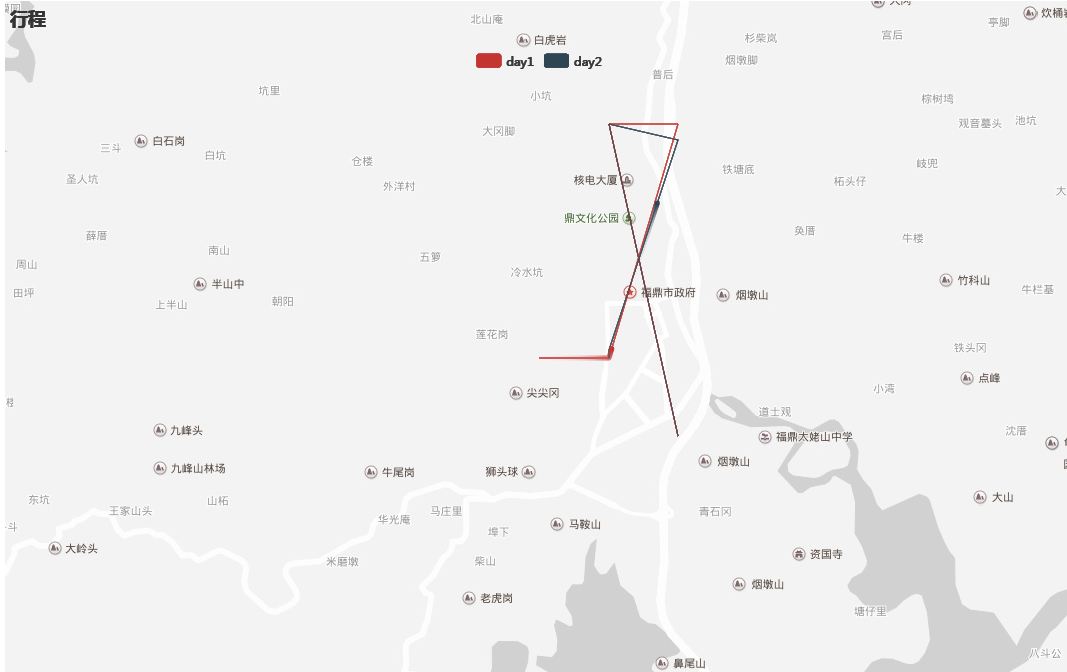
mapLines(dat1, 'lng', 'lat', 'type', title = '行程',
center = c(dat1$lng[1], dat1$lat[1]), color = c('red', 'blue'),
effect = list(show = T, constantSpeed = 100, symbol = 'circle', trailLength = 0.2, symbolSize = 5))library(REcharts3)
library(shiny)
shinyApp(
ui = fluidPage(
numericInput("n", "n", 1),
RECharts3Output('plot'),
RECharts3Output('plot2')
),
server = function(input, output) {
output$plot <- renderREcharts3( {
dat_test = aggregate(breaks ~ wool + tension, data = warpbreaks, mean)
p0 = bar(dat_test, wool, breaks, tension, label = round(breaks*10, 0), stack = T,
title = 'test1', height = 300)
p0
})
output$plot2 <- renderREcharts3( {
dat_test2 = aggregate(weight ~ feed, data = chickwts, mean)
p02 = pie(dat_test2, feed, weight, title = 'test2', height = 400)
p02
})
}
)
library(REcharts3, warn.conflicts = F, verbose = F, quietly = T)

incluedRECharts3()

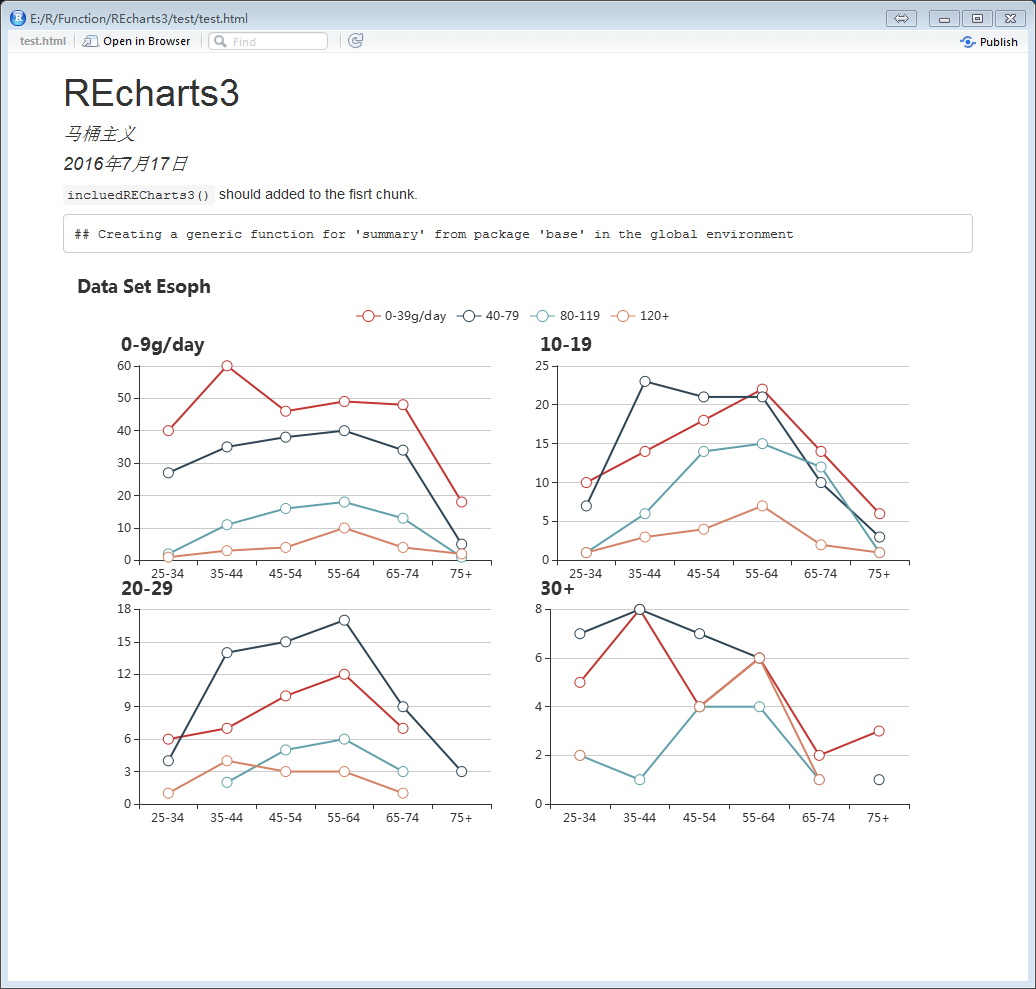
p = line(esoph, agegp, ncontrols, alcgp, facets = tobgp, title = 'Data Set Esoph')
RECharts3Knit(p, width = 900, height = 600)
