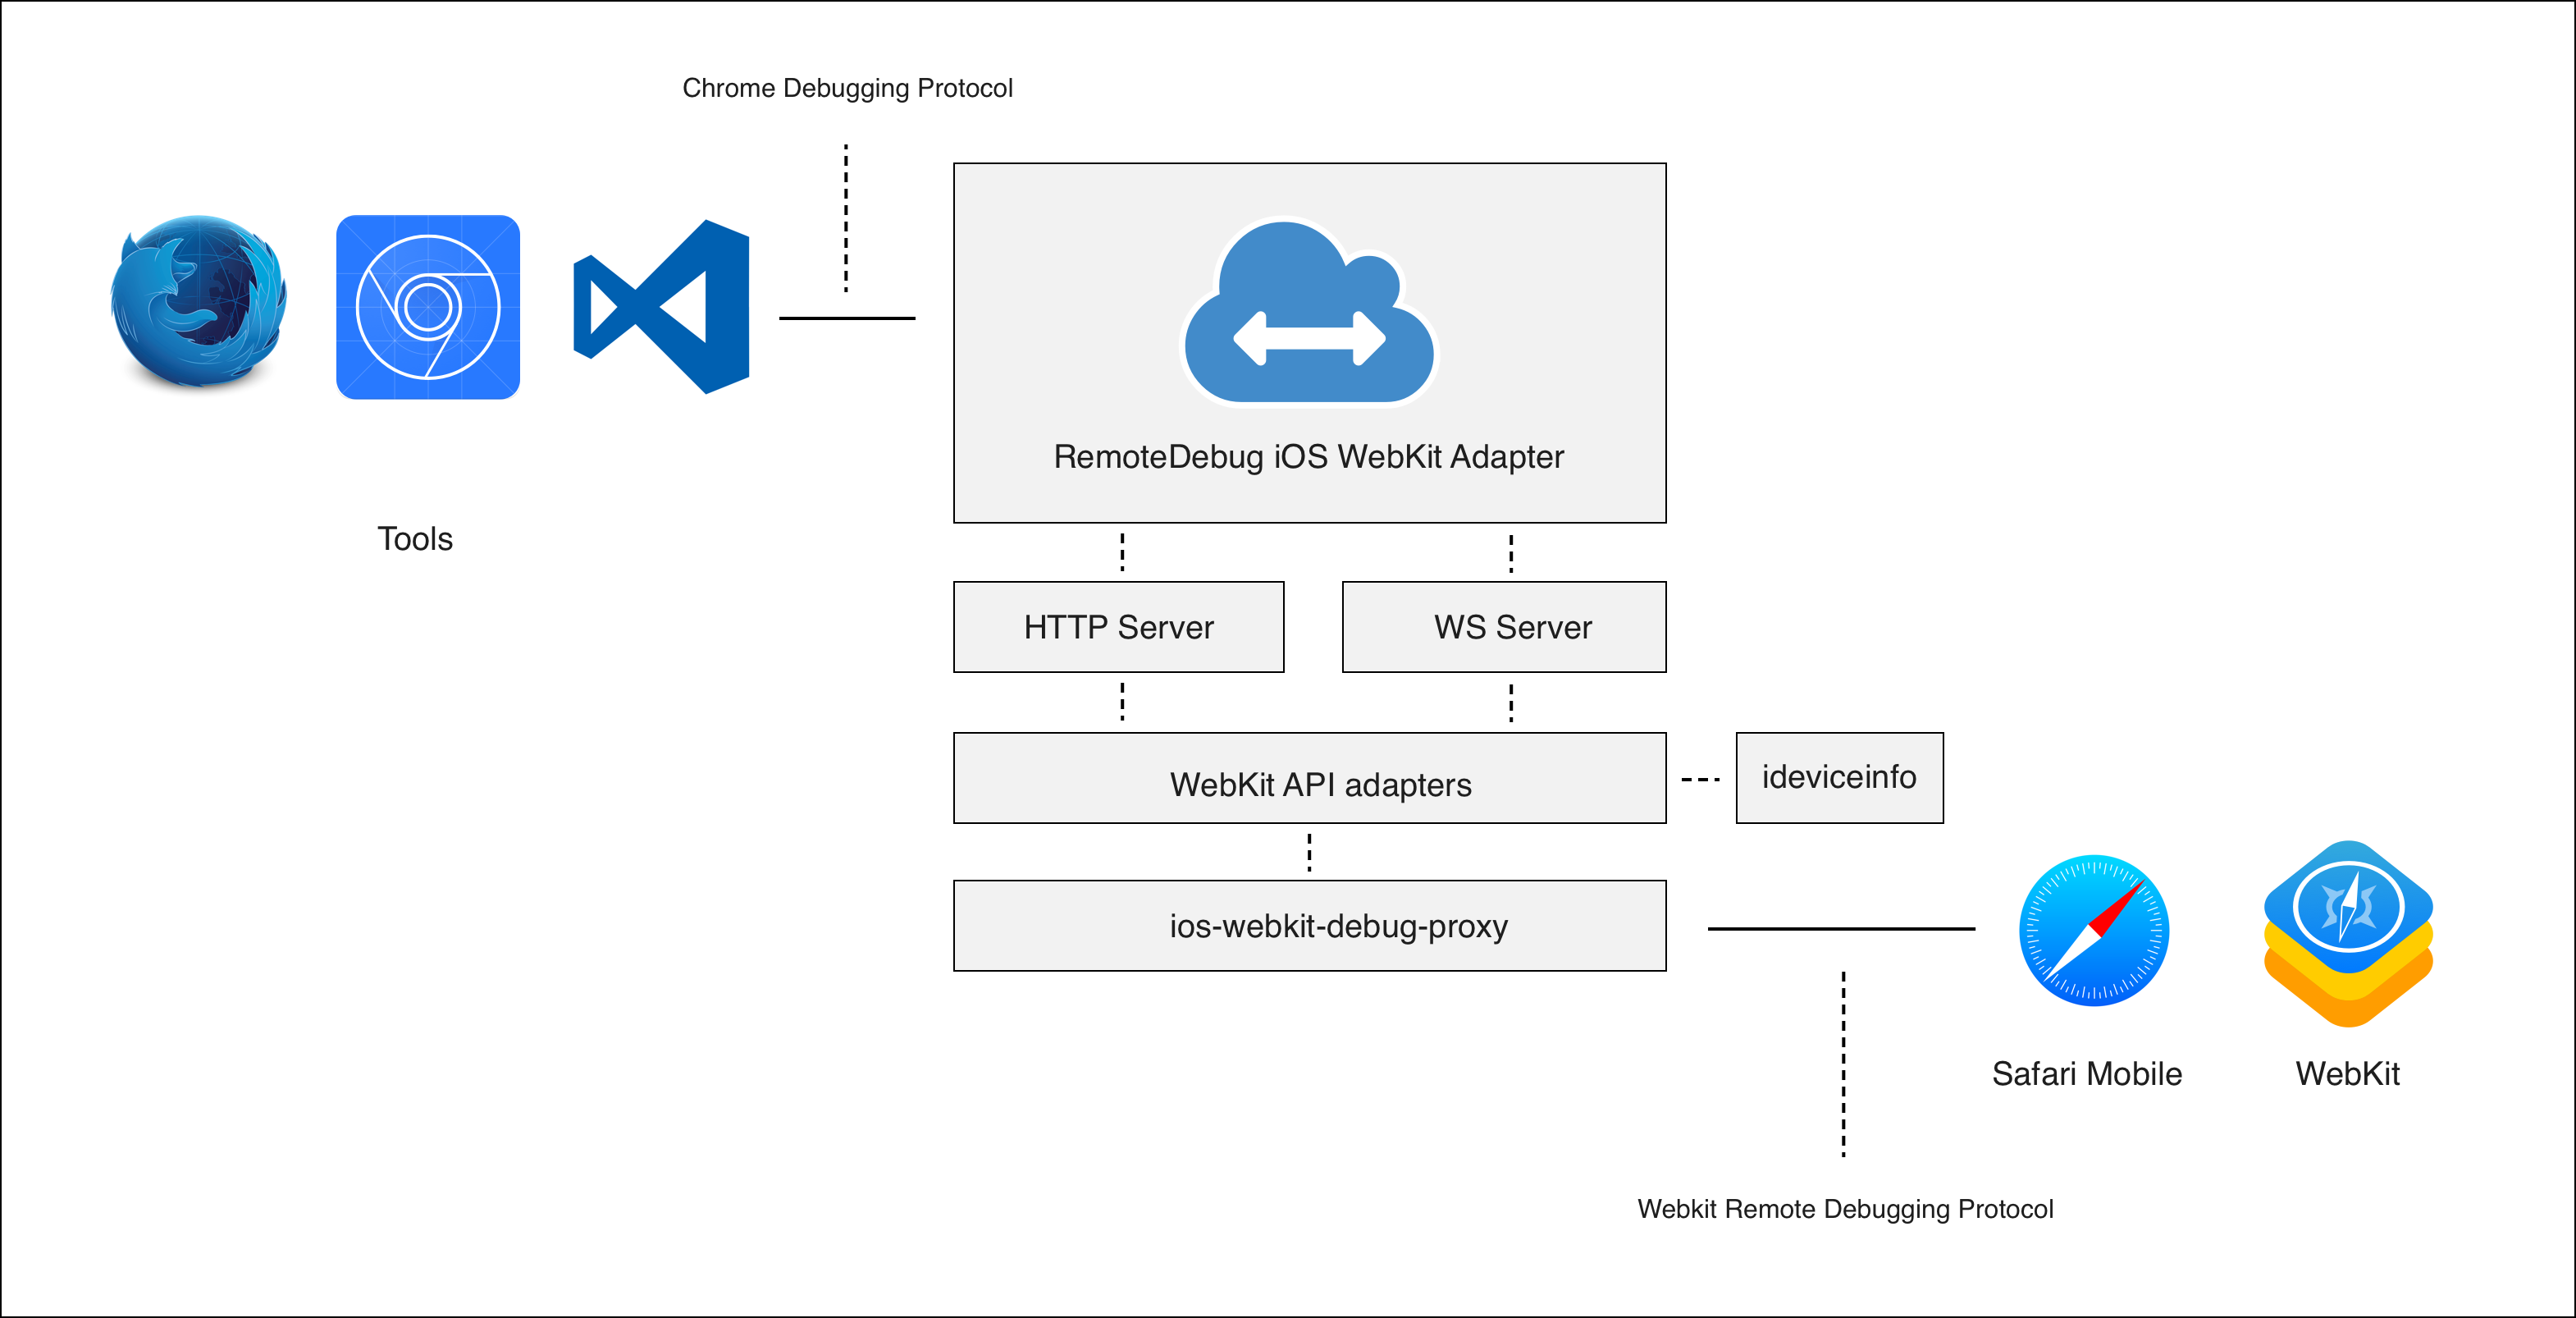
RemoteDebug iOS WebKit Adapter is an protocol adapter that Safari and WebViews on iOS to be debugged from tools like VS Code, Chrome DevTools, Mozilla Debugger.html and other tools compatible with the Chrome Debugging Protocol.
Read more in the introduction blog post on Medium: Hello RemoteDebug iOS WebKit Adapter: iOS web debugging with Chrome DevTools, VS Code & Mozilla Debugger.html 📡📱
Before you use this adapter you need to make sure you have the latest version of iTunes installed, as we need a few libraries provided by iTunes to talk to the iOS devices.
Follow the instructions to install ios-webkit-debug-proxy and libimobiledevice
Install ios-webkit-debug-proxy and libimobiledevice. On Windows you can use scoop:
scoop bucket add extras
scoop install ios-webkit-debug-proxy
npm install -g vs-libimobile
Make sure you have Homebrew installed, and run the following command to install ios-webkit-debug-proxy and libimobiledevice
brew update
brew unlink libimobiledevice ios-webkit-debug-proxy usbmuxd
brew uninstall --force libimobiledevice ios-webkit-debug-proxy usbmuxd
brew install --HEAD usbmuxd
brew install --HEAD libimobiledevice
brew install --HEAD ios-webkit-debug-proxy
npm install remotedebug-ios-webkit-adapter -g
In order for your iOS targets to show up, you need to enable remote debugging.
Open iOS Settings => Safari preferences => enable "Web Inspector"
On MacOS you can use Safari to inspect an iOS Safari tab. This will ensure the device is trusted.
On Windows starting iTunes could prompt the "Trust this computer" dialog.
remotedebug_ios_webkit_adapter --port=9000
BTW: ios-webkit-debug-proxy will be run automatically for you, no need to start it separately.
Open your favorite tool such as Chrome DevTools or Visual Studio Code and configure the tool to connect to the protocol adapter.
Usage: remotedebug_ios_webkit_adapter --port [num]

Options:
  -p, --port  the adapter listerning post  [default: 9000]
  --version   prints current version
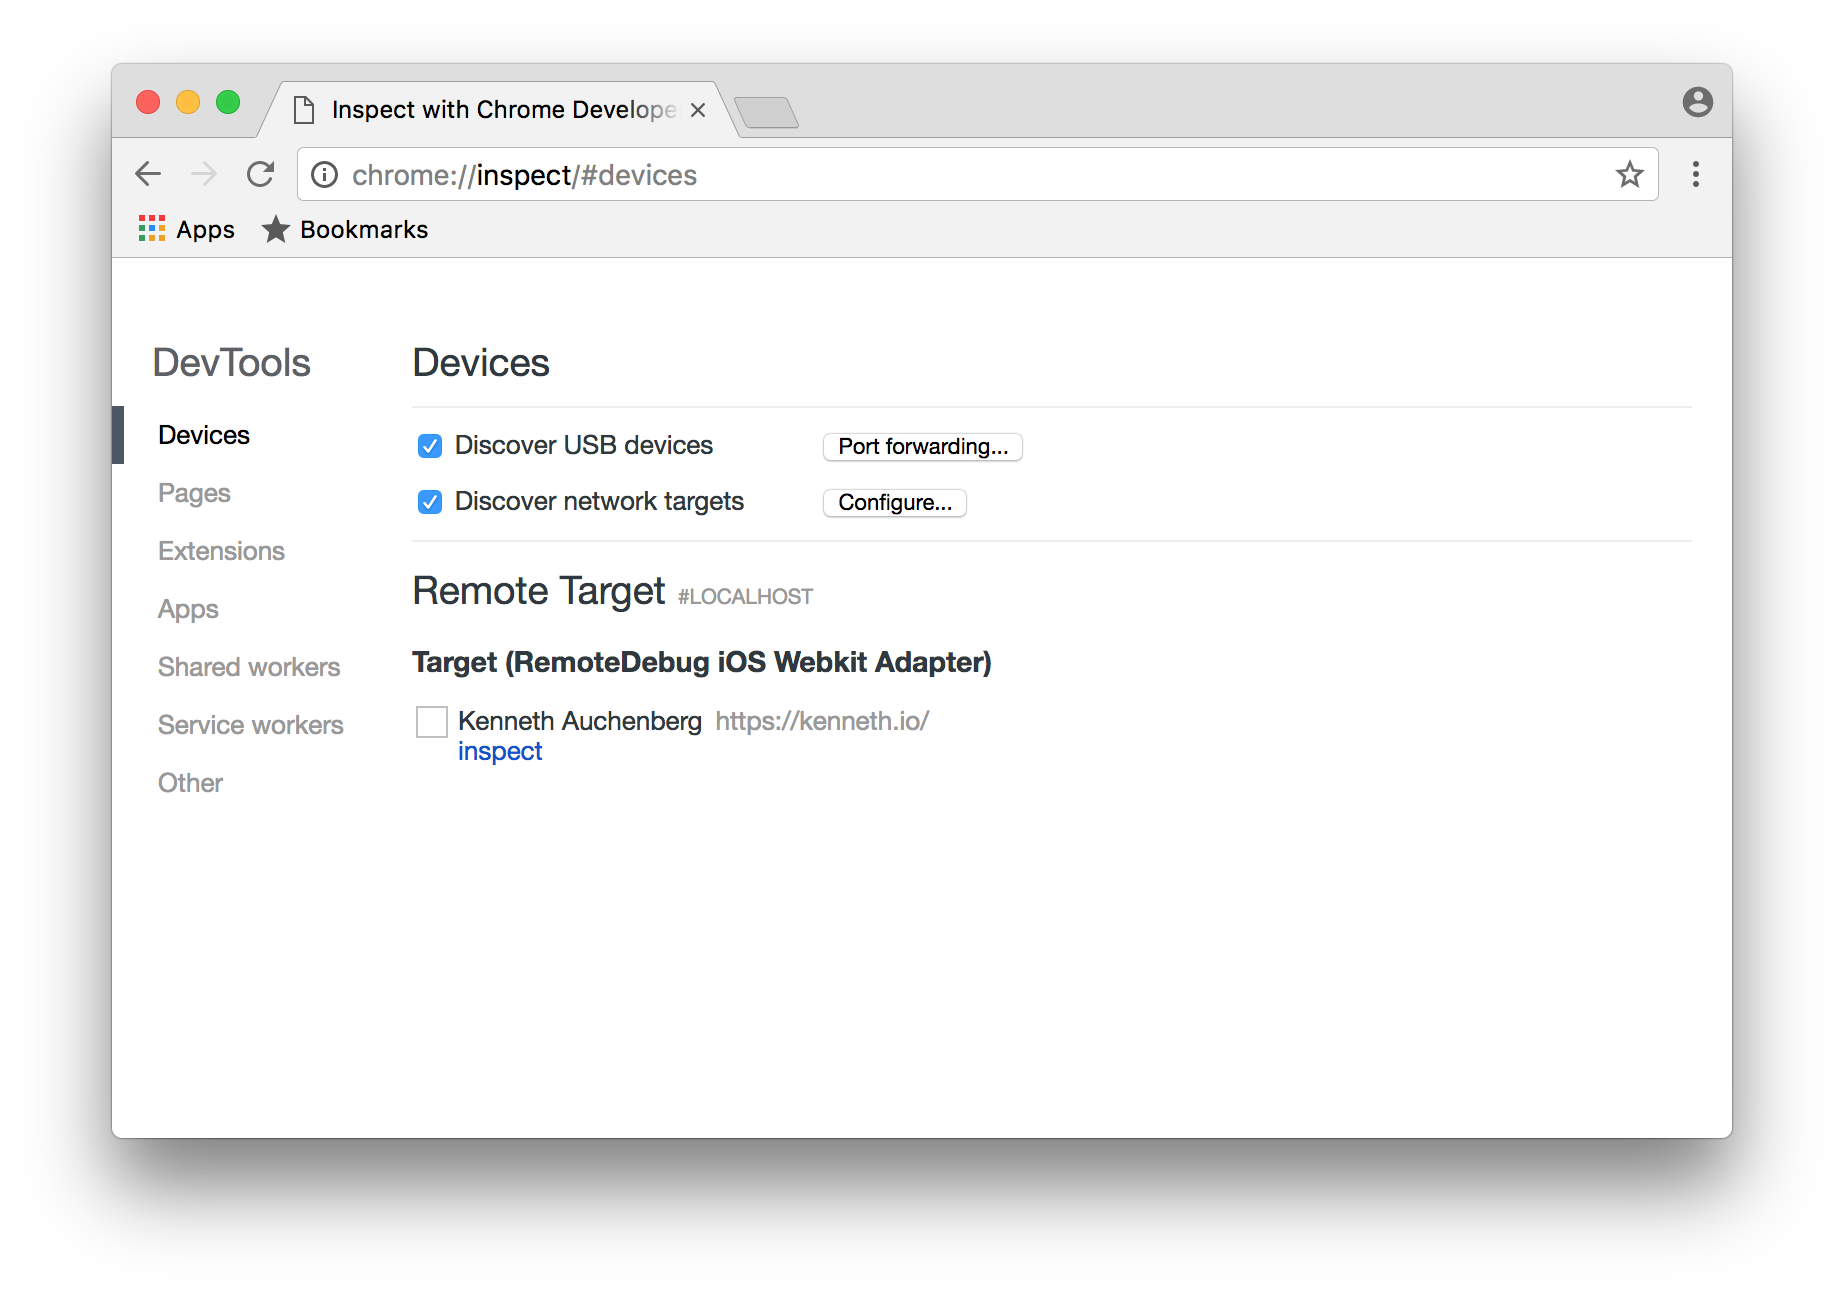
You can have your iOS targets show up in Chrome's chrome://inspect page by leveraging the new network discoverbility feature where you simple add the IP of computer running the adapter ala localhost:9000.
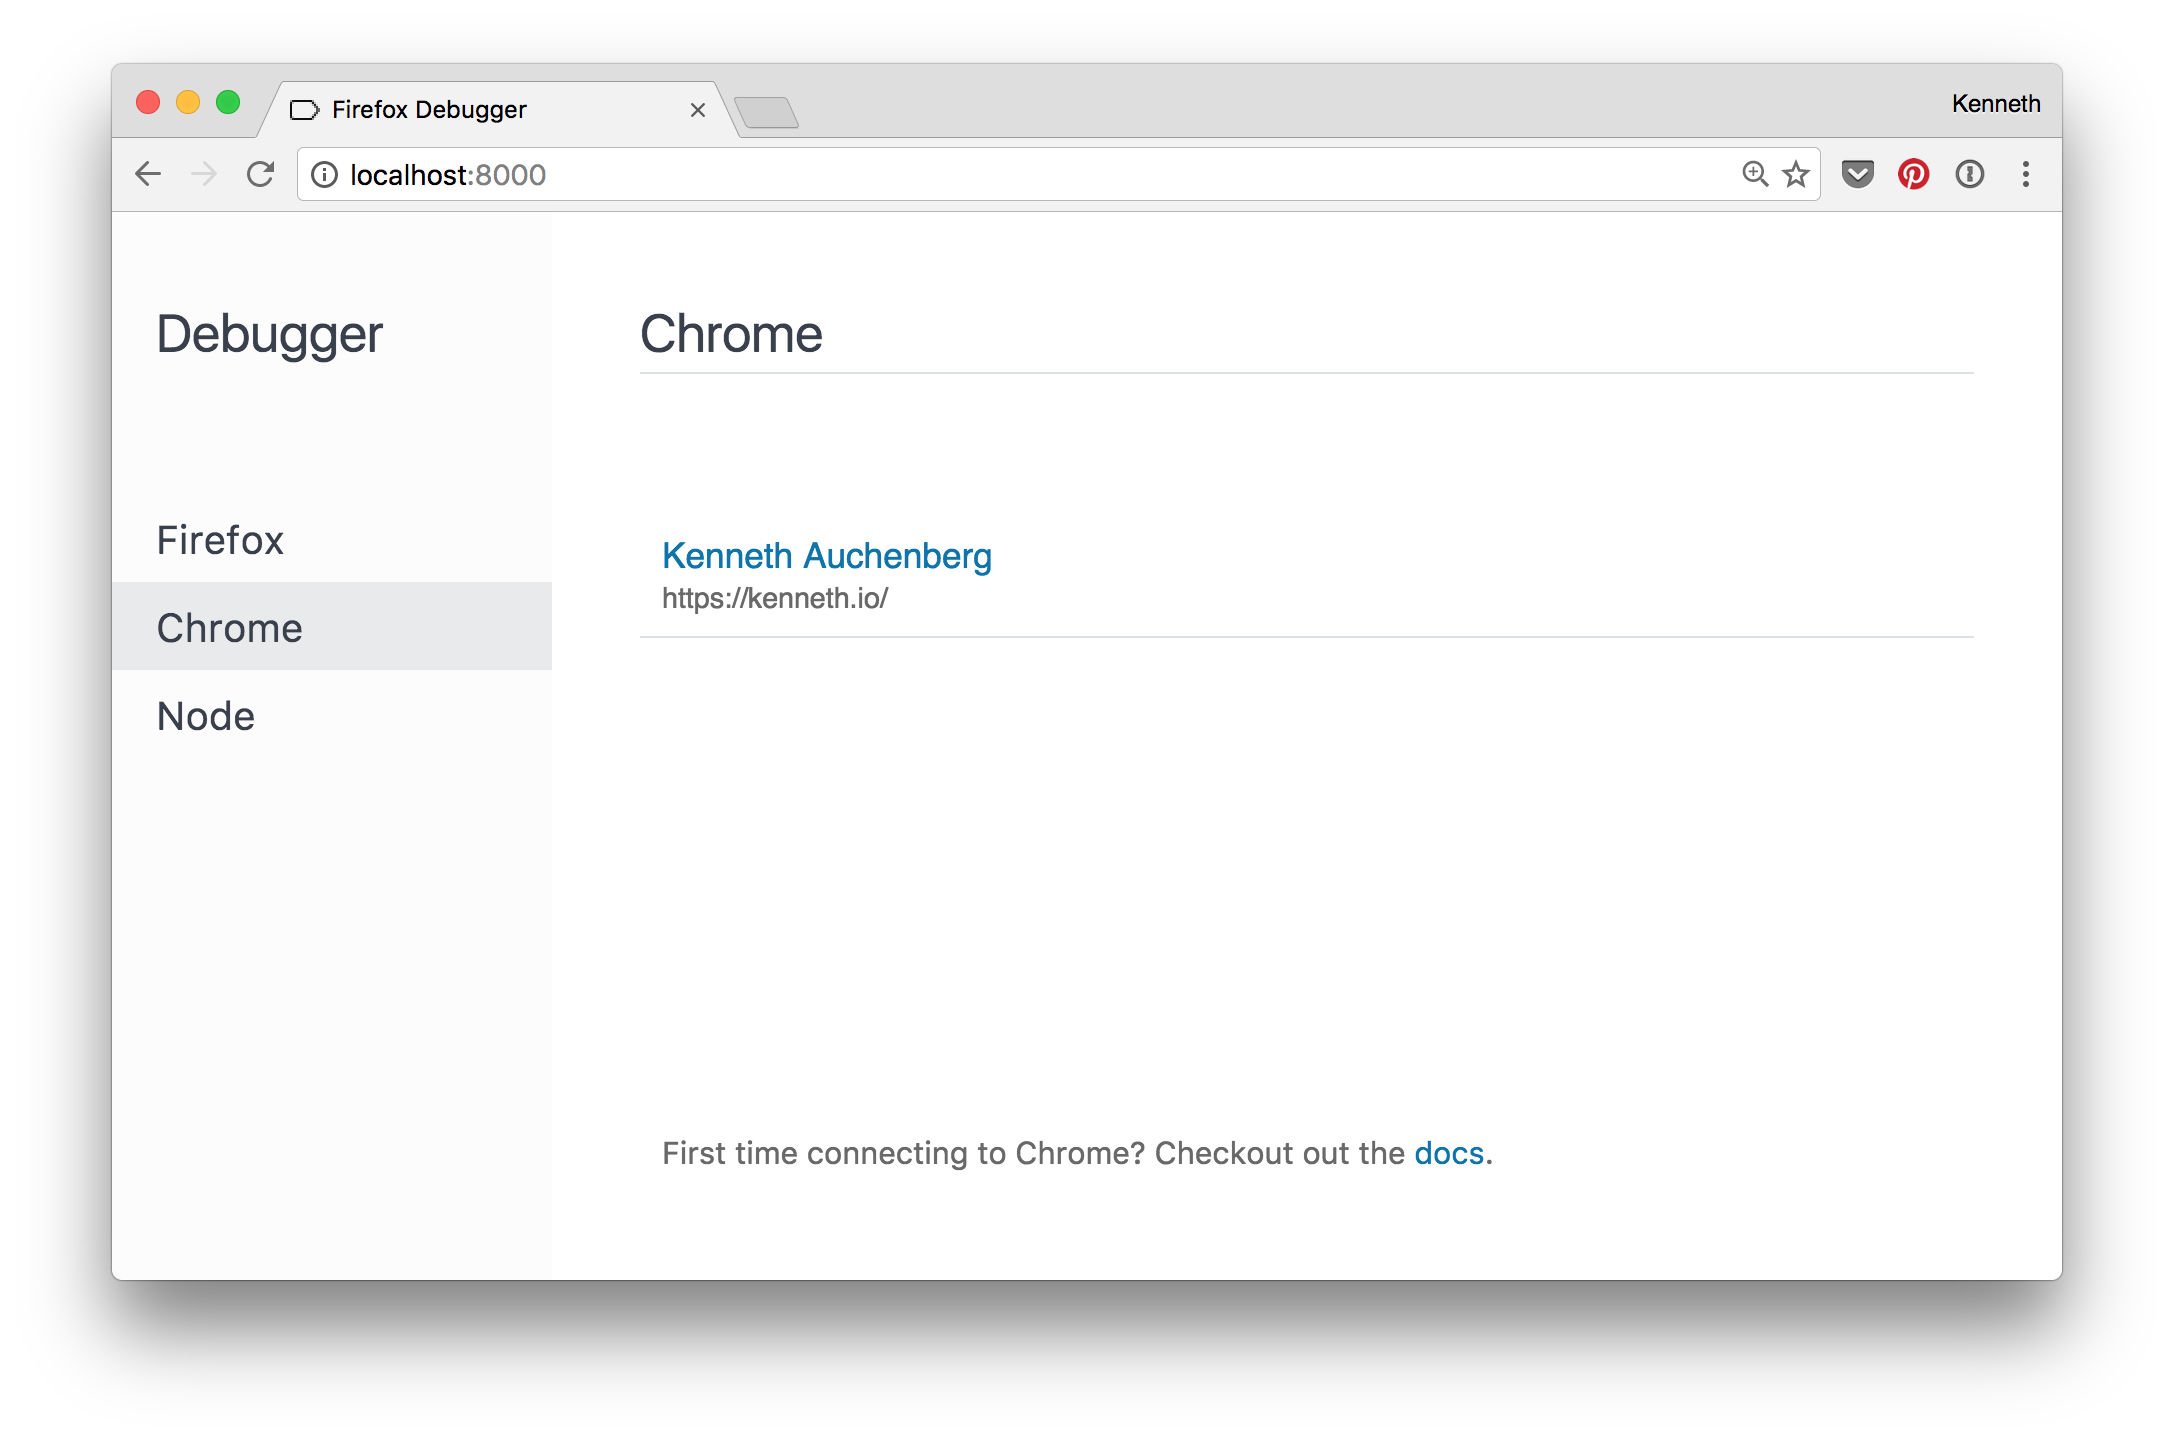
You can have your iOS targets show up in Mozila debugger.html, by starting remotedebug_ios_webkit_adapter --port=9222 and selecting the Chrome tab.
Install VS Code, and the VS Code Chrome Debugger, then create a launch.json configuration where port is set to 9000, like below:
{
    "version": "0.2.0",
    "configurations": [
        {
            "name": "iOS Web",
            "type": "chrome",
            "request": "attach",
            "port": 9000,
            "url": "http://localhost:8080/*",
            "webRoot": "${workspaceRoot}/src"
        }
    ]
}The protocol adapter is implemented in TypeScript as Node-based CLI tool which starts an instance of ios-webkit-debug-proxy, detects the connected iOS devices, and then starts up an instance of the correct protocol adapter depending on the iOS version.
npm install
npm start
DEBUG=remotedebug npm start
MIT


