We do expect you to be familiar with Git. Please create your own repository for this coding challenge.
You may use
git clone https://github.com/wuxiaohua1011/ATLAS_Coding_Challenge.git to get a copy of the skeleton code
We use Conda as our environment management tool
conda create -n env_name python=3.7conda activate env_namepip install -r requirements.txt
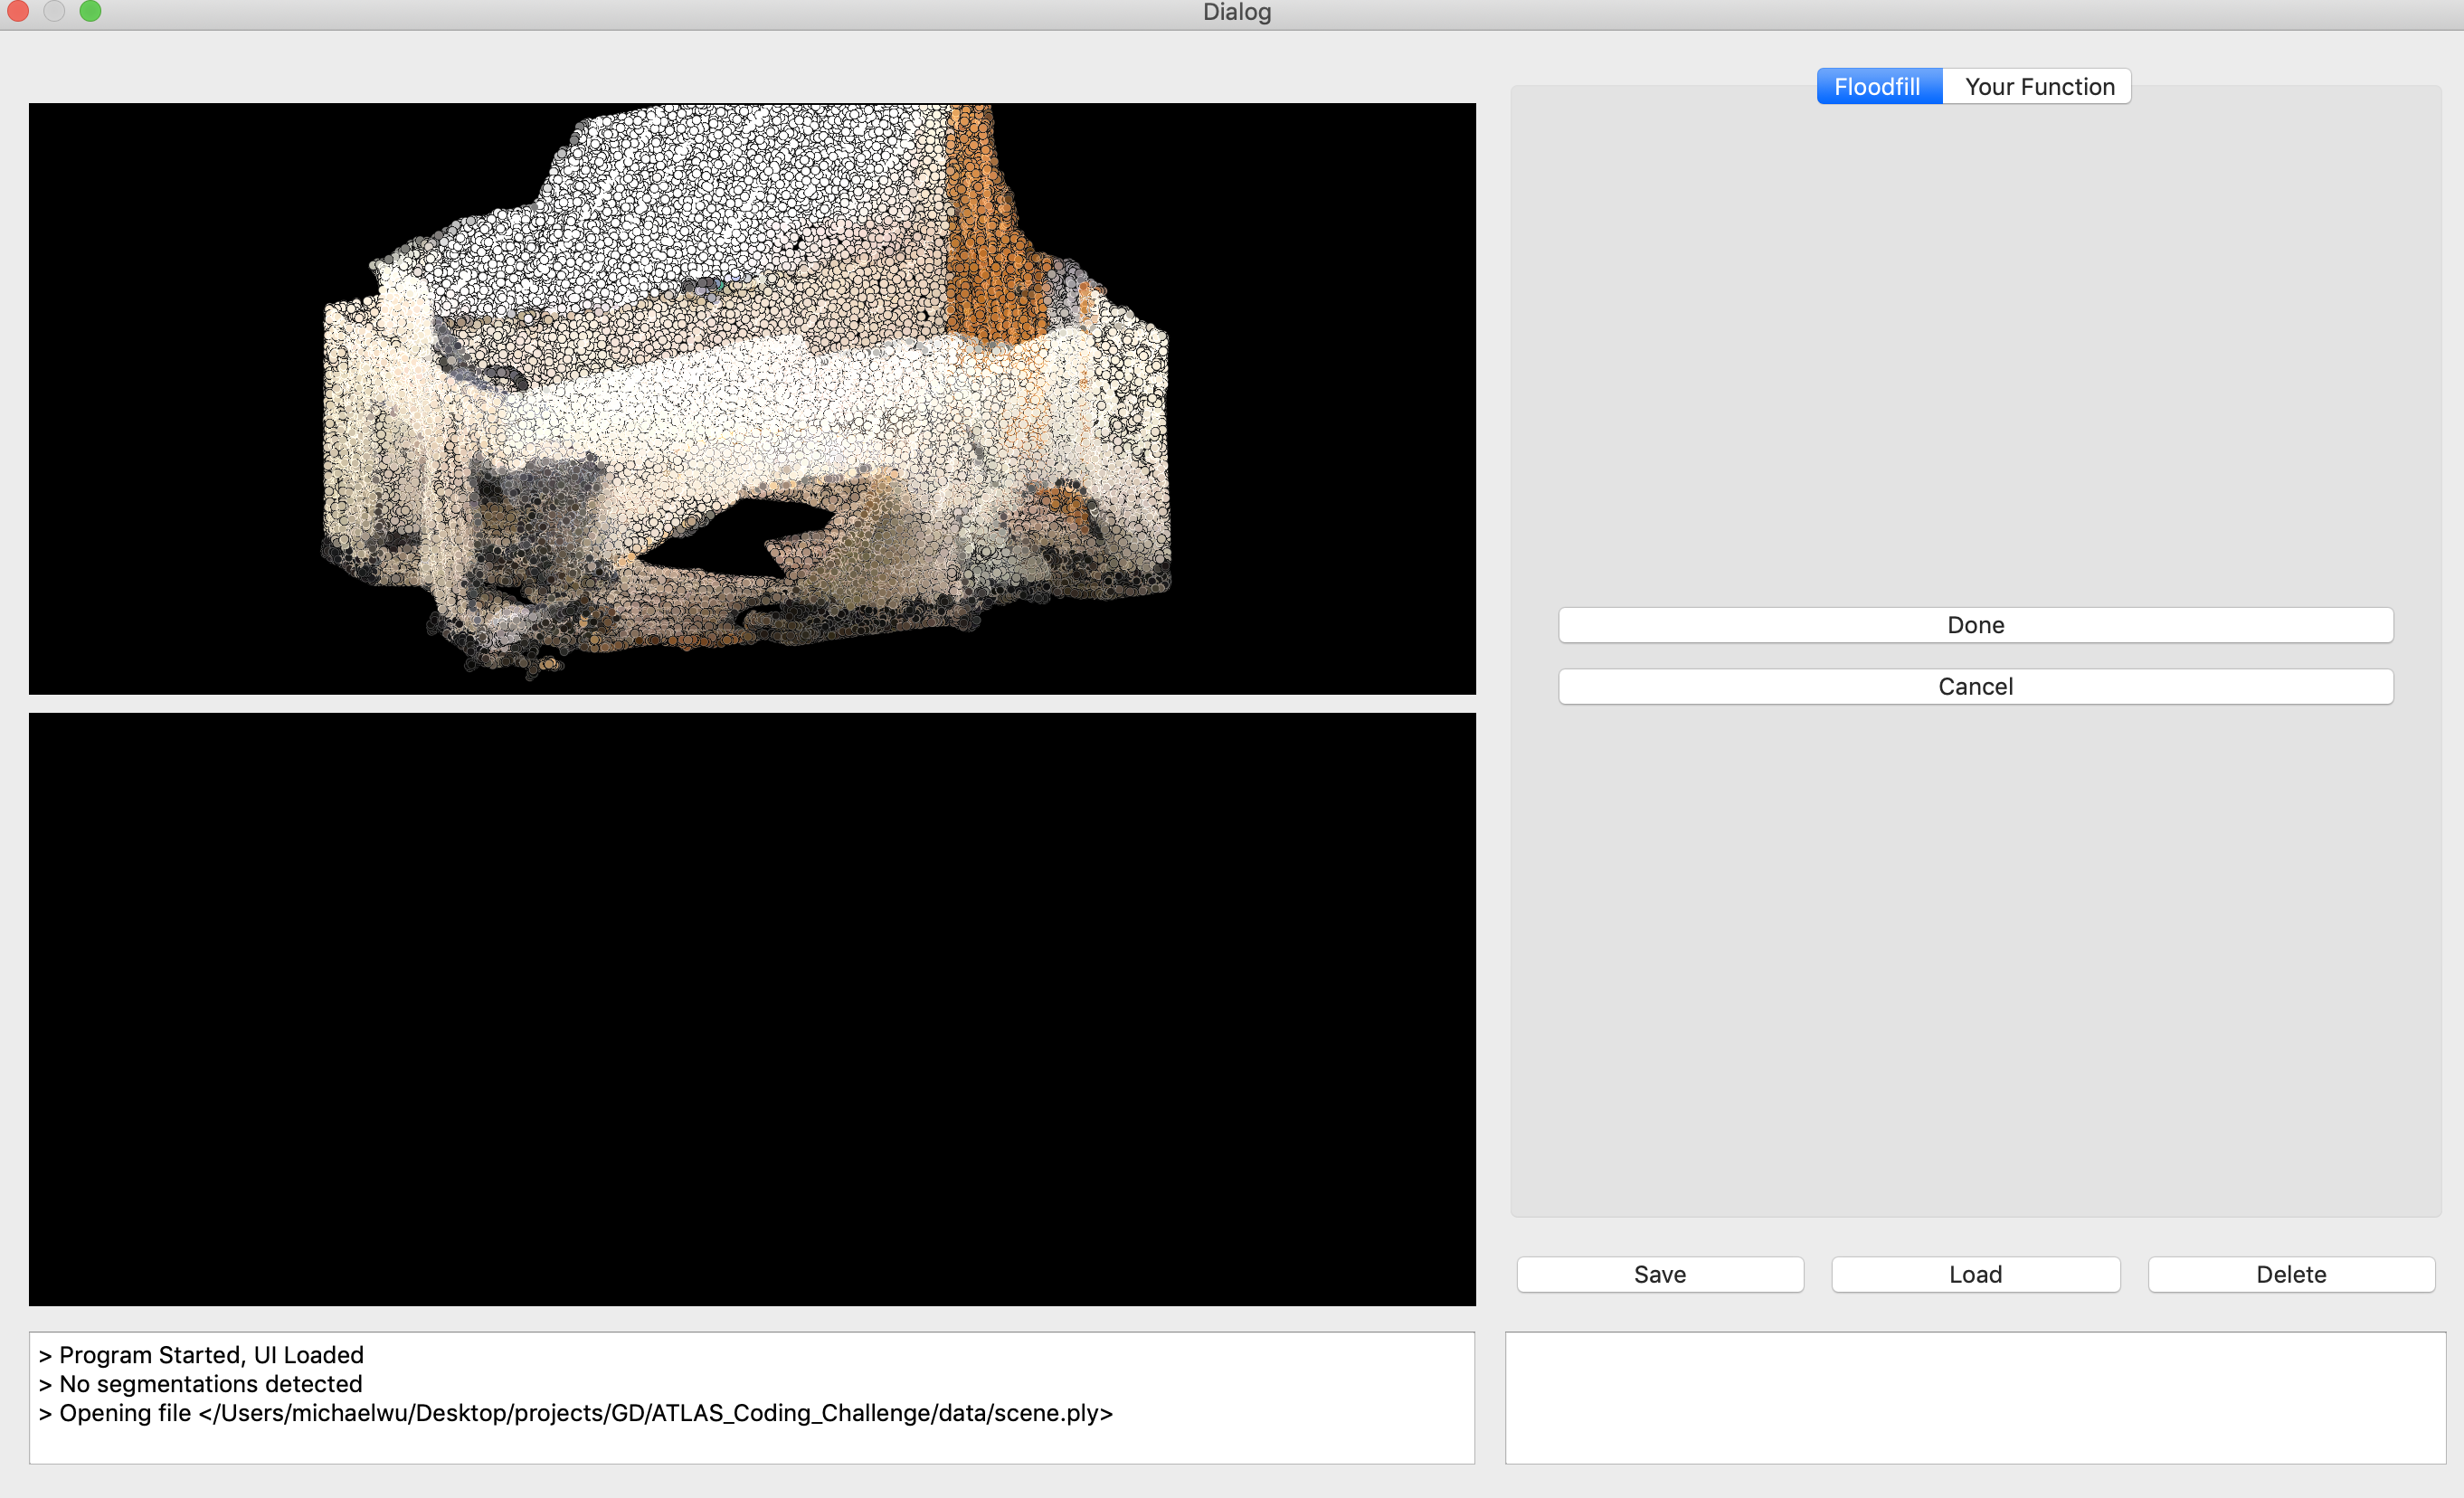
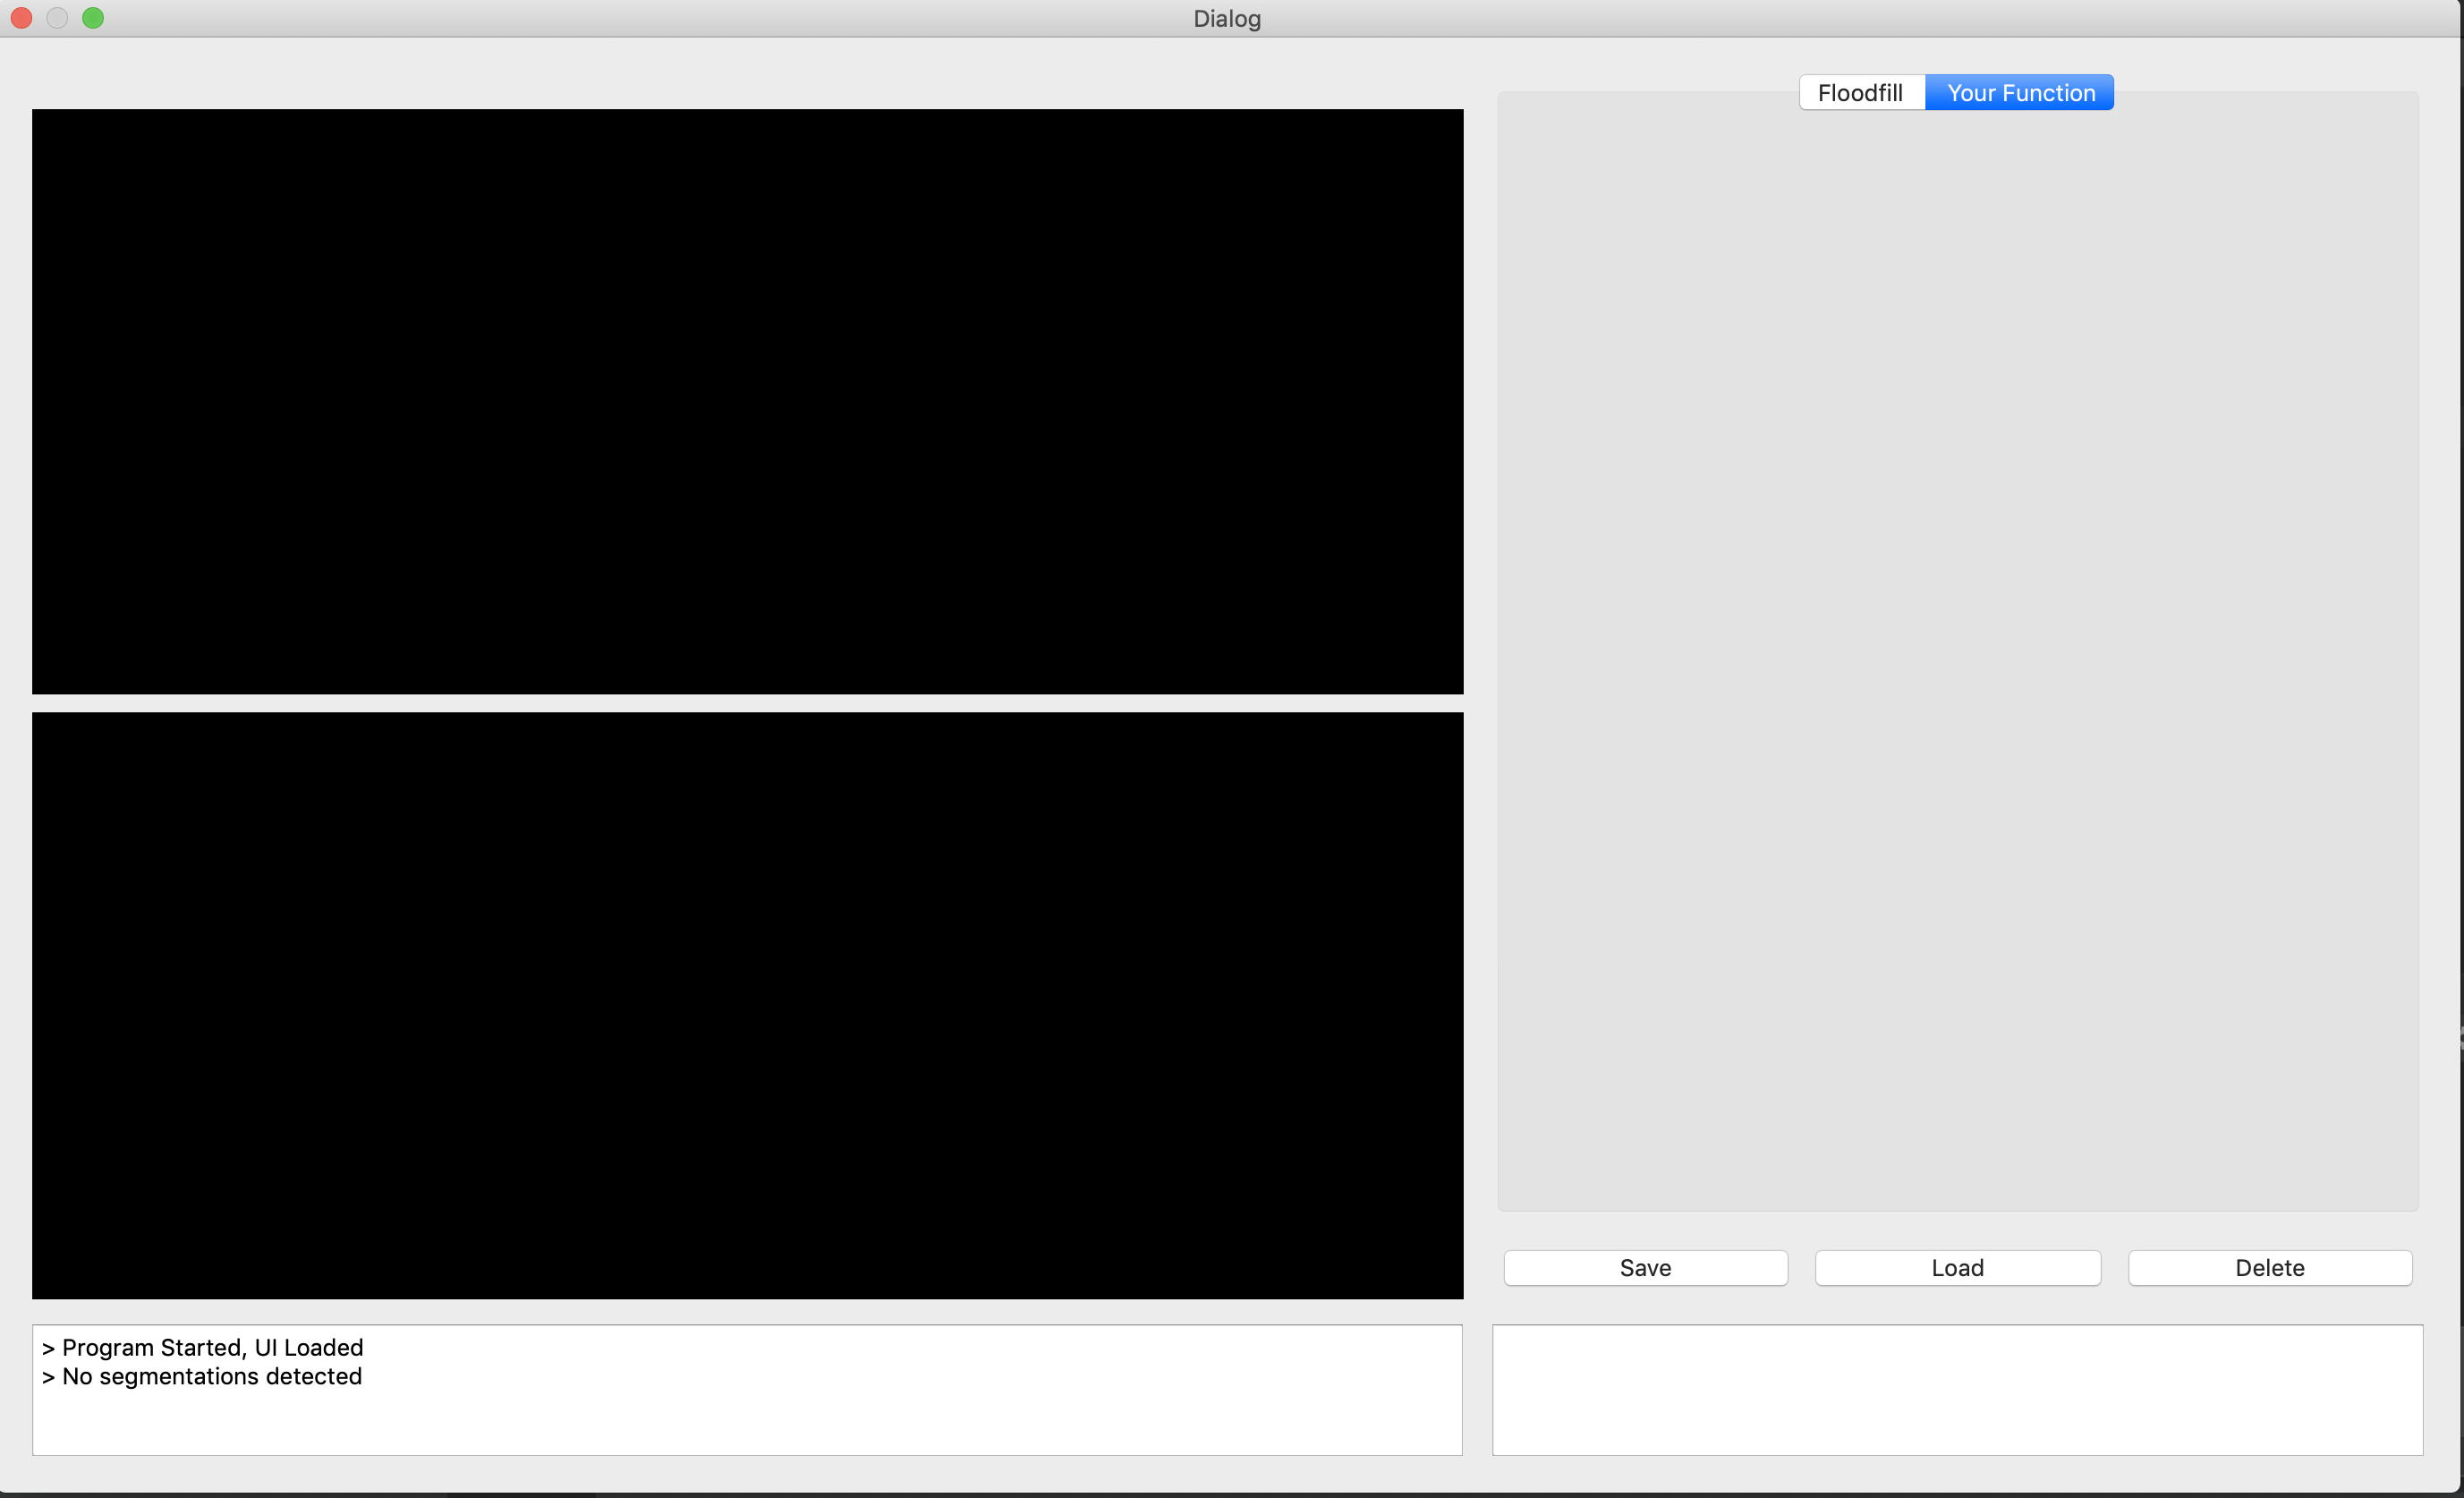
To see if everything is working properly, runpython main.pyand the following window should pop up
- Run the program with
python main.py. - click on the Floodfill tab
- click on the Load button
- Select
data/scene.ply - You should see this screen

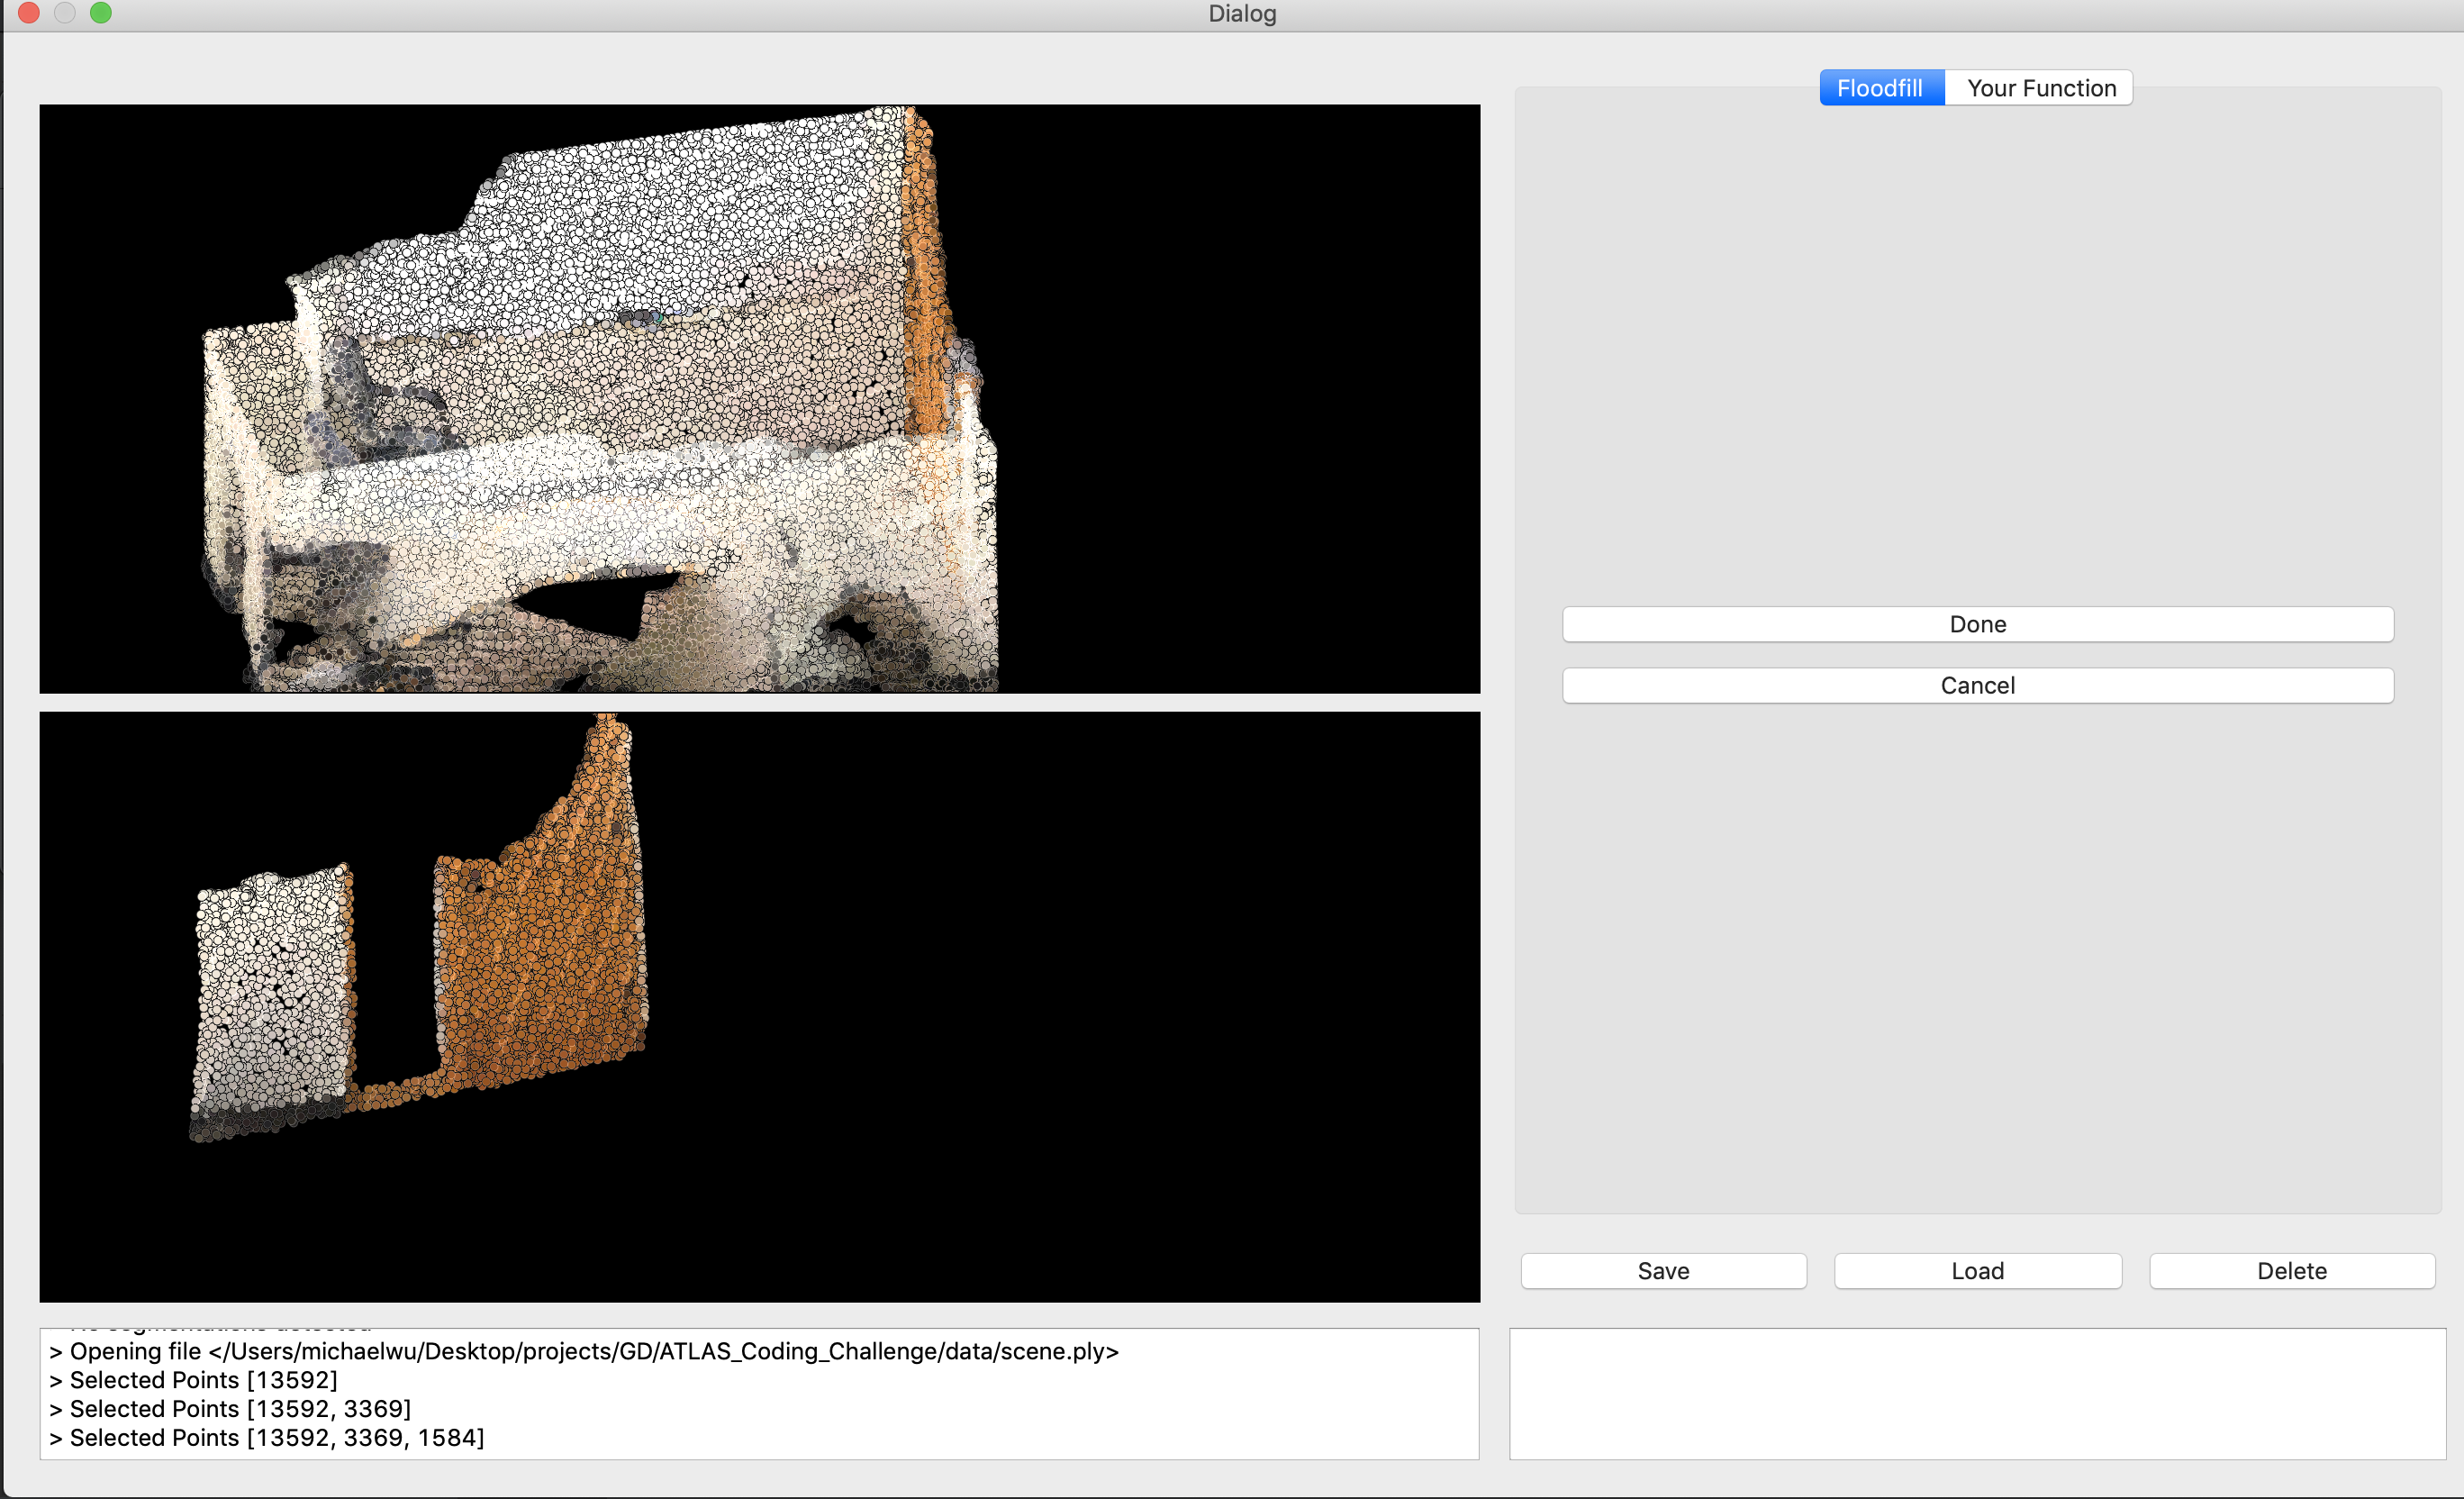
- click on any three points on a wall, and then click Done
- you should see something like this

The goal of this project is to create a software that can help segment and label point clouds for the entire UC Berkeley. The design of this software will be quite complex due to the nature of how big the dataset is and the degree of flexibility that we need to incorporate into the design of this program.
This coding challenge's goal is to
- assess your capability to work with ambiguity
- assess your capability to work with open source libraries and codes with few documentation
- assess your capability to understand existing codebase
Please note that this coding challenge is representative of the work that you will be actually doing in the project.
Specifically, below are the functionalities that we want you to implement:
- Any interactions(buttons, textfields, etc) you decide to implement should be in the Your Function tab
- Display the original pointcloud in the upper display box(the upper display box with the room in the Sample Usage section)
- Display an arbitrary cropped out pointcloud in the lower display box(the lower display box with the wall in the Sample Usage section)
- Currently, when you click there are no points showing, but in the backend, it register a point click. We noted where you can display points in
main.py, line 239. Implement when canvas is clicked, a point will be displayed functionality
Stretch Goal:
- In the Your Function tab, implement input fields that user can provide arbitrary X, Y, Z coordinates, and using those X,Y,Z coordinates, crop out the respective portion of the pointcloud. If any error occurs, write it in the
message_centerin the lower left corner - Implement function for saving and deleting. (Hint: saving is done for you, please see how we are doing it and make sure that you comply with the same schema)
- Please send us an email at
wuxiaohua1011@berkeley.eduwith the following content:- The Github Repository URL that we can review your coding challenge
- Your Resume
- Please make sure that if you installed any external packages, indicate in the Get Started Section or revise the requirements.txt. You are responsible for making sure that the program runs on any computers, and that the we have no problem running and reviewing your code.
- Please make extensive comments in the files on where you revised/added code.
Here are some of the major libraries that this project depends on. Please look into main.py to understand how these libraries are tied together.
- Open3D - http://www.open3d.org/
- VisPy - http://vispy.org/
- PyQt5 - https://www.riverbankcomputing.com/static/Docs/PyQt5/introduction.html
There are many tutorials/documentation online, feel free to use Google for more documentations.
- If at any point, you have any questions or concerns, please email us at
wuxiaohua1011@berkeley.edu, we'll get back to you ASAP.
