- color bar problem solved! yeah 💃
- add install requirment.txt
- next to do
- check varible/function names
- write/draw code structure
- tests
- make the front-end nicer, maybe add range bar
- Updated the file name to plotSoldPriceMap_v2.py
- Using getopt command line flag I/O rather than args. Reason: more informative, graph size and dot size become optional inputs.
- Updated varible/function names (I really appreciate for the feedback!)
- Updated variable names to readable camel style.
- Updated function names to readable snake style (sometimes combined with camel style within the name).
- Some unchanged names based on conventions, I will adapt to the company tech team style when I can read scripts from you. :)
- Added code structure for main functionalities explaination.
- next to do - tests
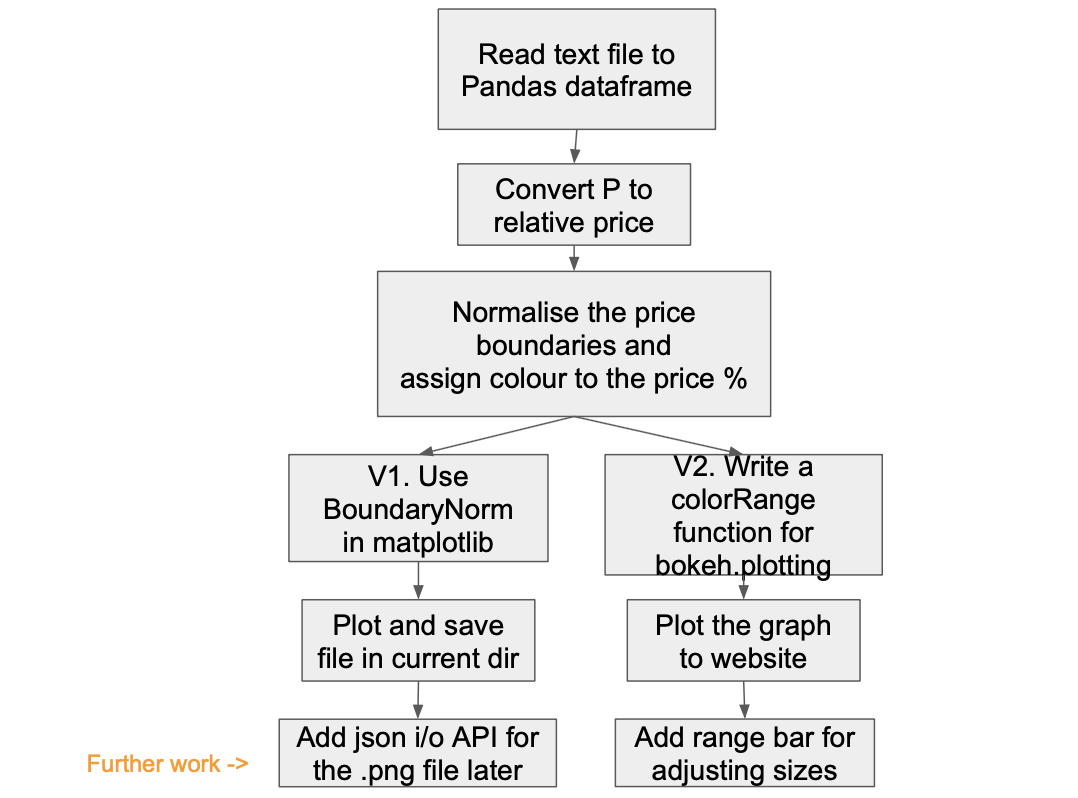
The problem I tried to solve here is to load the text file data and plot the data into a heatmap style scatter-graph on a website. Please see this flow diagram for the steps I took to solve the problem and the detailed descriptions that follow below (updated version10/10):
The steps I took are:
    1. Reading the text file to a dataframe (using pandas.read_csv).
    2. Coverting the price value (P) to relative/percentage price, meaning (P1, P2,...Pn)/(Max_P-Min_P).
    3. Setting the colour proportions and % boundaries for the plot, for which I used two methods:
      3.1 Using matplotlib.colors.BoundaryNorm to normalise the ListedColormap with suggested boundaries.
      3.2 Using bokeh.plotting for the realtime web plot display.
         3.2.1 It was not as simple as BoundaryNorm, and I have written a function (colorRange) to locate each colour with different price boundaries.
      3.3 For both approaches, the boundaries of the colour range are:
        0% - 5%     yellow
        5% - 25%    pink
        25% - 75%   red
        75% - 95%   green
        95% - 100%  cyan
    4. Plotted each point onto a grid.
        The points are filled with colours representing how expensive a house was in relation to other houses.
        You are able to choose:
          - The size of the plot graph.
          - The size of the points.
          - The different input.txt file names.
          - The output.png file names.
    5. Compromises and assumptions:
      5.1 I ran out of time while working on the plot in the bokeh/web version. Also it would be great to know how to display the colour bar in the proportional style shown in the matplotlib plot.
      5.2 I personally did not have much experience in unit testing, so I would like to add some more to it later.
      5.3 Although diffierent input files can be processed, the data structure has to be X, Y, Z (X and Y for coordinates, Z for price). Otherwise the remaining column would be ignored. Also if there are only two columns of data in the text file, there will be an error. I would like to solve this later.
      5.5 More exceptions and validation needs to be added to validate the inputs.
-
Go to the Backend folder: Download the plotSoldPriceMap_v2 file; Save it in the same folder as sold-price-data.txt
-
Example command in terminal:
python plotSoldPriceMap_v2.py -i sold-price-data.txt -o priceMap.png -g 6 -d 8This command wil generate a png file called spm.png with a graph size of 6 and a scatter dot size of 8.

-
Detailed explaination for the inputs:
- -h : Print this help message and exit.
- -i FILE : input-text-data-file-name.txt, process text from input file FILE.
- -o FILE : output-graph-file-name.png, write results to output file FILE.
- -g PARAMETER: The size of the output graph, I suggest choosing a number between 5 and 30.
- -d PARAMETER: The size of each scatter point in the graph, I suggest choosing a number similar to the graph size, so that a larger graph has bigger dots.
-
code structure, please see more details at Backend-README file
Please clone this repo for easier running of the code.
- Go to FullStack folder.
-
If you have copied/cloned all folders and files from FullStack dir:
-
Installations:
Required libraries are listed in requirements.txt file.
Run the installation for Django and Bokeh with:
pip install -r requirements.txt -
Run python code:
Run the command:
python manage.py runserverOpen the local server http://127.0.0.1:8000/
-
-
D. Other works in my repositories
- The books I wrote for BT Further apprentice software engineer training.
- I have experimented with Kivy to write phone apps.
- Django website for to do list.
- Django website for internal website of a programme I taught.
Please feel free to give suggestions through my email: chenhao.wu18@gmail.com or through my LinkedIn

