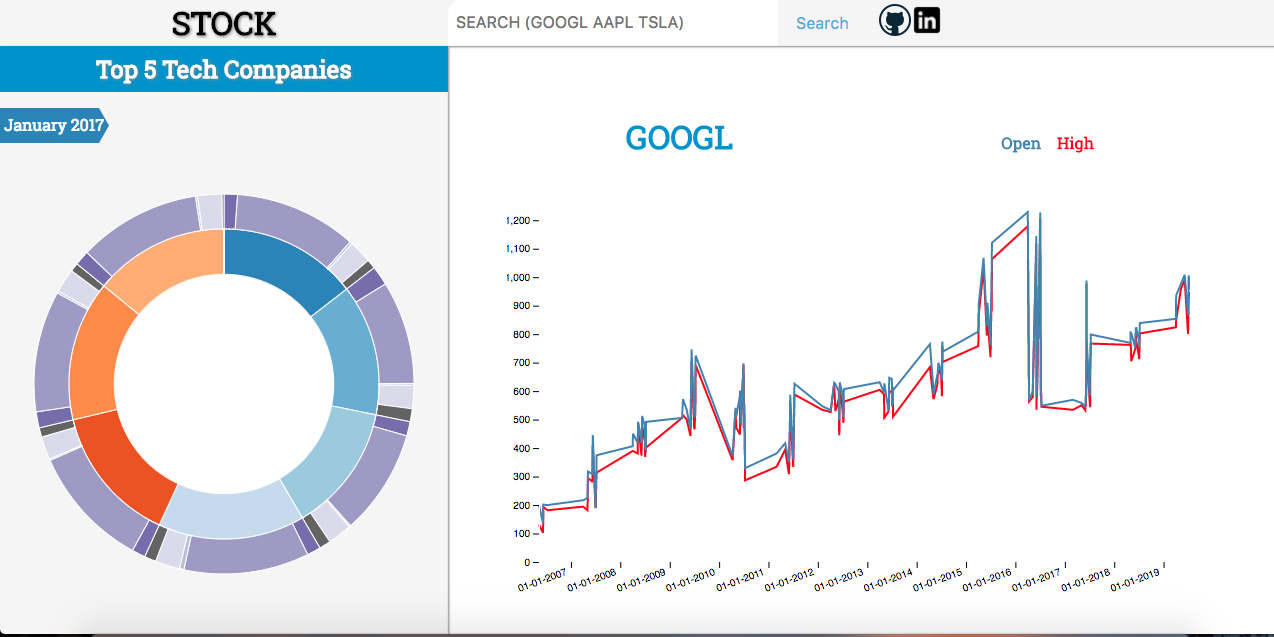
 Stock is an intuitive and informative web application which is backed with predictive and historical data of stocks. Thoroughly implementing D3's data visualization.
User will be able to search a company's particular stock.
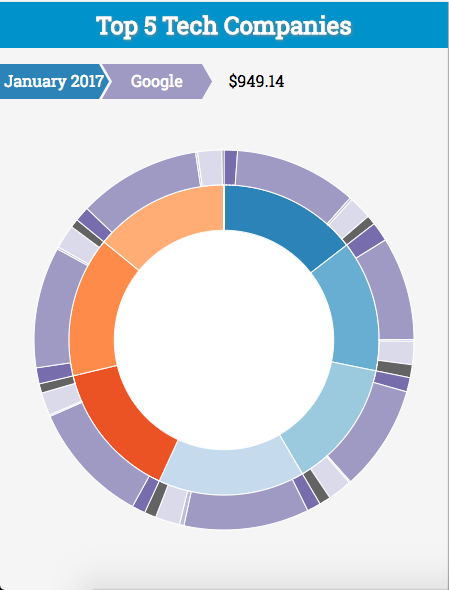
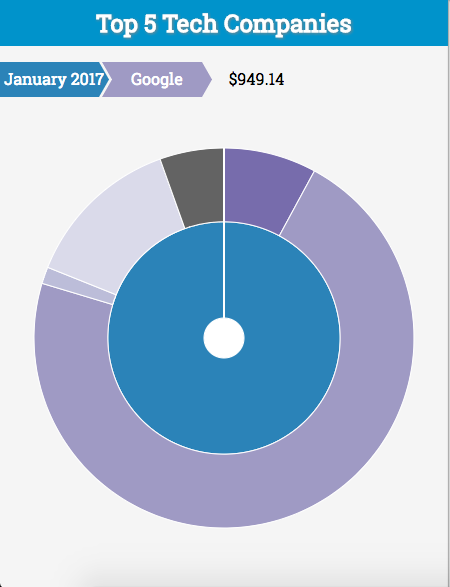
Top Five Companies- Showcased with an interactive sunburst chart of Top Five Tech Companies and their stock values throughout 2017.
Search- Allows user to search for a particular stock using
Alpha Advantage API. Sunburst- Interactive
D3Sunburst Chart with zoomability and breadcrumbs.
- Interactive
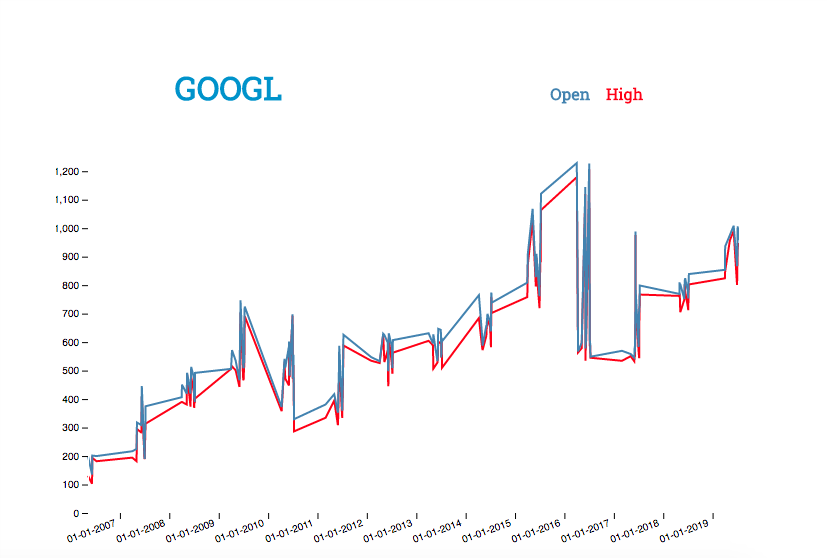
Line Graph- Rendered stock open and high value with
D3.
- Rendered stock open and high value with
Sunburst is created with D3 which utilizes functionalities of tree nodes and render within a radial pattern.
Breadcrumbs are rendered when hovered to show the sequence of the tree map to reaching a section.
function mouseover(d) {
  d3.selectAll('h2').remove();
  // getAncestors Array sequence
  let parents = getParents(d);
  updateBreadcrumbs(parents);
  // drop opacity of all paths
  d3.selectAll('#sunburst svg g path')
    .style('opacity', 0.3);

  svg.selectAll('path')
    .filter(function(node) {
      return (parents.indexOf(node) >= 0);
    })
    .style("opacity", 1);
}
Allows search of any stock with their corresponding symbol. Updates Line Graph when found.
- Add more interactive functionalities to Line Graph
- Give more direction for end user
- Improve the sunburst with more data which divides stocks into different business sectors.


