This repository provides Python 3 Jupyter notebooks and code snippets for our common tasks.
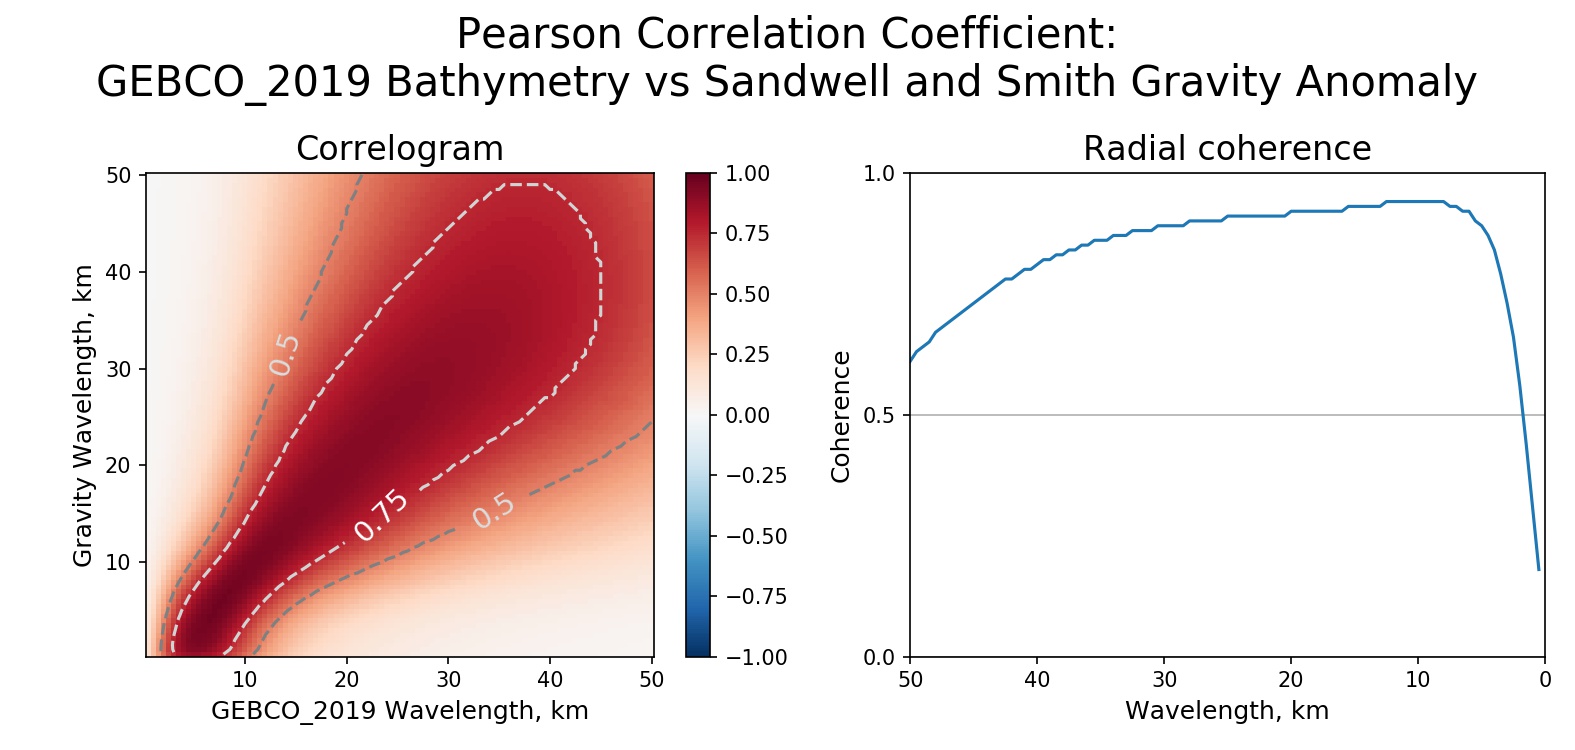
Here we extend analysis and visualization methods from "9.1 Computing Coherence on 2-D Grids" from "The IHO-IOC GEBCO Cook Book", contributed by K. M. Marks, NOAA Laboratory for Satellite Altimetry, USA. See also more detailed explanation of the original approach in a paper "Radially symmetric coherence between satellite gravity and multibeam bathymetry grids" (Marks and Smith, 2012).
For details see LinkedIn pulications Spectral Coherence between Gravity and Bathymetry Grids and The Density-Depth Model by Spectral Fractal Dimension Index
Usually we use raster data processing whch is fast and well-optimized due to defined data grid. Nevertheless, there are lots of cases when we require for sparse/irregular/multicale data processing. It can be done dy different ways and PostgreSQL/PostGIS engine for data processing is powerful and helpful.
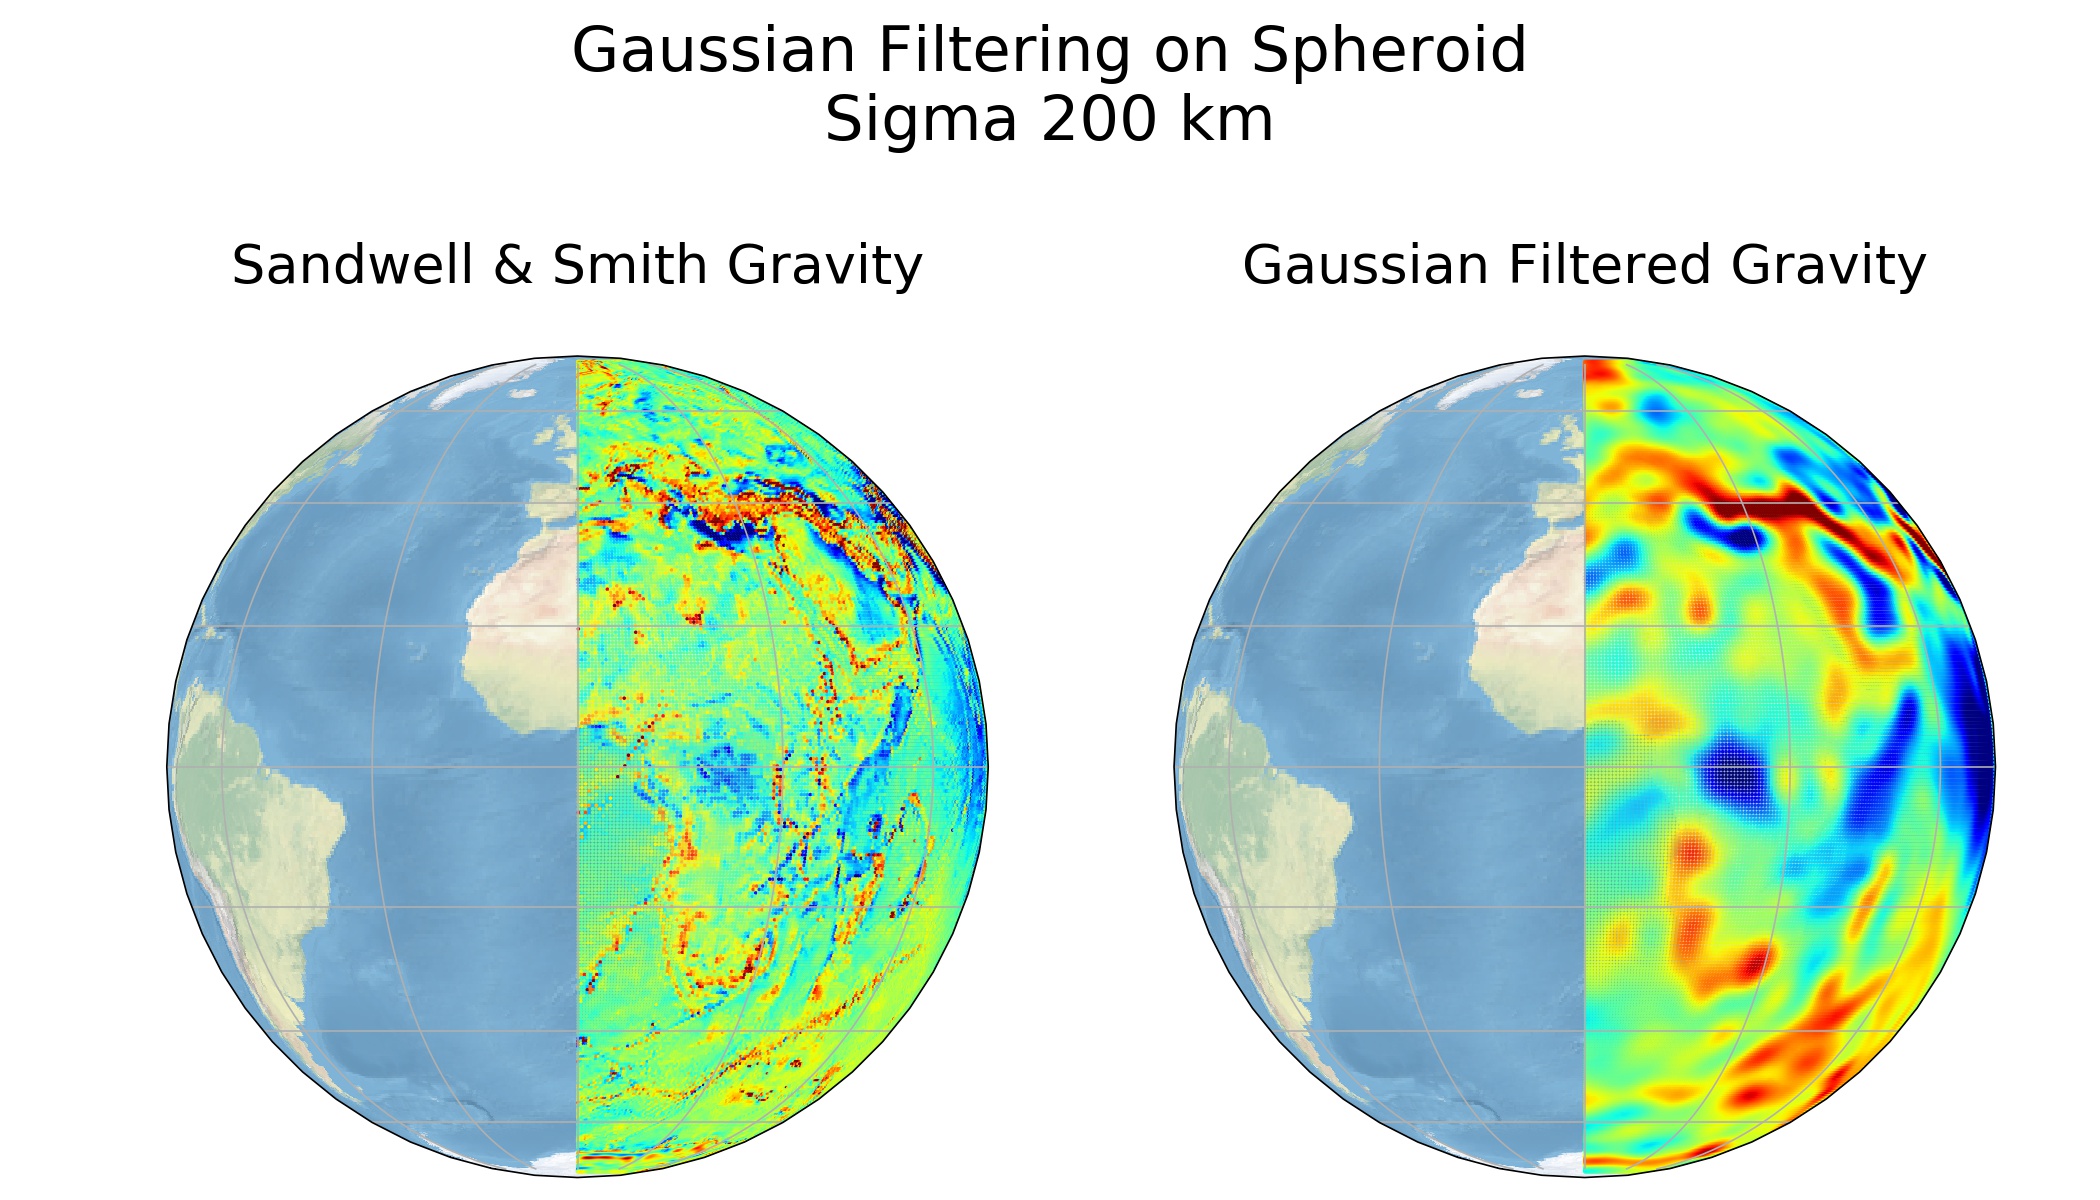
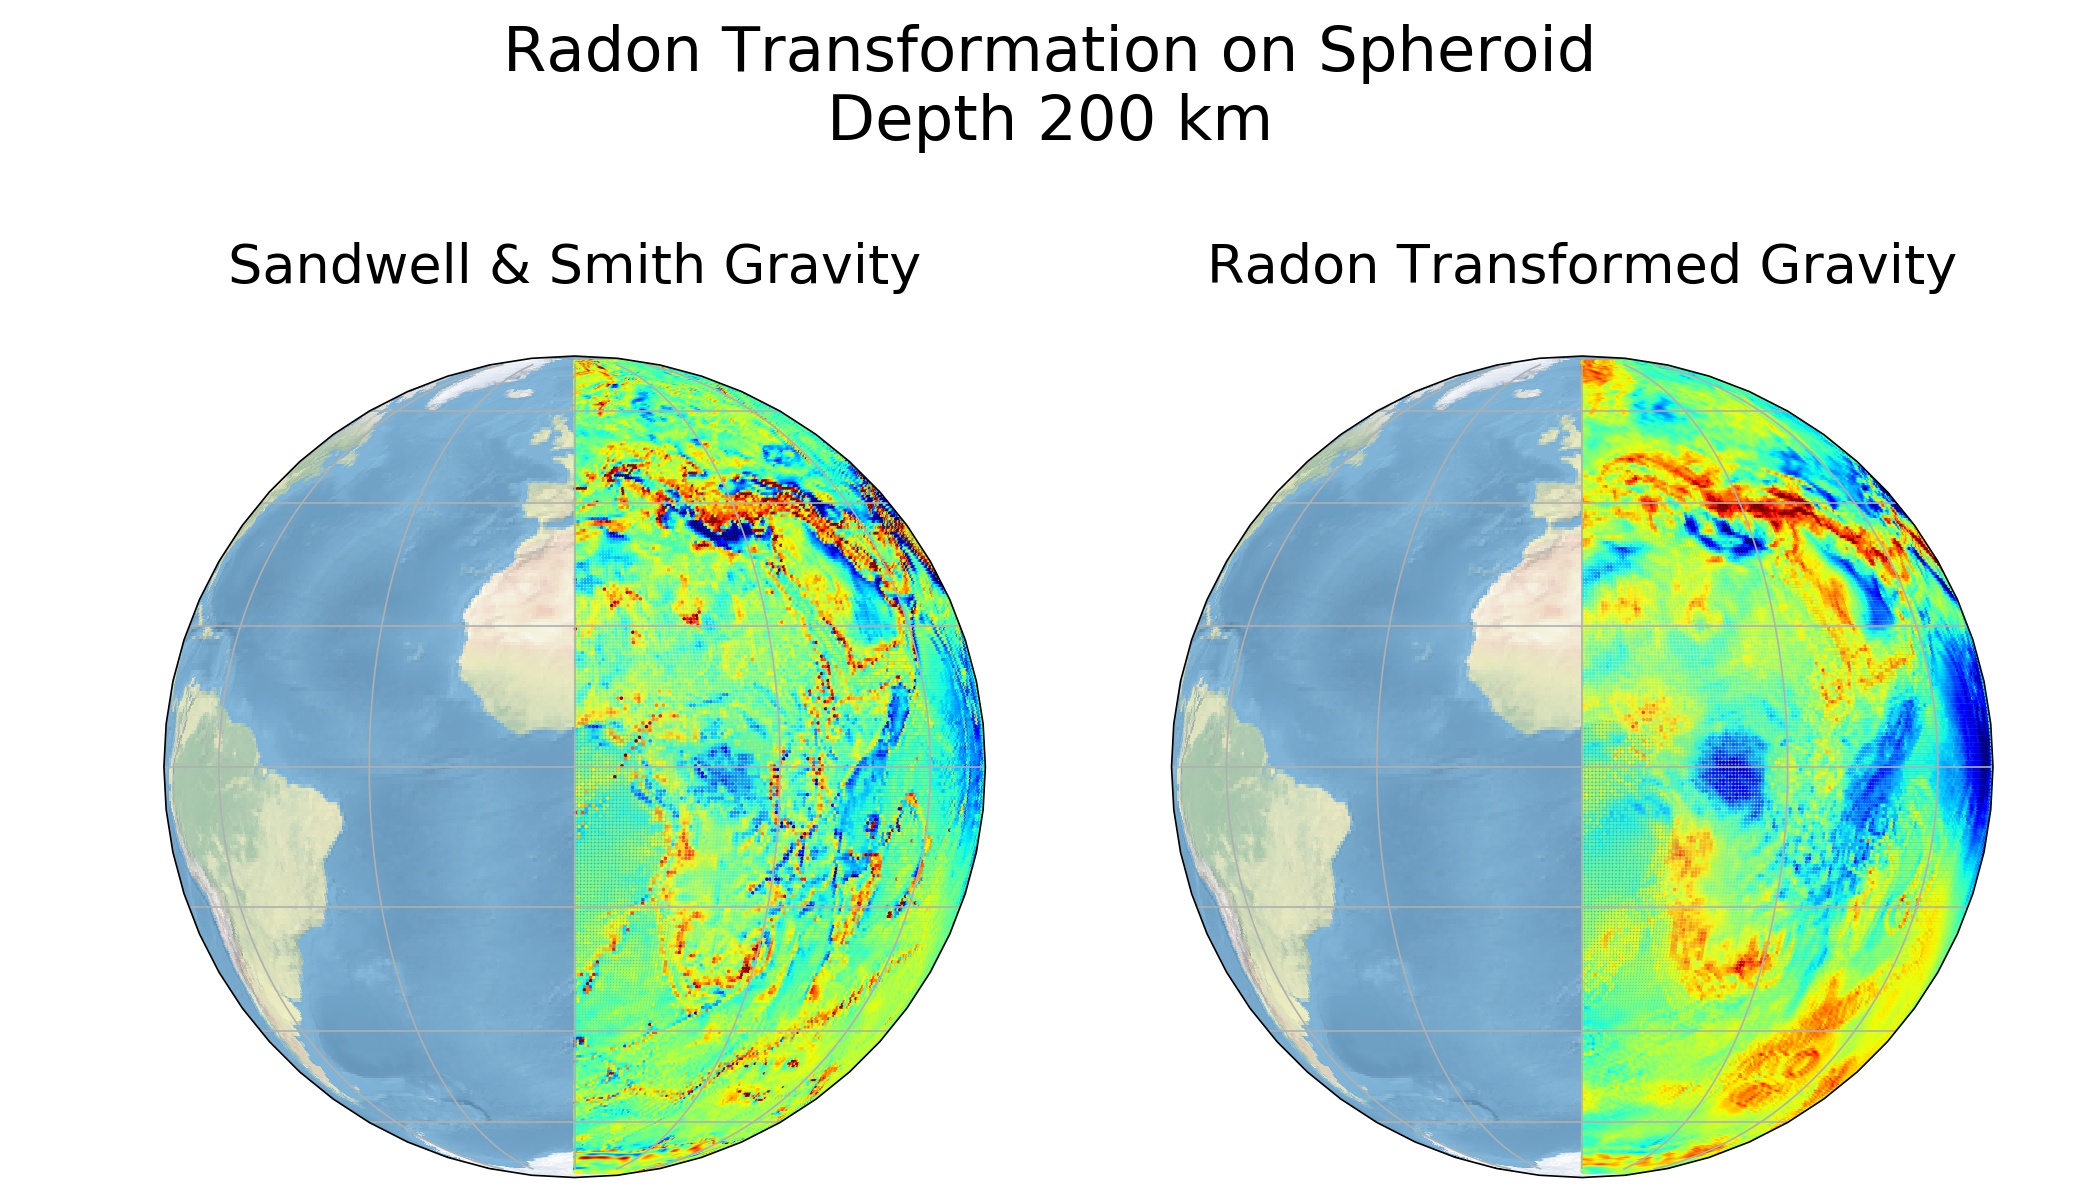
- Spheroid based spatial data processing for irregular data. Here Radon Transform creates bins by radial distance from point and calculate average values for the bins and Gaussian Transform calculates transformation weights by distance on sphere (or ellipsoid). That's slow relative to regular grid processing but allow high accuracy processing on sparse data.
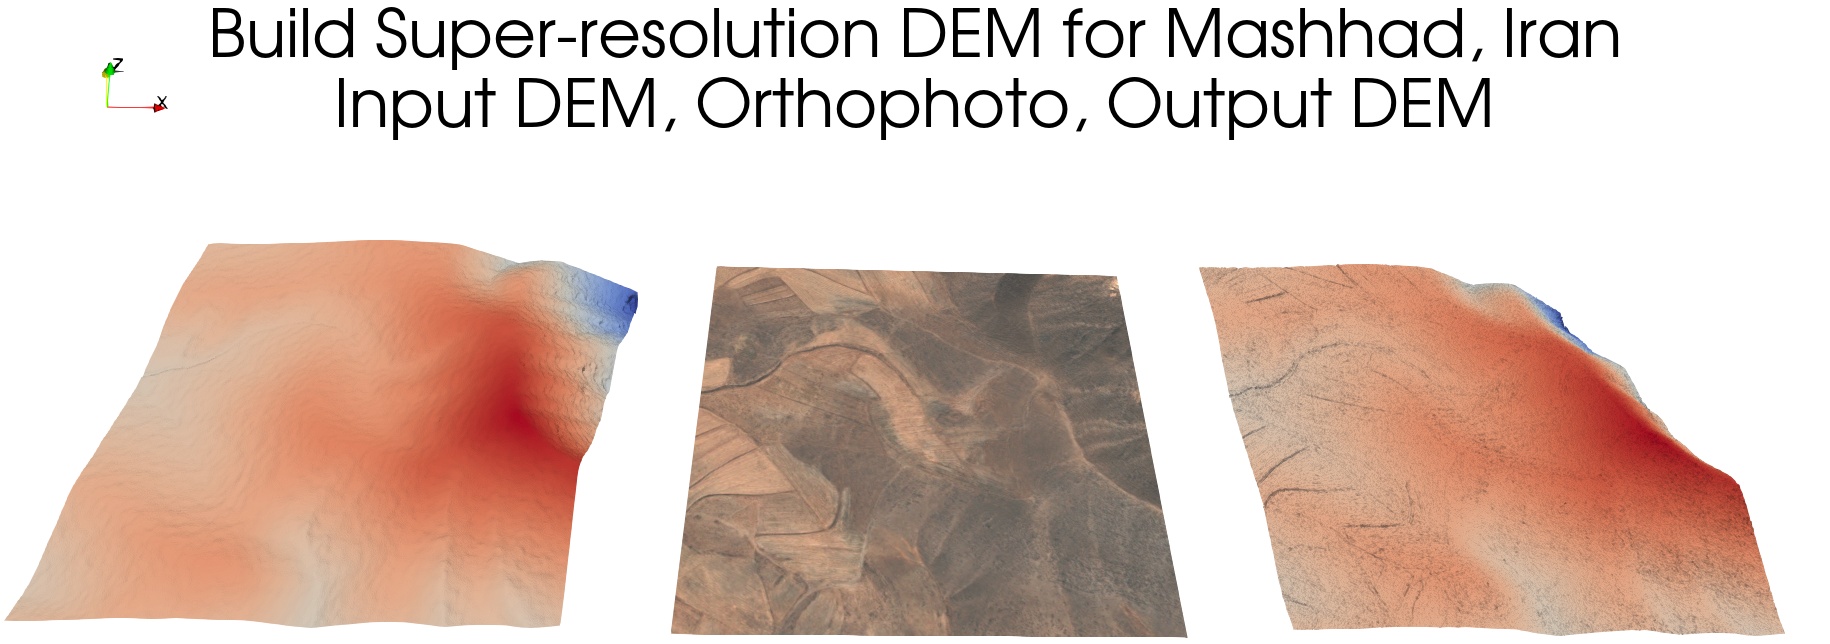
- See Super Resolution for gravity enhanced by DEM and [Elevation1 - Mashhad, Iran](Elevation1 - Mashhad, Iran) for DEM enhanced by satellite/orthophoto image by spatial spectrum transfer technique. Check the spatial correlation (coherence) and transfer the waveband with spectrum components amplitudes normalization.
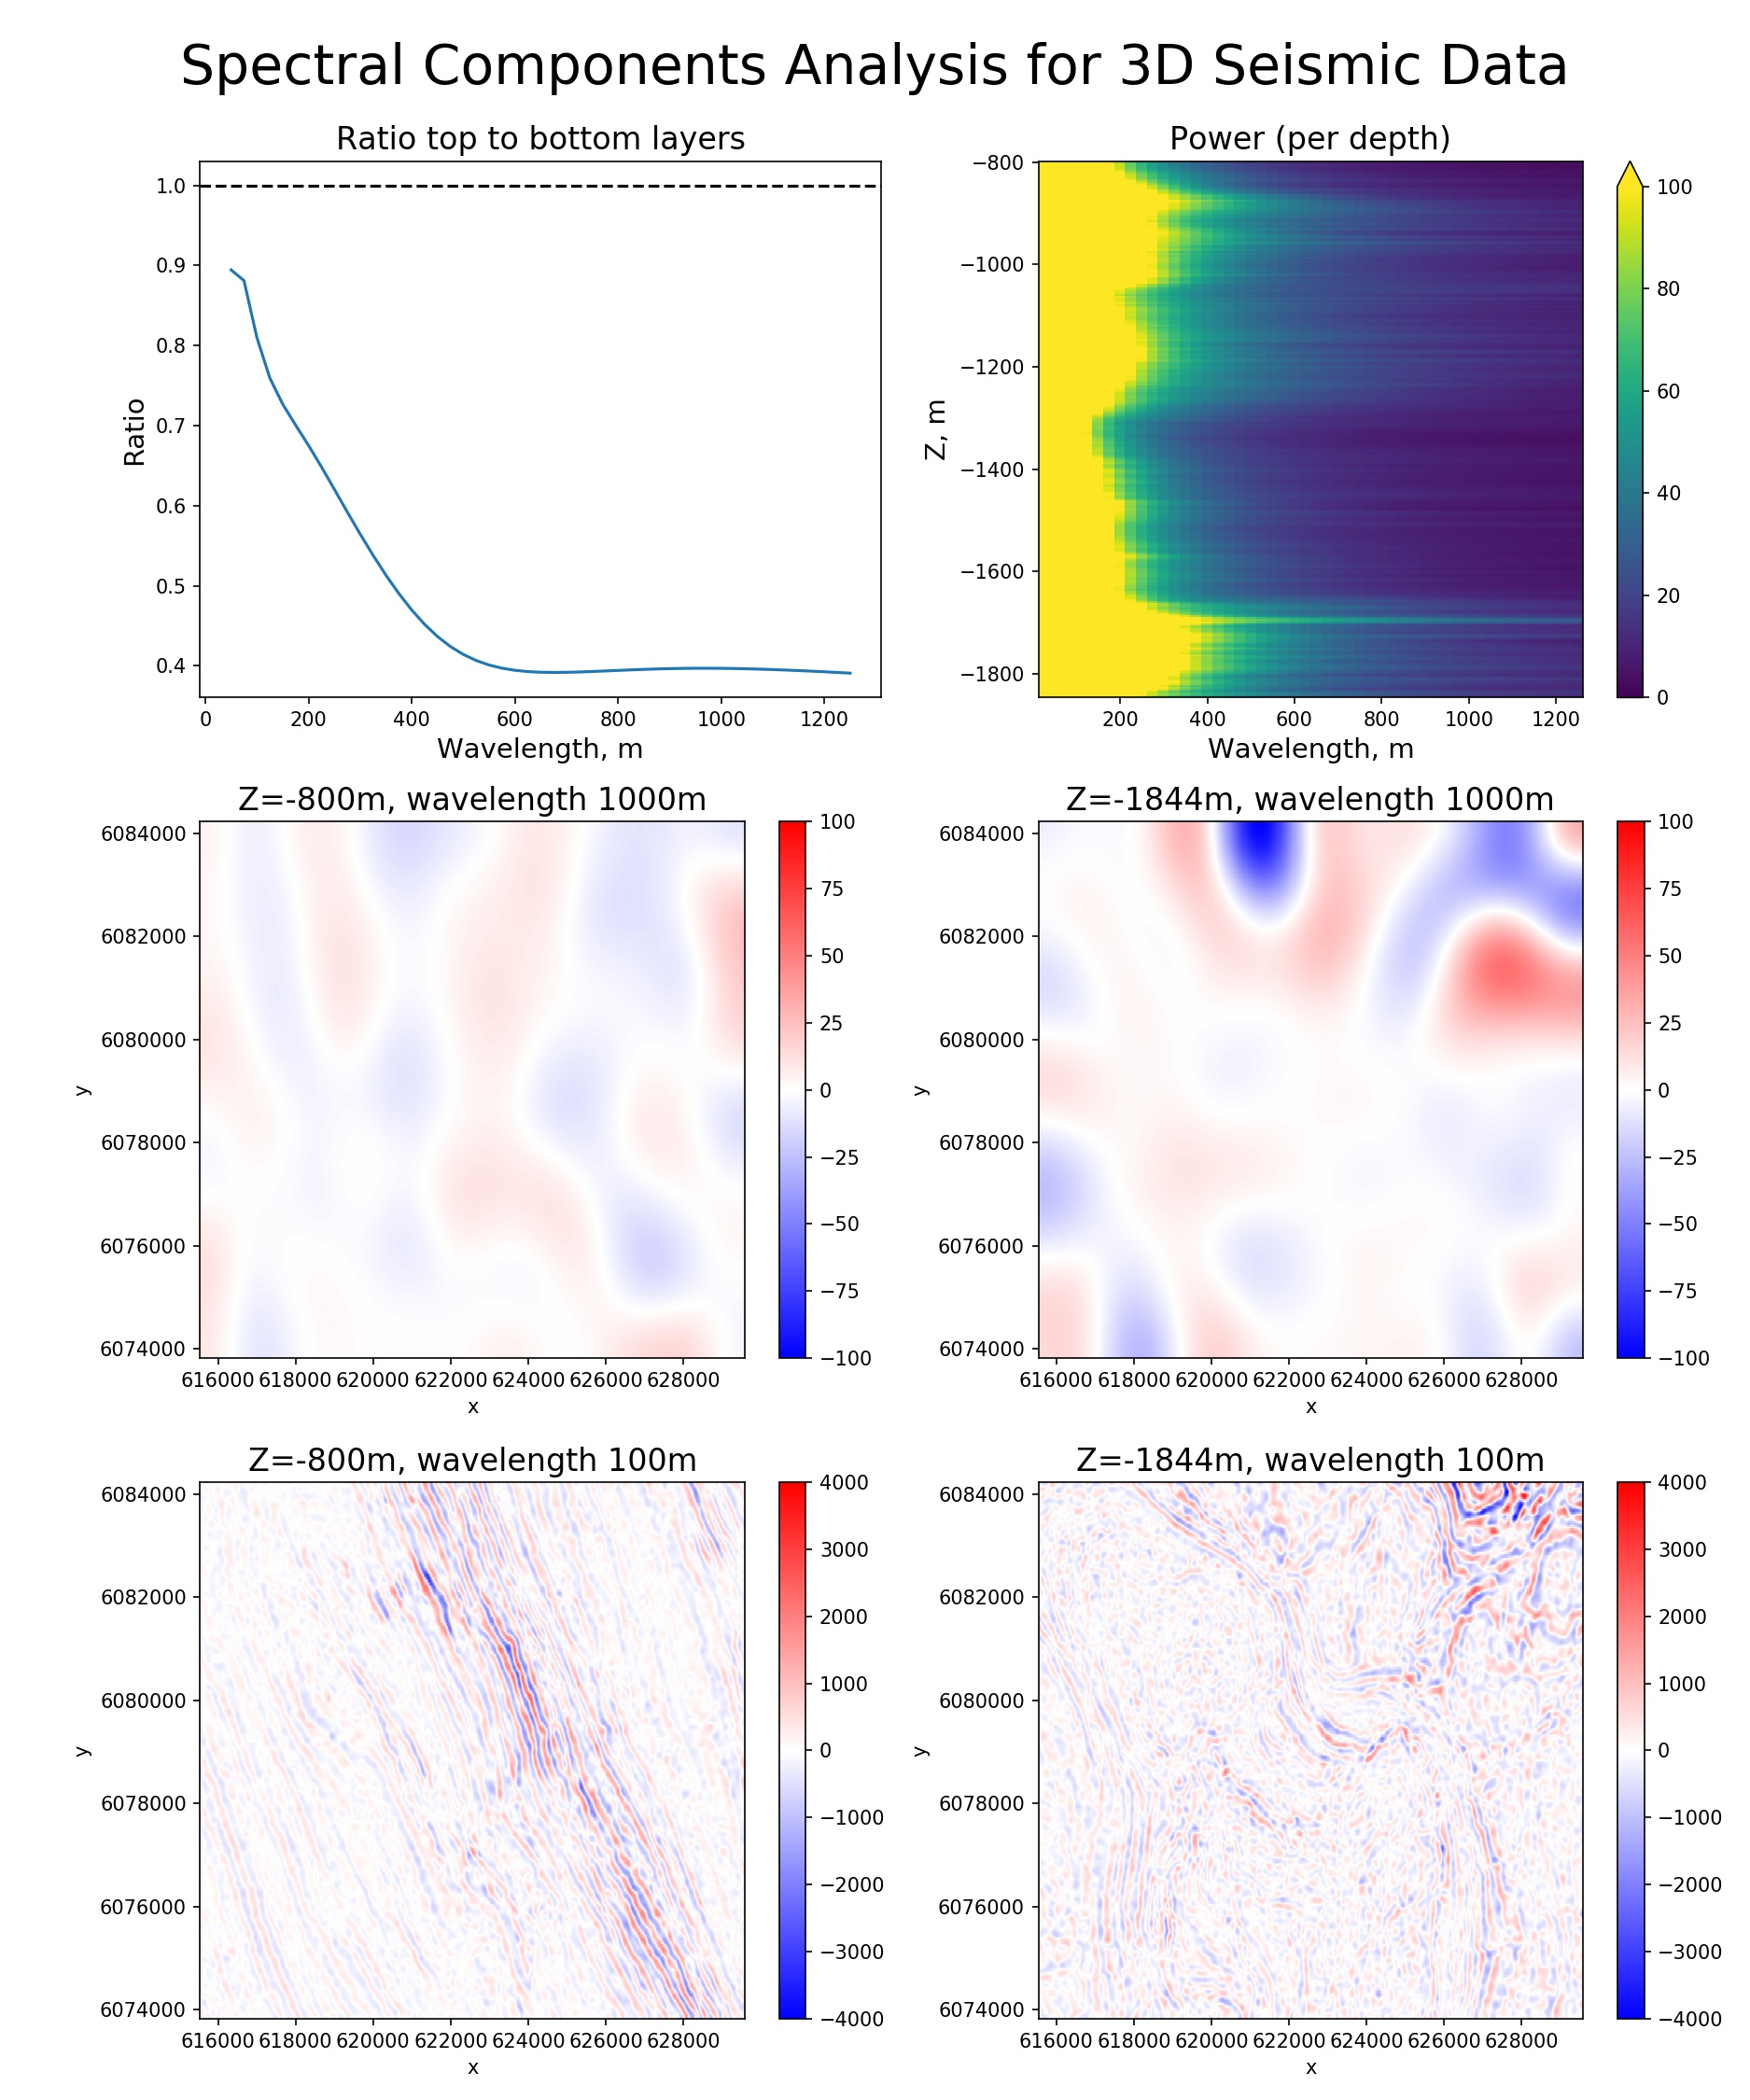
- 3D Seismic Spectral Components Analysis illustrates 3D spatial spectral analysis to check data quality and estimate the real spatial resolution of 3D seismic data
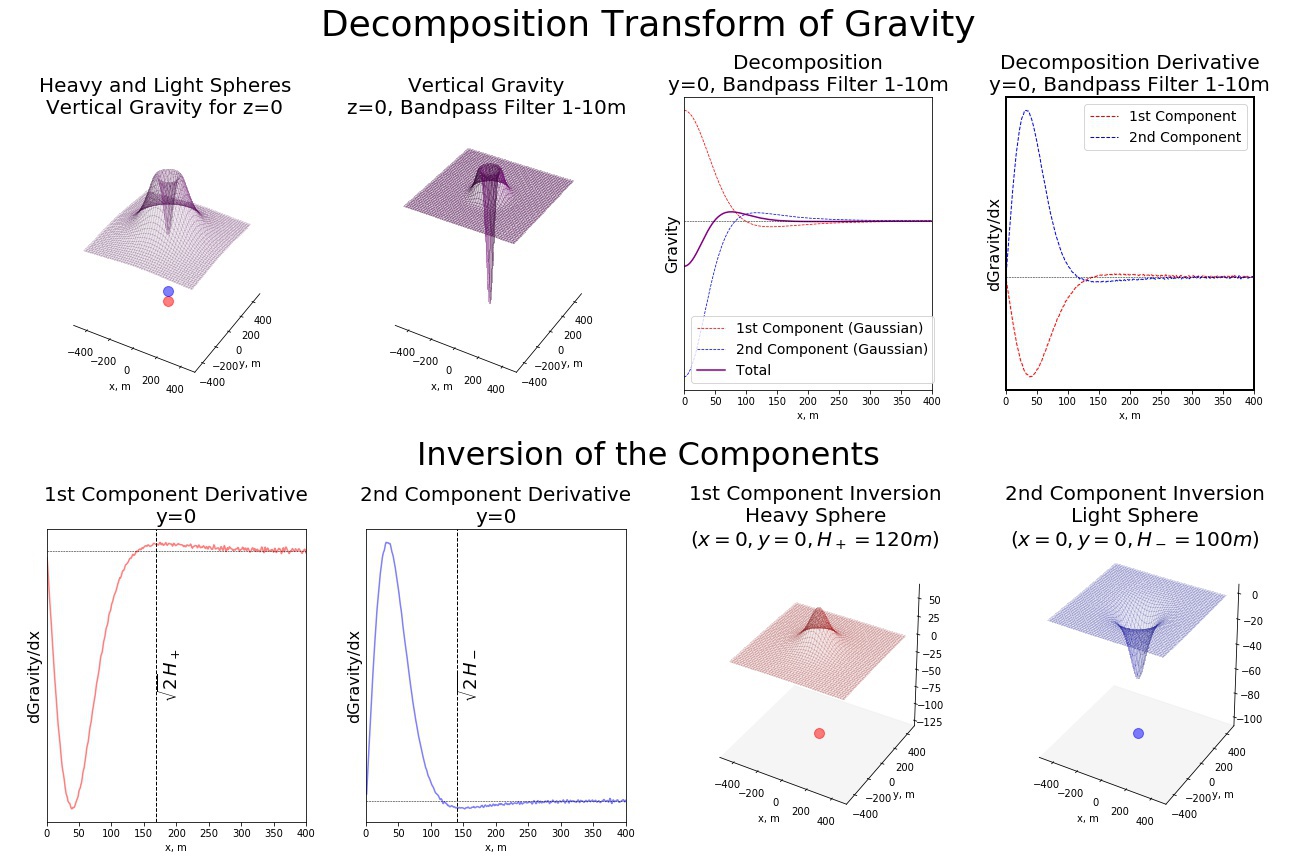
- Mathematics of Gravity Inversion
See mathematical basics for gravity decomposition transforms applicable for Computer Vision (CV) methods.
Simple 2D model illustrates gravity inversion math described above.
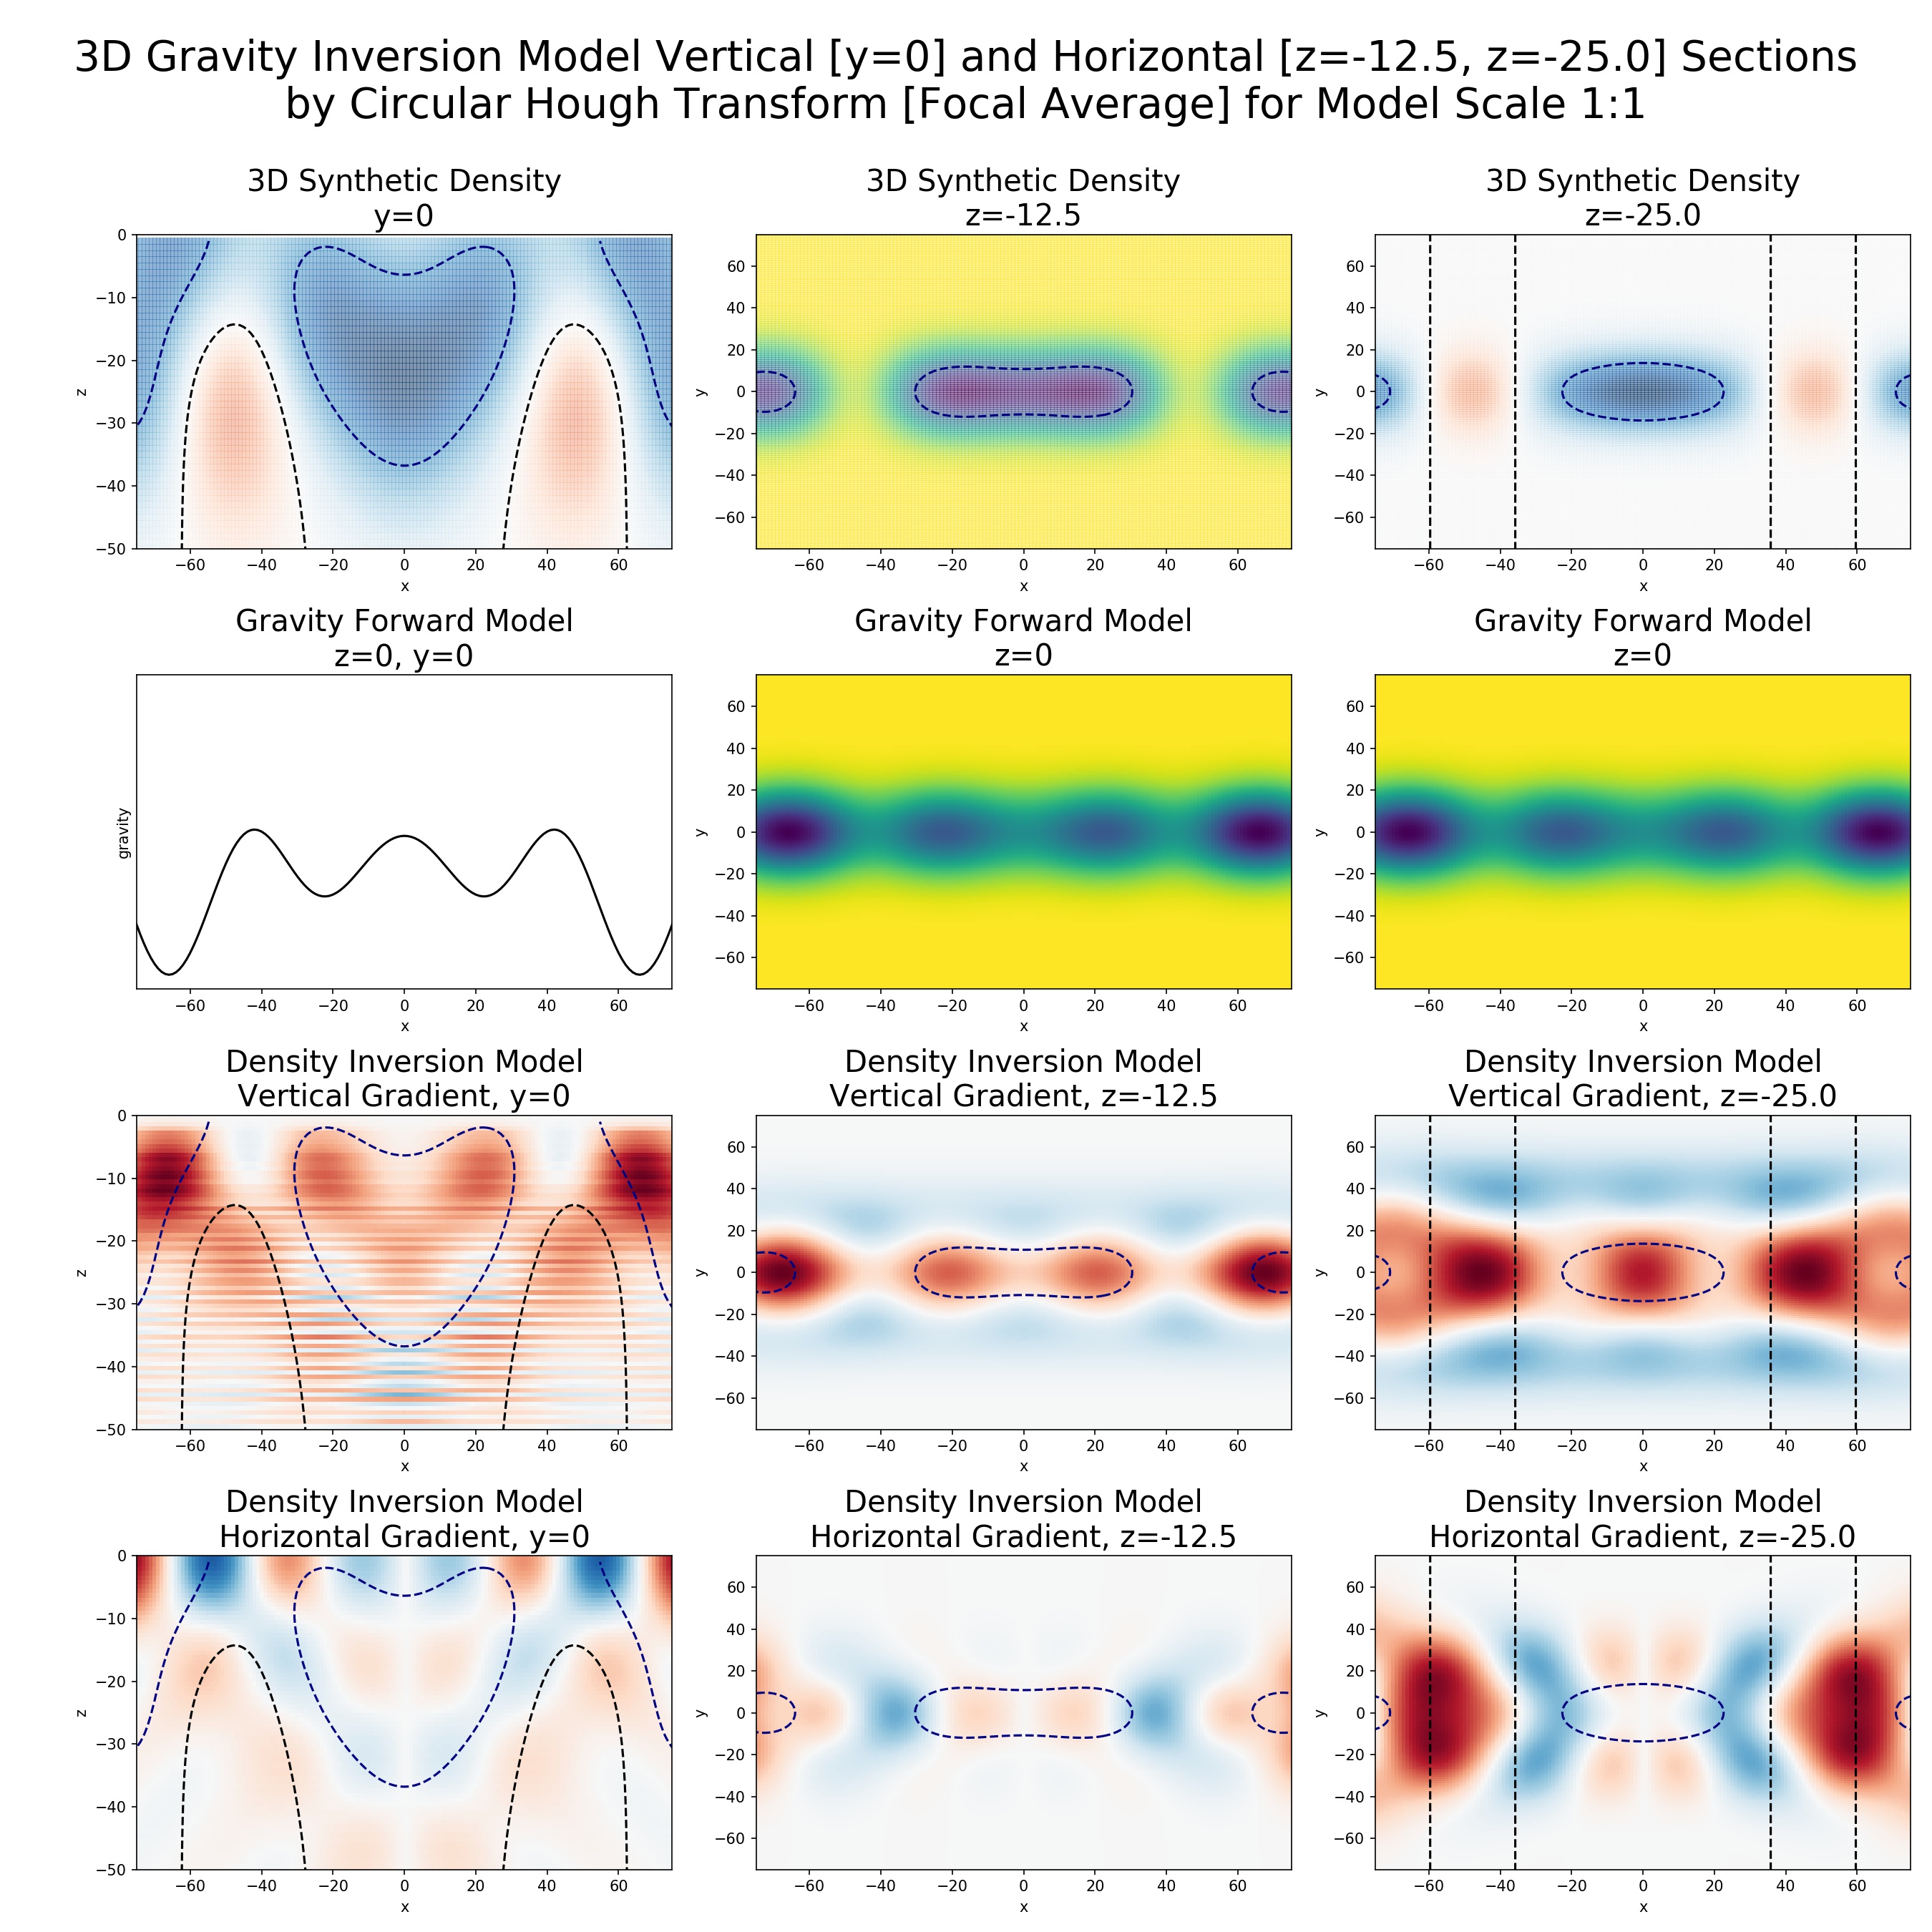
A set of 3D models for different synthetic density distributions inversion. In addition, the models include Density Inversion by Fractality Index.
ParaView is the best 3D/4D data processing and visualization software which we know. And it's completely free and Open Source and embeddes Python 3 interpretator and libraries for for advanced users. See our ParaView snippets to do lot's of spatial data processing tasks like to loading different raster and vector data formats, reprojecting and so on inside ParaView. We use the snippets as is and modify them for some one-time tasks. Also, we provide separate repository N-Cube ParaView plugin for 3D/4D GIS Data Visualization for common repeatable tasks like to DEM and satellite images and shapefiles 3D visualization, well logs visualization, table data mapping ans more.
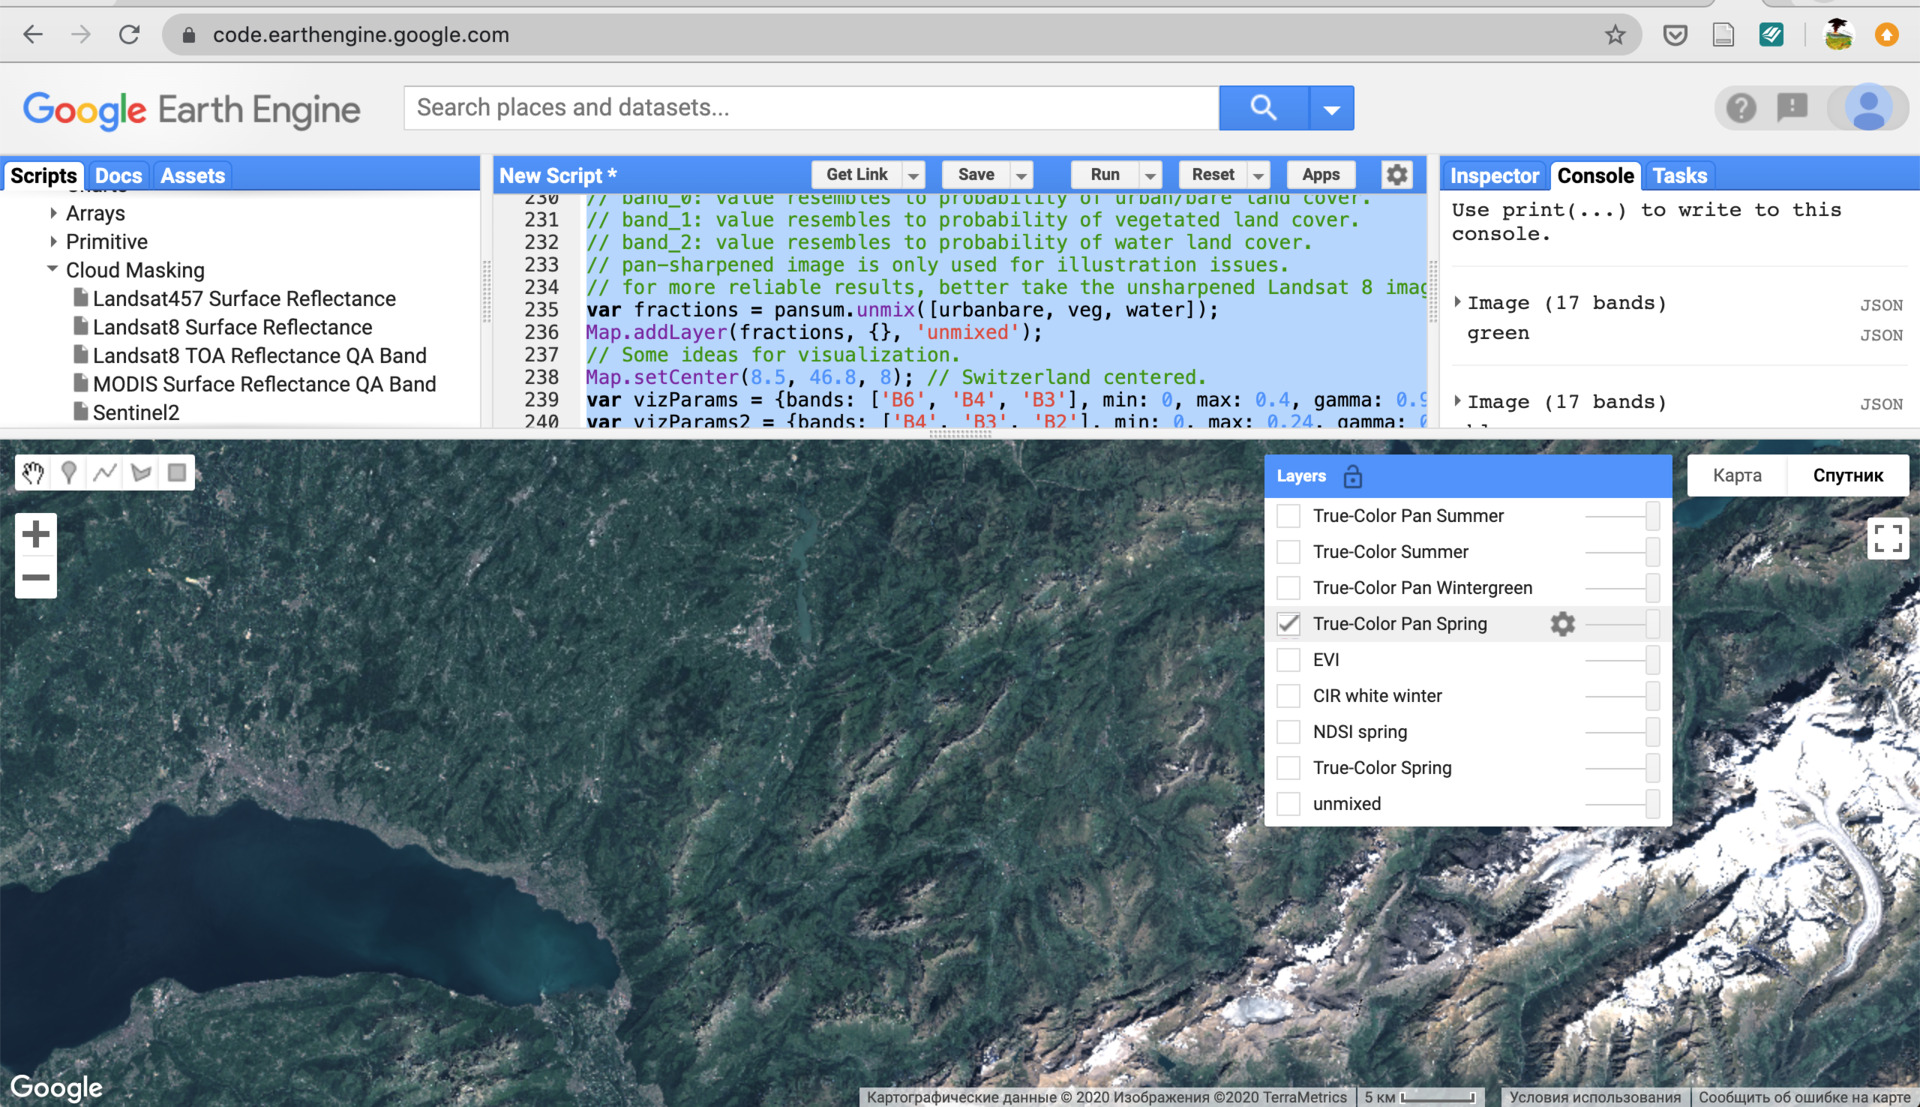
GEE is great and free of charge spatial processin engine which allows to process millions of available satellite images (Landsat 7/8, Sentinel 2 and much more) in minutes. We use GEE to produce high-quality satellite images and amplitude radar images (SAR) composites and extract DEM and so on. See also our project repositories for GEE scripts.
For our science and industrial data processing we often need thousands of processing cores and Amazon cloud engine (AWS) is the great choice for us. This AWS init script allows to create simultaniously cluster of Amazon EC2 instances with pre-configured Dask processing cluster and installled as geospatial and science processing libraries as PostgreSQL/PostGIS database engine.
