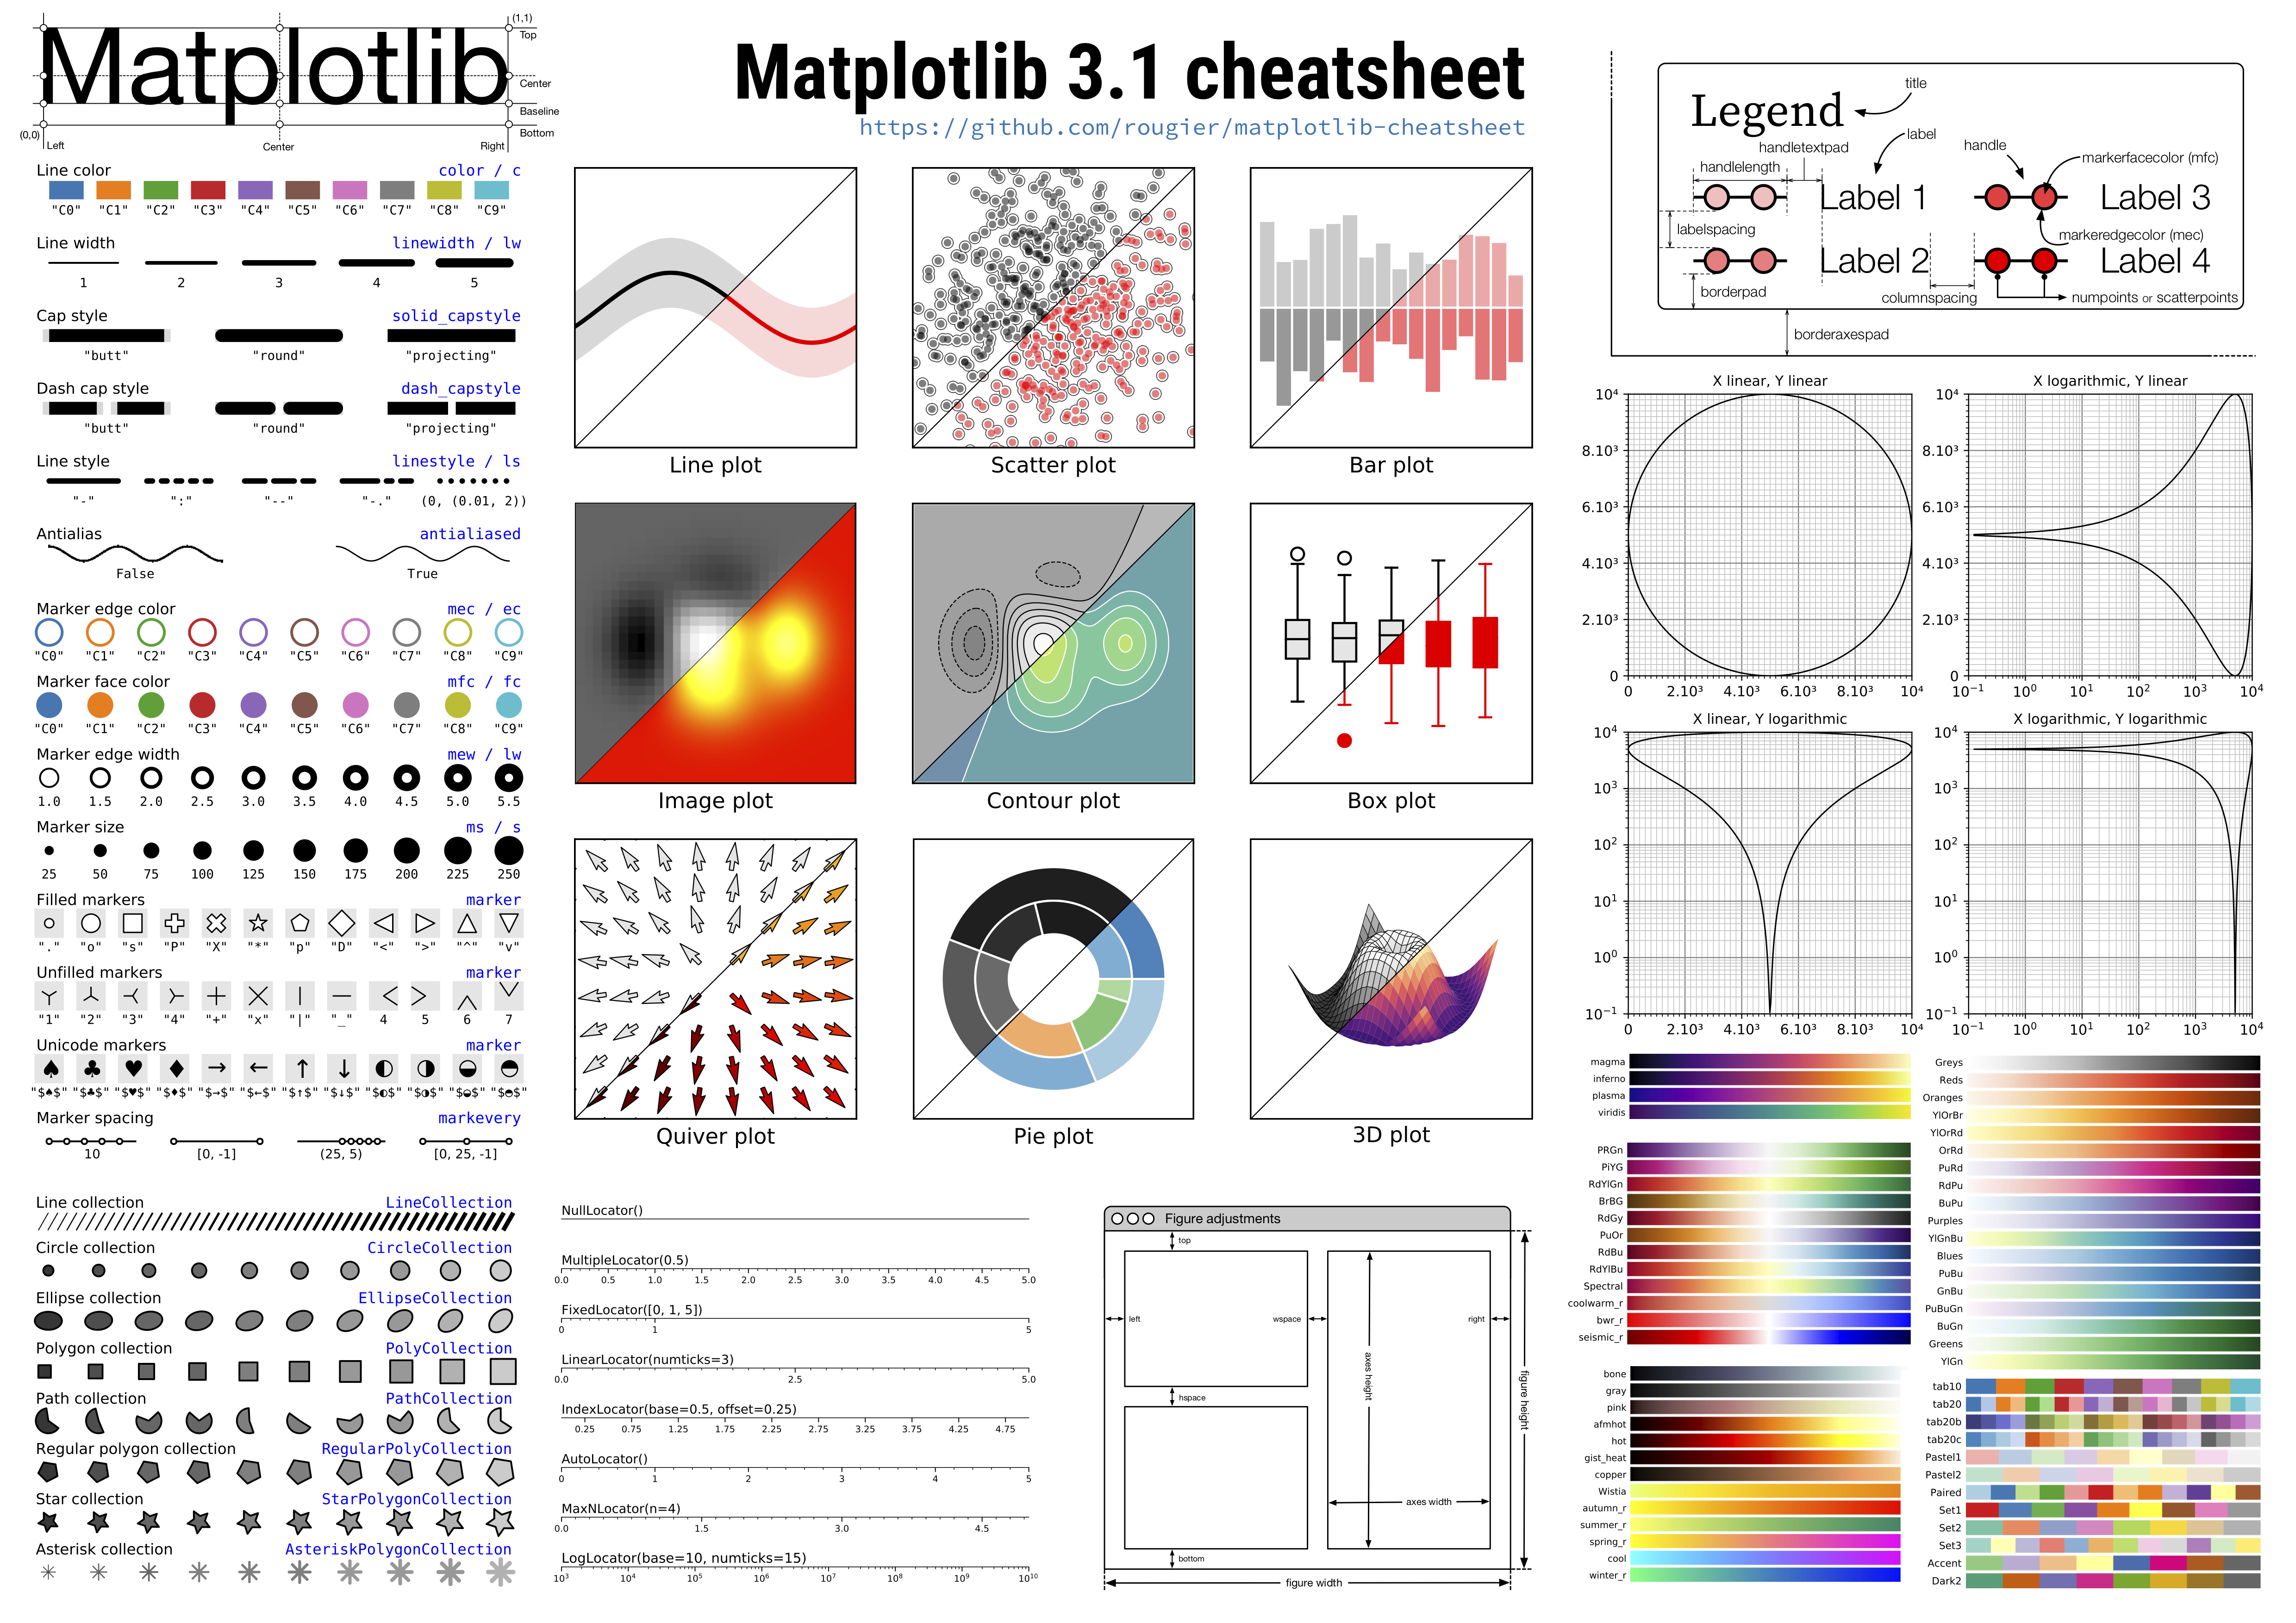
This cheat sheet is part of an upcoming open access book on scientific visualization (using python and matplotlib) to be released during summer 2020 (hopefully). Sources will be available at the end of the writing, the PDF book will be open-access and the printed book will cost 50$. You can read more and support the project at https://github.com/rougier/scientific-visualization-book.
