Compensation & Gating Routines for Analysis of Flow Cytometry Data.
cytoSuite can be installed from Github.
library(devtools)
install_github("DillonHammill/cytoSuite")
library(cytoSuite)
# Here we will use the Activation samples included in cytoSuite and assign them to object called fs
data(Activation, package = "cytoSuite")
fs <- Activation
# pData entries will be used later to construct gates using specific samples
pData(fs)$Samples <- c("Activated","Control")

# Marker names can be used for gating and will be included in plot outputs - see ?Activation for details
# To get a list of fluorescent channels use getChannels()
fluor <- getChannels(fs)
chnls <- c("Alexa Fluor 405-A","Alexa Fluor 430-A","APC-Cy7-A", "PE-A", "Alexa Fluor 488-A", "Alexa Fluor 700-A", "Alexa Fluor 647-A", "7-AAD-A")
markers <- c("Hoechst-405", "Hoechst-430", "CD11c", "Va2", "CD8", "CD4", "CD44", "CD69")
names(markers) <- chnls
markernames(fs) <- markers
gs <- GatingSet(fs)
# Use spillover matrix attached to samples
spill <- fs[[1]]@description$SPILL
gs <- compensate(gs, spill)

# Refer to ?computeSpillover and ?editSpillover to modify spillover matrix
trans <- estimateLogicle(gs[[1]], fluor)
gs <- transform(gs, trans)
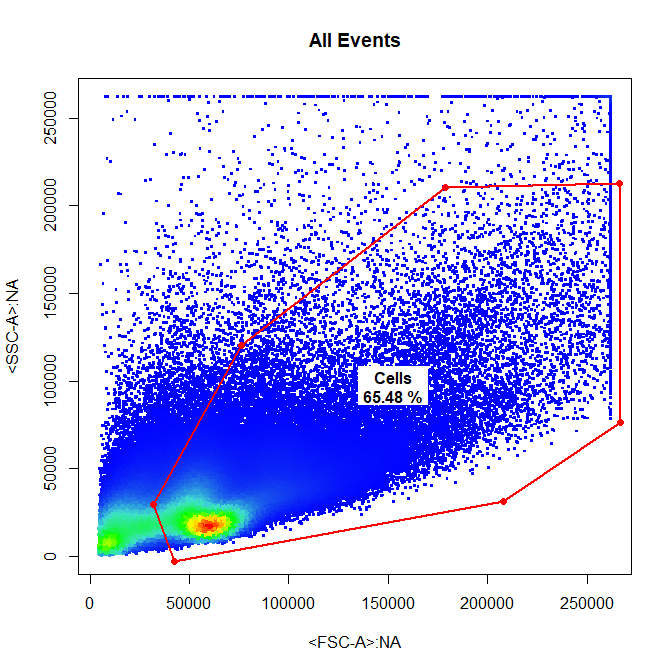
drawGate is a convenient wrapper for the gating functions in cytoSuite which constructs drawn gates, applies the gate(s) directly to the and saves the gate(s) to the csv file for future use.
# Cells
drawGate(gs,
         parent = "root",
         alias = "Cells",
         channels = c("FSC-A","SSC-A"),
         gate_type = "polygon",
         gtfile = "Example gatingTemplate.csv")
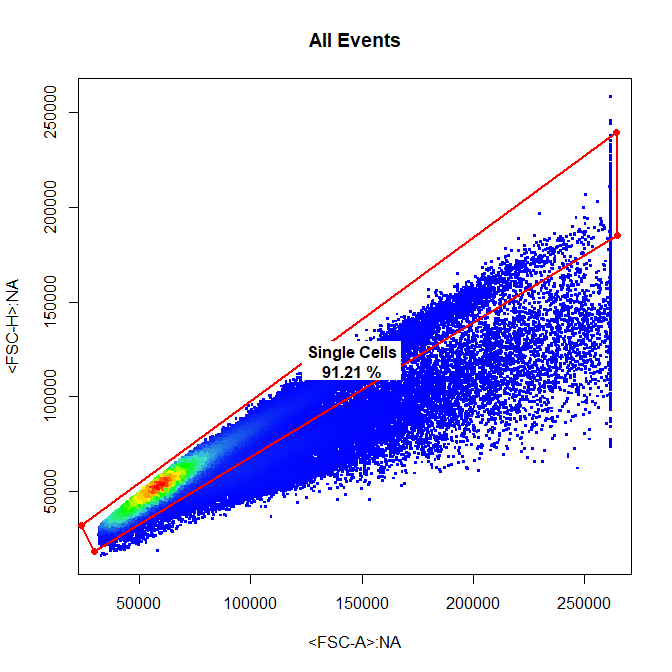
# Single Cells
drawGate(gs,
         parent = "Cells",
         alias = "Single Cells",
         channels = c("FSC-A","FSC-H"),
         gate_type = "polygon",
         gtfile = "Example gatingTemplate.csv")
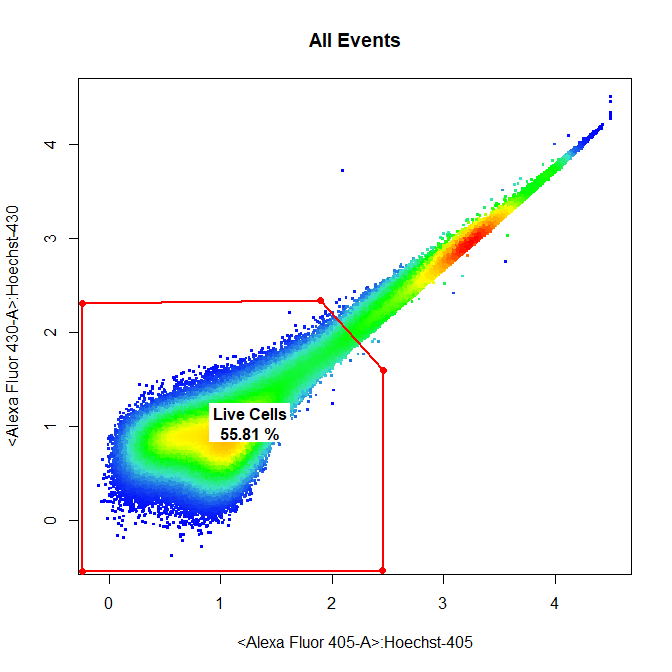
# Live Cells
drawGate(gs,
         parent = "Single Cells",
         alias = "Live Cells",
         channels = c("Alexa Fluor 405-A","Alexa Fluor 430-A"),
         gate_type = "polygon",
         gtfile = "Example gatingTemplate.csv")
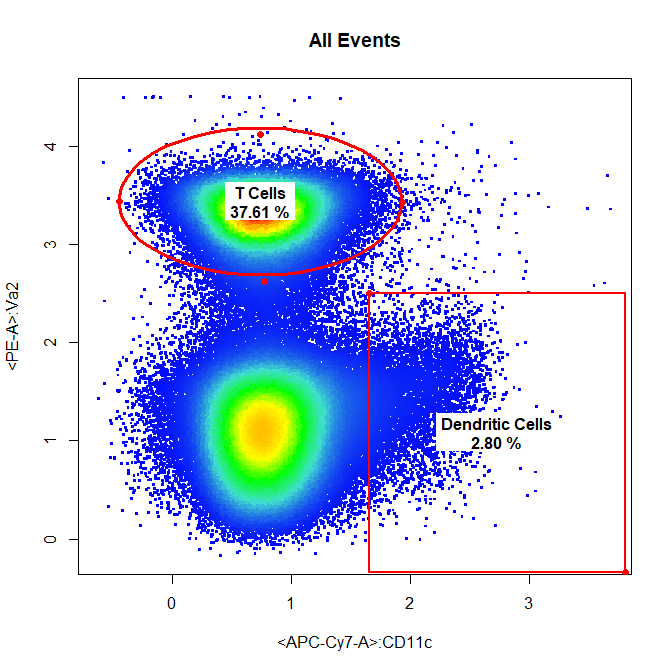
# Dendritic Cells & T cells
drawGate(gs,
         parent = "Live Cells",
         alias = c("Dendritic Cells", "T Cells"),
         channels = c("APC-Cy7-A","PE-A"),
         gate_type = c("rectangle","ellipse"),
         gtfile = "Example gatingTemplate.csv")
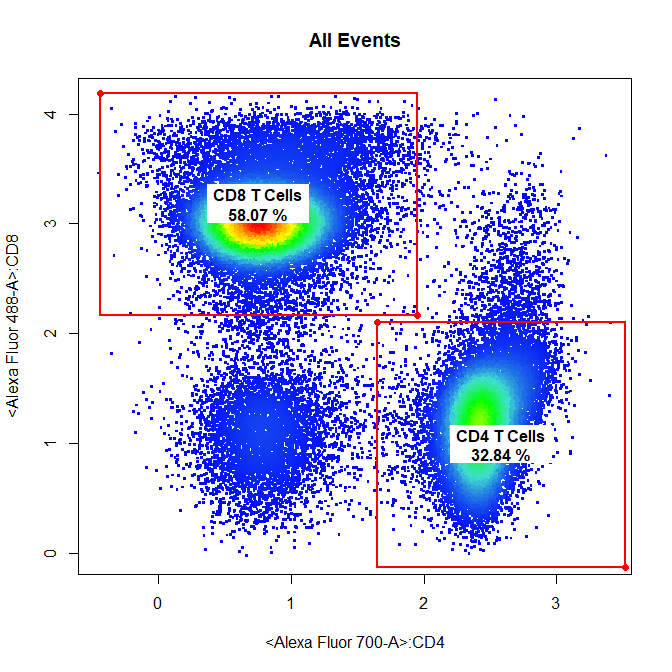
# CD4 & CD8 T Cells
drawGate(gs,
         parent = "T Cells",
         alias = c("CD4 T Cells", "CD8 T Cells"),
         channels = c("Alexa Fluor 700-A","Alexa Fluor 488-A"),
         gate_type = "rectangle",
         gtfile = "Example gatingTemplate.csv")
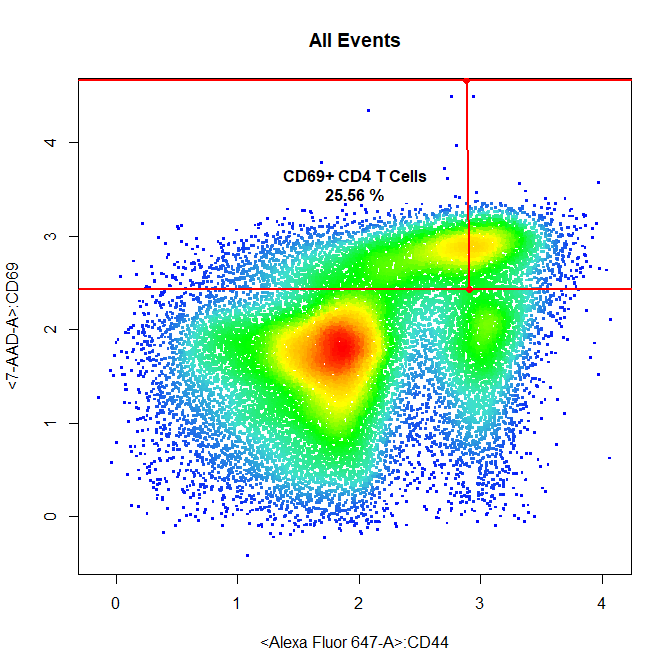
# CD69+ CD4 T Cells
drawGate(gs,
         parent = "CD4 T Cells",
         alias = c("CD69+ CD4 T Cells"),
         channels = c("Alexa Fluor 647-A","7-AAD-A"),
         gate_type = "interval",
         axis = "y",
         gtfile = "Example gatingTemplate.csv")
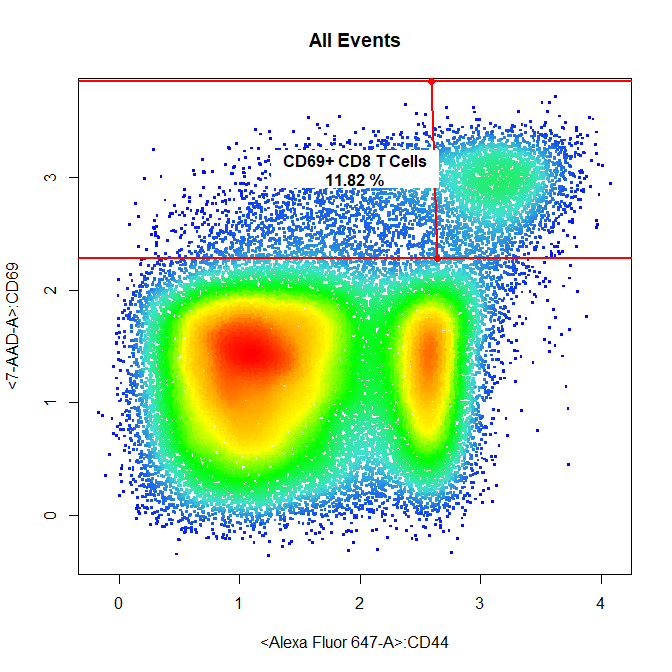
# CD69+ CD8 T Cells
drawGate(gs,
         parent = "CD8 T Cells",
         alias = c("CD69+ CD8 T Cells"),
         channels = c("Alexa Fluor 647-A","7-AAD-A"),
         gate_type = "interval",
         axis = "y",
         gtfile = "Example gatingTemplate.csv")
# Add samples to GatingSet, apply compensation, transform channels and apply gates
gs <- GatingSet(fs)

## ..done!

gs <- compensate(gs, spill)
gs <- transform(gs, trans)

# Apply saved gates
gt <- gatingTemplate("Example gatingTemplate.csv")

## Adding population:Cells
## Adding population:Single Cells
## Adding population:Live Cells
## Adding population:Dendritic Cells
## Adding population:T Cells
## Adding population:CD4 T Cells
## Adding population:CD8 T Cells
## Adding population:CD69+ CD4 T Cells
## Adding population:CD69+ CD8 T Cells

gating(gt, gs)

## Loading required package: parallel
## Gating for 'Cells'
## done.
## Gating for 'Single Cells'
## done.
## Gating for 'Live Cells'
## done.
## Gating for 'T Cells'
## done.
## Gating for 'CD8 T Cells'
## done.
## Gating for 'CD69+ CD8 T Cells'
## done.
## Gating for 'CD4 T Cells'
## done.
## Gating for 'CD69+ CD4 T Cells'
## done.
## Gating for 'Dendritic Cells'
## done.
## finished.

# Check gates have been applied
getNodes(gs)

##  [1] "root"
##  [2] "/Cells"
##  [3] "/Cells/Single Cells"
##  [4] "/Cells/Single Cells/Live Cells"
##  [5] "/Cells/Single Cells/Live Cells/T Cells"
##  [6] "/Cells/Single Cells/Live Cells/T Cells/CD8 T Cells"
##  [7] "/Cells/Single Cells/Live Cells/T Cells/CD8 T Cells/CD69+ CD8 T Cells"
##  [8] "/Cells/Single Cells/Live Cells/T Cells/CD4 T Cells"
##  [9] "/Cells/Single Cells/Live Cells/T Cells/CD4 T Cells/CD69+ CD4 T Cells"
## [10] "/Cells/Single Cells/Live Cells/Dendritic Cells"

plotGate(gs[[1]])
Dillon Hammill, BMedSci (Hons)
Ph.D. Scholar
The Parish
Group Cancer & Vascular Biology
ACRF Department of Cancer Biology
and Therapeutics
The John Curtin School of Medical Research
ANU College of Medicine, Biology and the Environment
The
Australian National University
Acton ACT 2601
Dillon.Hammill@anu.edu.au
