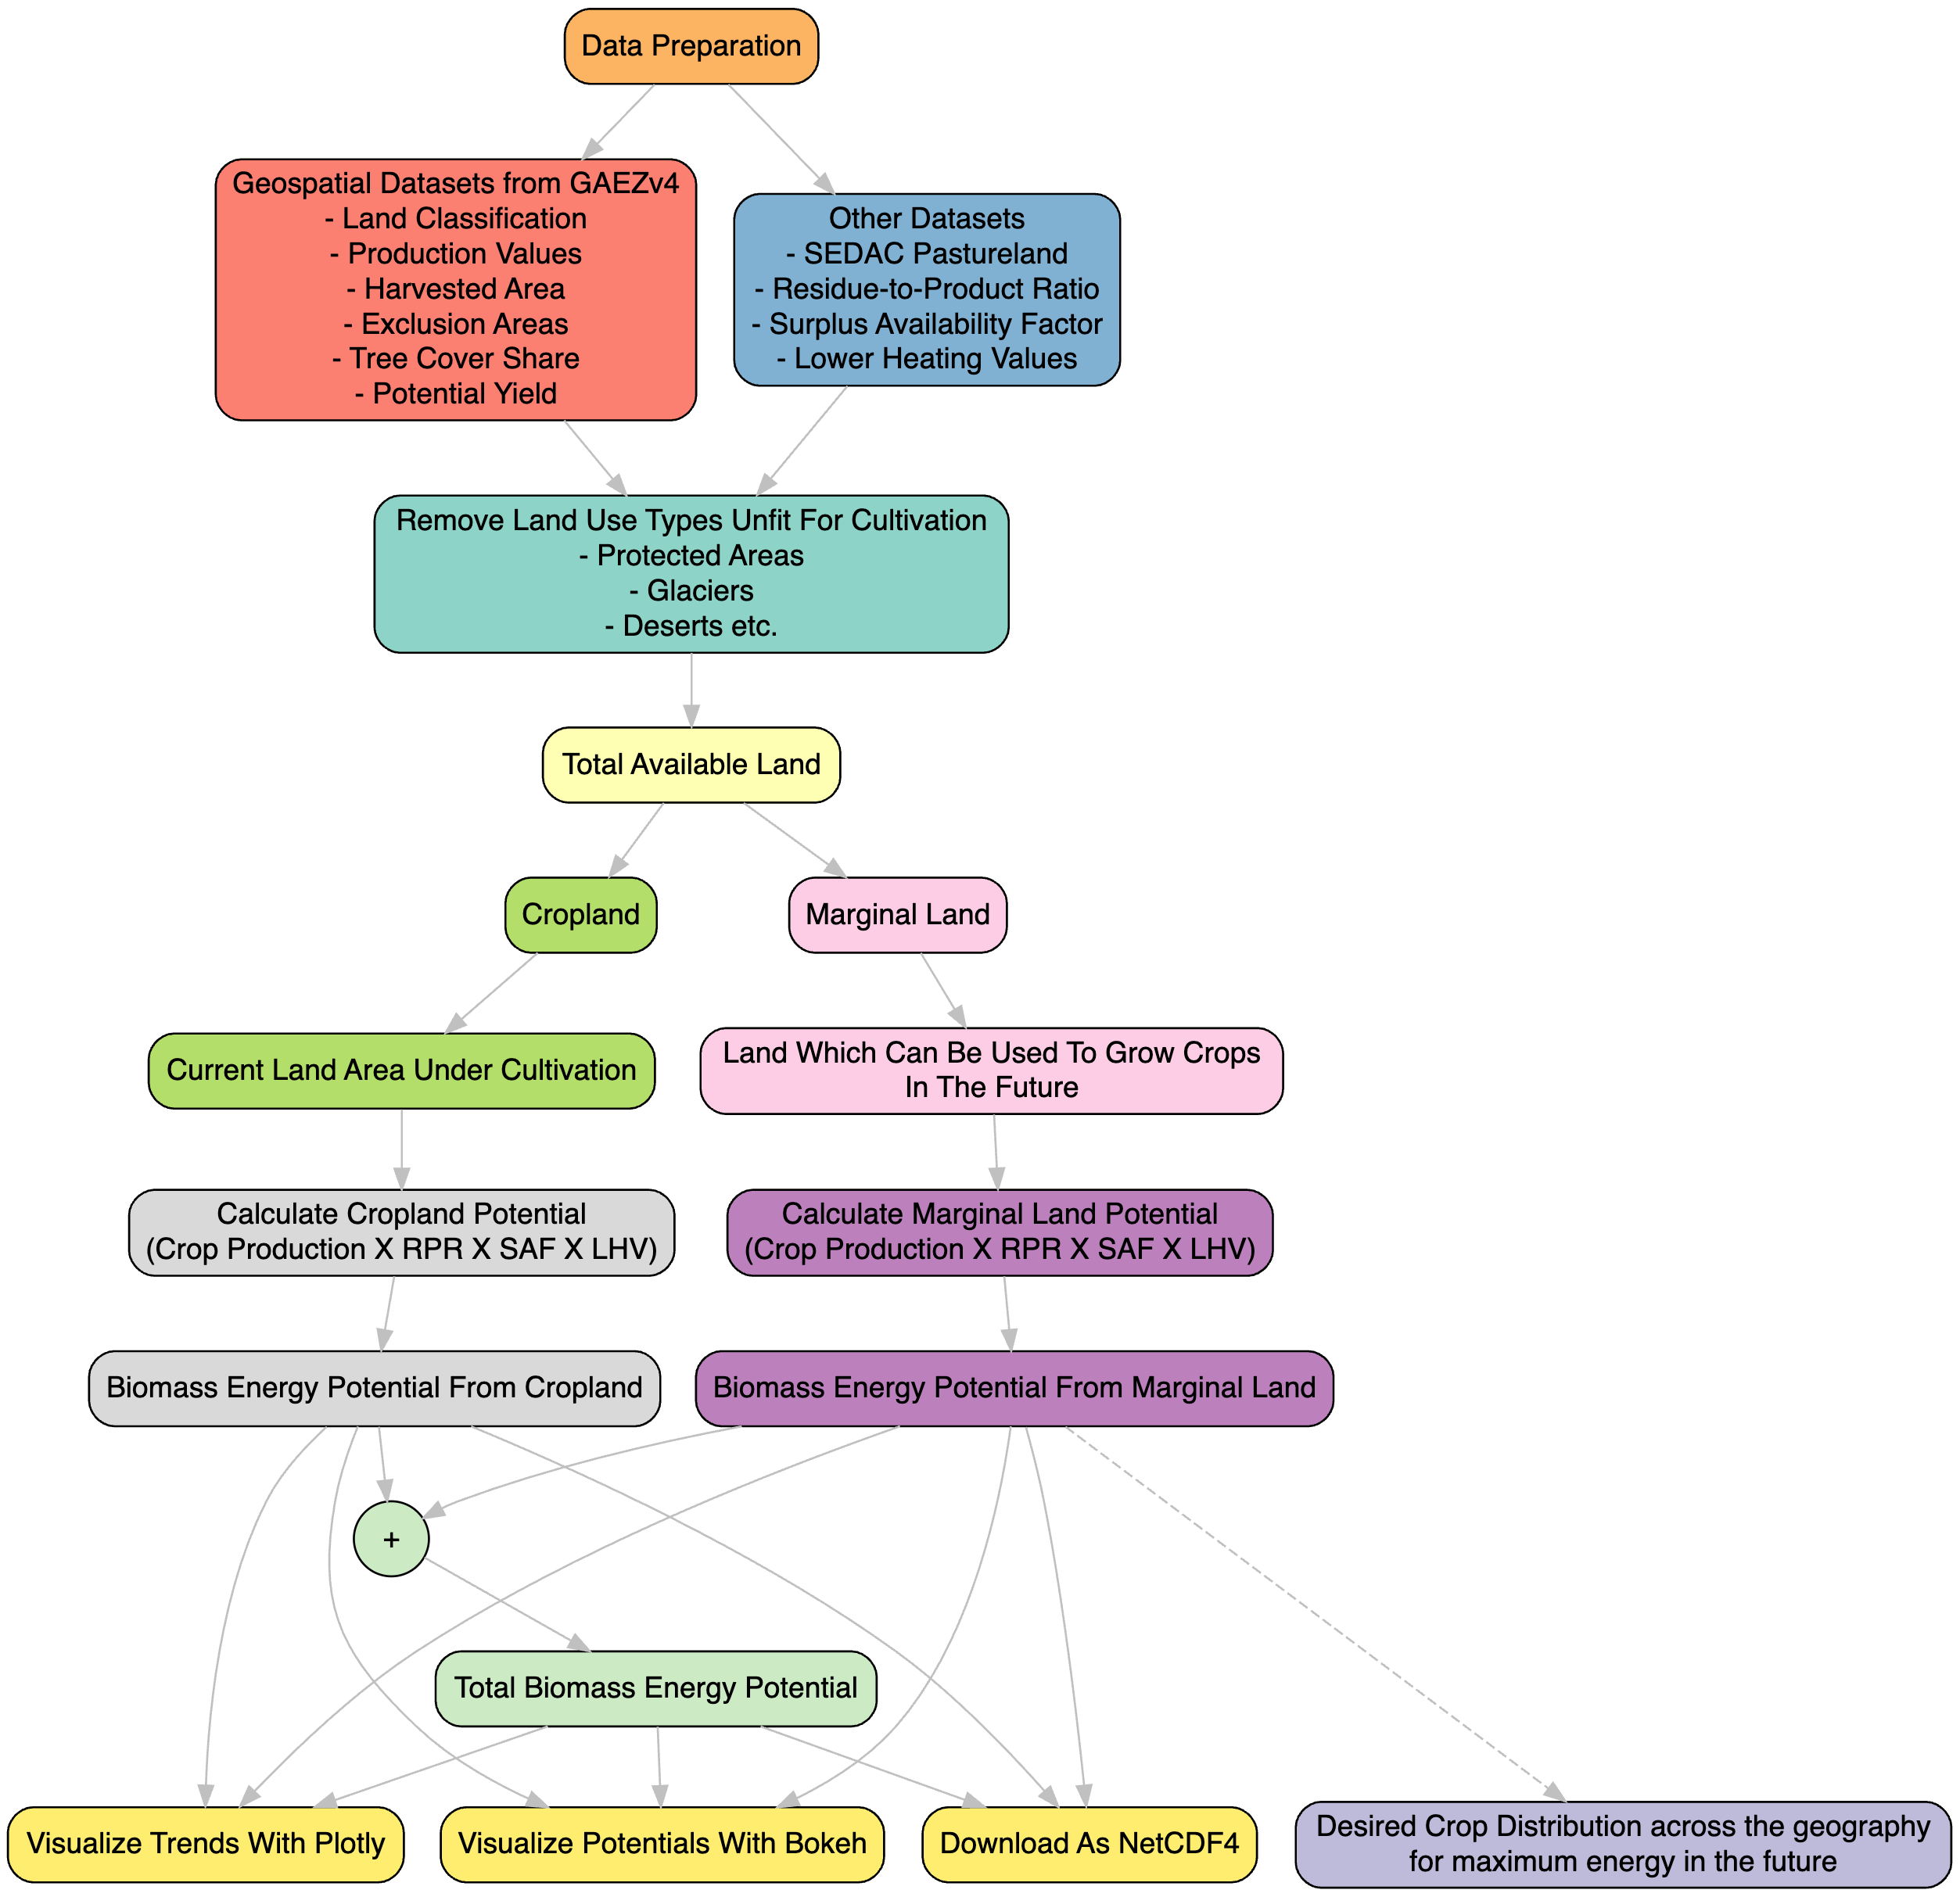
This tool is designed to provide an estimate of the raw biomass energy potential from crop residues in any selected geography. We provide the options to obtain the biomass energy potential using different climate models ,different climate pathways and different time periods (including past and future). This tool aims to help researchers and policy makers make decisions on which crop to grow in any particular region in the future in order to obtain maximum energy from that land. For more details , we suggest you go through the attached documentation once.
Methodology Workflow
To install BEPMAT, follow these steps:
- Clone the repository:
git clone https://github.com/your_username/BEPMAT.git - Navigate to the project directory:
cd BEPMAT - Create a Conda environment:
conda env create -f environment.yml - Activate the Conda environment:
conda activate bepmat - Install any additional dependencies using Conda if necessary:
conda install package_name
We provide a Jupyter notebook named UI.ipynb in the repository, which simplifies the usage of the tool. Additionaly, Examples.ipynb is also present to show what the tool will output. Follow these steps to utilize the tool effectively:
-
Open the Notebook: Navigate to the UI.ipynb file in the repository and open it using Jupyter Notebook or JupyterLab. Please ensure that you have gone through the either the documentation or Functions.ipynb which would help you get a better idea of what the tool does.
-
Execute the Notebook Cells: Run the notebook cells sequentially by clicking on each cell and pressing Shift + Enter or by using the "Run" button in the toolbar.
-
Follow the Instructions: The notebook contains detailed instructions and code blocks to guide you through the process of using the tool. Follow the steps mentioned in the notebook to input your data, configure the analysis settings, and generate the results.
-
View and Download the Results: Once you have executed all the necessary cells, you will see plotly graphs showcasing the results. Below them you will find the the option to download the complete xarrays as NetCDF4 files.
-
Access and Visualise : We also provide another notebook Accessing_and_Visualising.ipynb which shows how you can access and Visualise the downloaded data with ease.
-
Note on Processing Time: Please note that the tool's processing time may vary depending on your processor and the size of the input data. We are actively working to optimize performance and reduce processing times.
-
Feedback and Support: If you encounter any issues or have suggestions for improvement, please don't hesitate to reach out to us. Your feedback is valuable in enhancing the tool's functionality and usability.
We welcome contributions from the community! If you'd like to contribute to this project, please follow these steps:
- Fork this repository.
- Create a new branch for your feature or bug fix.
- Make your changes and commit them.
- Push your changes to your forked repository.
- Submit a pull request detailing your changes.
This project is licensed under the MIT License - see the LICENSE file for details.
For questions or support, please contact singhaldivyansh83@gmail.com.
