Software for quadruple immunofluorescence analysis developed at the Wellcome Centre for Mitochondrial Research, Newcastle, UK by John Grady, with contributions from Amy Vincent.
The latest version is v3.6: source code is here.
This Quadruple Immuno Analyser cell segmentation software was first published by Ahmed et al. (2017). The statistical analysis and use of z-scores was first published by Rocha et al. (2015).
Capture raw microscopy data, following the method presented by Ahmed et al. (2017) and stitch images in ZEN. Install Quadruple Immuno Analyser image analysis software and use it to analyse raw microscopy image data. Image analysis results in a merged.csv file of all the data. This file can be uploaded to immuno interactive statistical analysis website.
Quadruple Immuno Analyser requires Matlab version 2015a to run.
- Before you start images should be named [Sample name] OXPHOS or [Sample name] NPC and placed in the same folder.
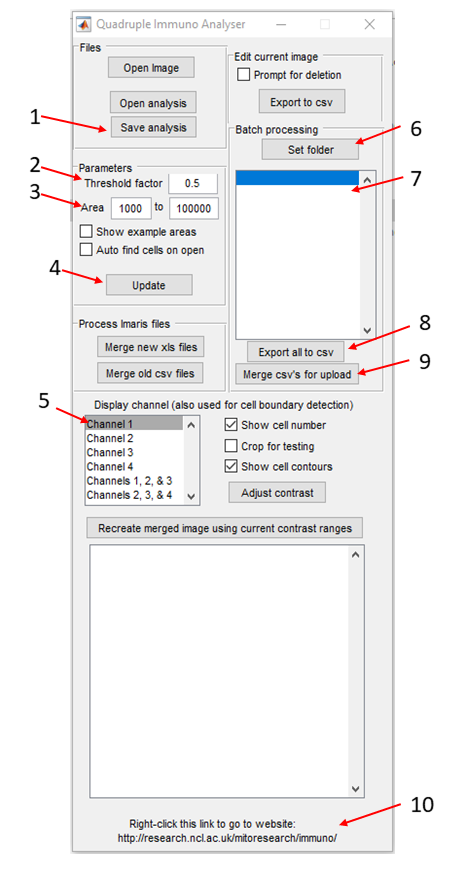
- When opened Quadruple Immuno Analyser will appear as a small window. Under batch processing in the top right hand corner click set folder (Quadruple Immuno Analyser window no.6) and navigate to the folder containing the images and select this folder. A pop-up window with ask if you want to scan the images. If this is the start of your analysis select yes. If you are reopening previous analysis select no. Scanning on images may take a few hours depending on their size and the number of files.
- Once scanning has finished the first image will open. Select the channel for laminin only (Quadruple Immuno Analyser window no.5).
- The parameters section can be used to adjust the segmentation parameters. Area (Quadruple Immuno Analyser window no.3) is used to set the minimum and maximum area of a cell to be included and threshold (Quadruple Immuno Analyser window no.2) will alter the sensitivity of the automatic segmentation. If you click update (Quadruple Immuno Analyser window no.4) the automatic segmentation will update. Alter the parameters to get the best and most accurate image segmentation.
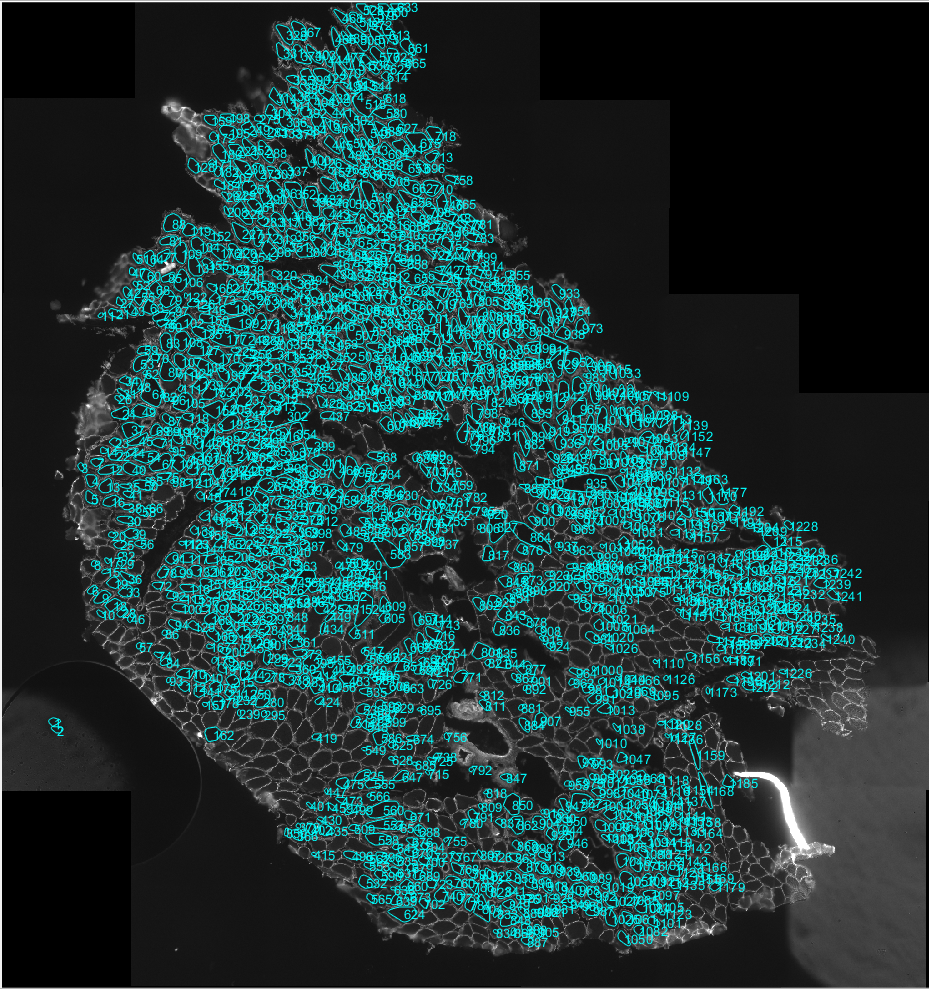
- Once happy that the best automated segmentation has been achieved. Contours can be added to select a cell that has not been segmented by left clicking and dragging the mouse around the outside of the cell. Similarly unwanted contours can be deleted by right clicking on the contour.
- Only transverse muscle fibres and not longitudinal should be analysed. Take care not to analyse cells or regions with any freezing artefact. Both of these may impact the results of the analysis.
- Once happy with the segmentation click save analysis (Quadruple Immuno Analyser window no.1) at the top of the window and click on the next image. Go through the process of adjusting the parameters for automated segmentation and manual correction for each image (NPC and OXPHOS) and save each image when finished.
- Once all images have been analysed click export to csv (Quadruple Immuno Analyser window no.8) under the list of images. Wait while the software does this and then click merge csv's for upload (Quadruple Immuno Analyser window no.9).
This software is available as an interactive shiny web app at this address
- The merged csv file from Quadruple Immuno Analyser can then be uploaded for statistical analysis at this website.
- Upload file and you will see a preview of the data at the bottom of the screen. Check the website is correctly identifying the labels with the type of image (OXPHOS/NPC), filename and subject ID. Identify the controls in the drop down menu.
- Move to the channels tab at the top. Rename the channels to ensure channel 1 is Laminin, channel 2 MTCOI, channel 3 VDAC and Channel 4 NDUFB8. Tick remove background for MTCOI, VDAC and NDUFB8. Tick remove ordered background for NDUFB8 and normalise for NDUFB8 and MTCOI.
- At the top on the drop down menus select VDAC for normalisation, NDUFB8 for x-axis and MTCOI for y-axis. Colour by VDAC.
- Move to the check data tab. It is recommended that you check that VDAC is normally distributed and that the OXPHOS sections have signal above that of the NPCs for each case however a lot of other graphs can be produced from this tab.
- Once happy that the experiment was successful move to the output tab. Here the respiratory chain profiles can be viewed and downloaded for each sample and an excel file of the analysed data can be downloaded.


