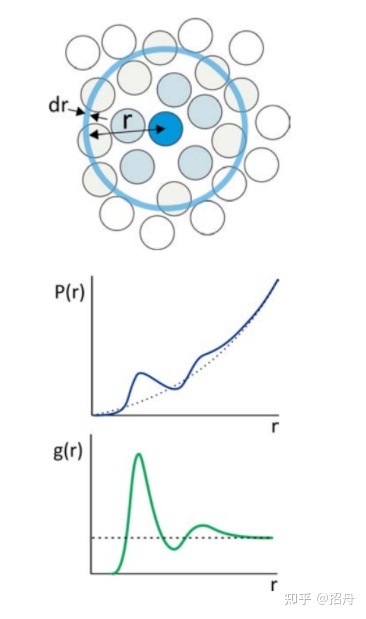
The Core code is in rdf_core.py
The polt.py and plotting.py is used to plot the figure.
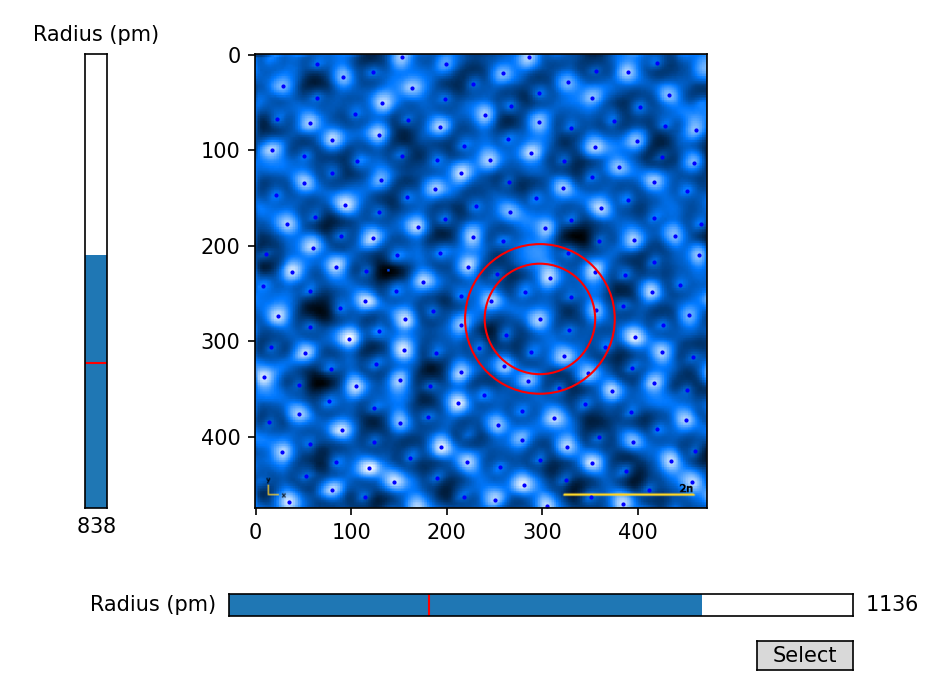
The interactive.py gives you a chance to see what caused a rdf figure. (radius based)
The rdf.py is the main entrance for the program.
Here is the common commands:
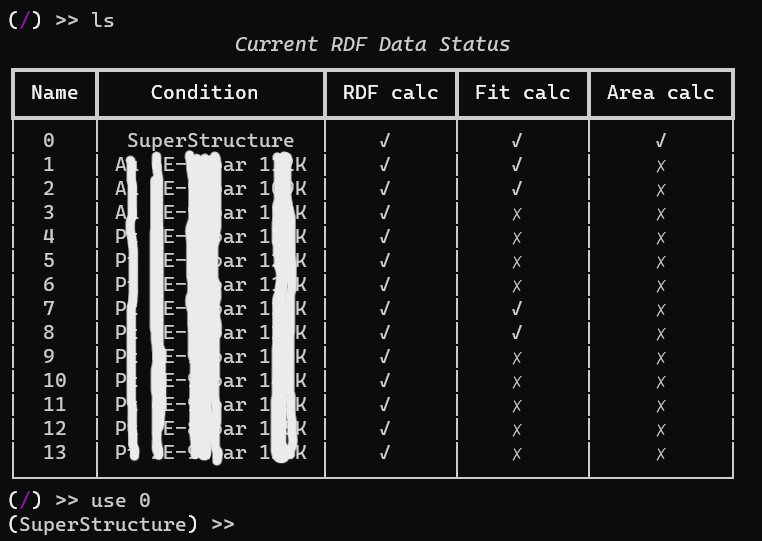
- ls -- list all datas
- rdf -- calc the rdf
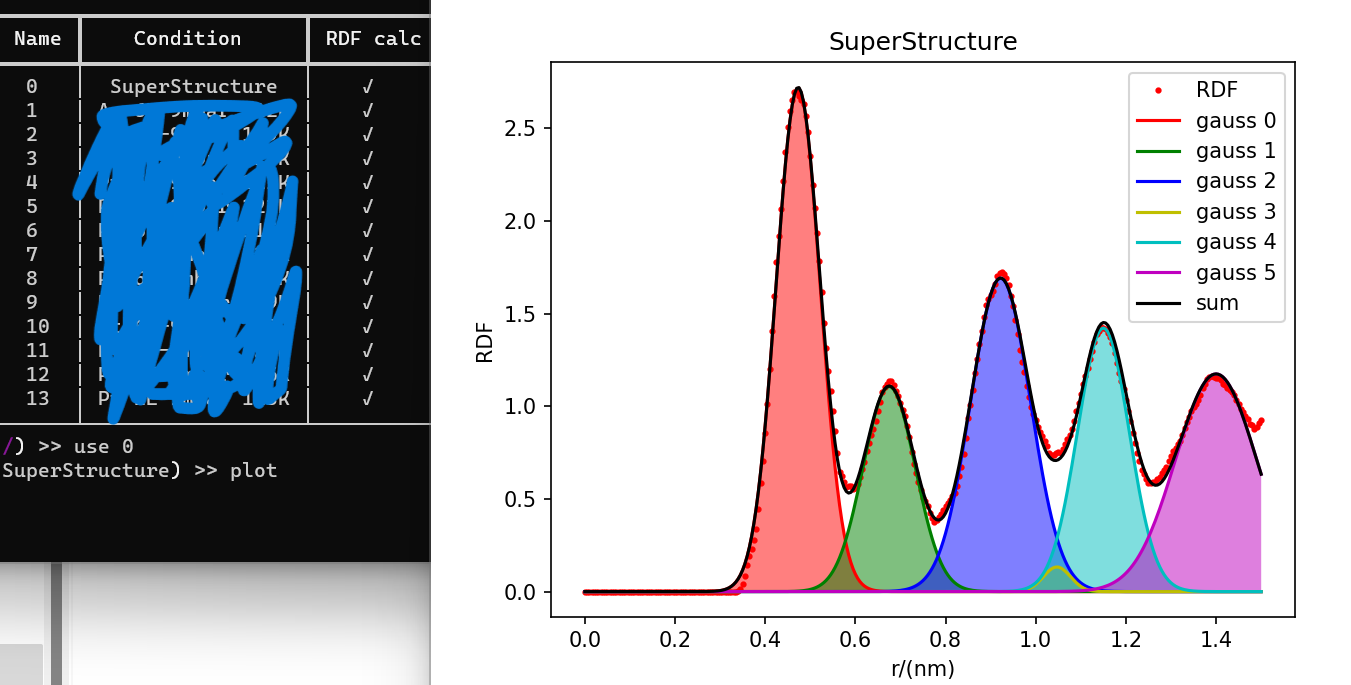
- plot -- plot a certain line
- use {index} -- enter the operation mode of the certain data folder
All data should be organized in a format of labelme (json), a python label tool, and only point mode is used in this program.
All data should be place in different folders under a data folder, and the data folder and the root folder should be defined in the config.json file.
In each data folder, a struct.txt is expected. This file has two columns, the first is the json file name in this folder, and the second column is the real size of the height of the picture.
For example, you have some pictures and you want to get the averaged rdf of them.
-
You install labelme by
pip install labelme, and them open it by input labelme in the terminal. -
You label a picture by labelme using the 'add a point' mode.
-
If this picture in real space is 5mm*6mm (width*height), and in pixel is 250*300, just create a
struct.txtfile in this folder, and input:{pic_name1}.json 6 {pic_name2}.json 4.5 {pic_name3}.json 8 ...... -
Don't forget to config the
config.json, and remember, the program will not make new dirs, you should do this by yourself. -
start the rdf.py, and input
ls, because of the config and the struct.txt, the all data should list on the screen.
- rich
- numpy
- scipy
- matplotlib


