A python library which can help you create stylish table Streamlit app. with this you can:
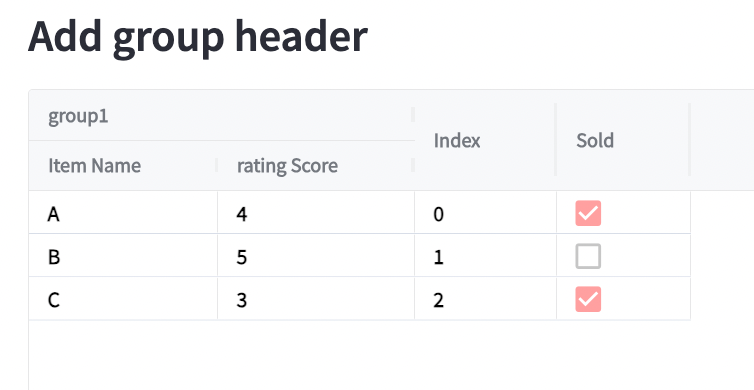
- Create group header,
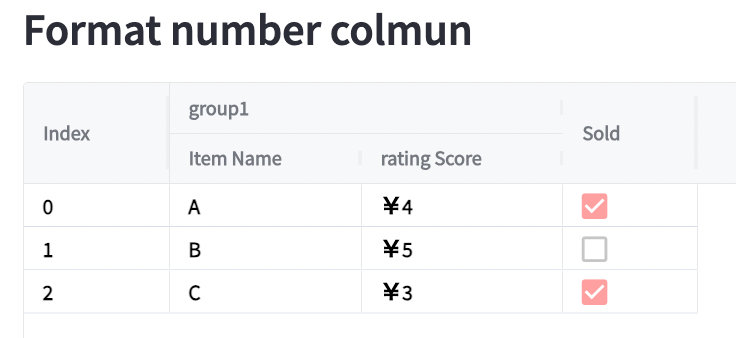
- Format number columns
- Add color grade which related to cells' value.
- Cell styling.
This library is built on streamlit-aggrid (manual): you need to download distribution tar file from here[Box File] Then use following command to install the python package.
pip install rich_table.0.1.0.tar.gzfrom rich_table.rich_table import richTable
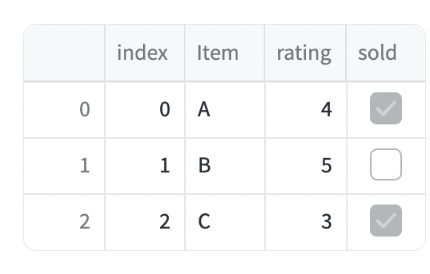
import pandas as pd
df = pd.DataFrame(
[
{"index": 0, "Item": "A", "rating": 4, "sold": True},
{"index": 1, "Item": "B", "rating": 5, "sold": False},
{"index": 2, "Item": "C", "rating": 3, "sold": True},
]
)You can build a group header by using the parameter "header_conf".
Sample code
if __name__ == "__main__":
    header_conf = {'group1':  # Group header's name.
                   [{'field': 'Item',  # Column name for input dataframe.
                     # Column name shows in the table.
                     'headerName': 'Item Name'
                     },
                    {'field': 'rating',  # Column name for input dataframe.
                       # Column name shows in the table.
                       'headerName': 'rating Score'
                     }]}
    rt = richTable(df, header_conf=header_conf)
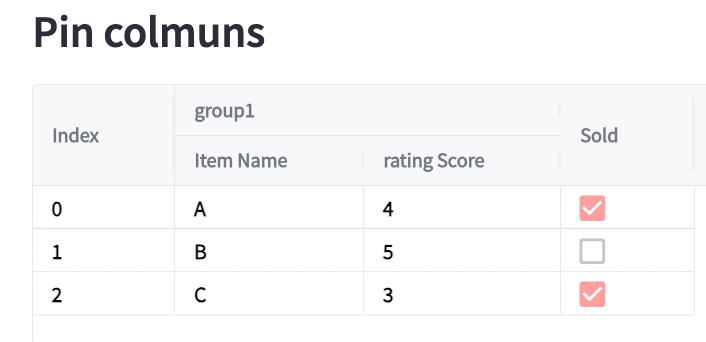
rt.show()You can do this by adding columns to pin_cols parameters Sample code
st.subheader("Pin columns")
# DO NOT ADD NEW CODE BEFORE HERE
header_conf = {'group1':  # Group header's name.
               [{'field': 'Item',  # Column name for input dataframe.
                # Column name shows in the table.
                 'headerName': 'Item Name'
                 },
                {'field': 'rating',  # Column name for input dataframe.
                 # Column name shows in the table.
                 'headerName': 'rating Score',
                 }]}
rt = richTable(df, header_conf=header_conf, pinned_cols=['index'])
rt.show()You can format number by adding formatter field in "header_conf".
Definitions of the 'formatter':
- '%': will reformat the number column to percentage(multiplied by 100 and add '%' to the end) .
- '¥': will add '¥' to the number Column
- '$': will add '$' to the number Column
if __name__ == "__main__":
    header_conf = {'group1':  # Group header's name.
                   [{'field': 'Item',  # Column name for input dataframe.
                     # Column name shows in the table.
                     'headerName': 'Item Name',
                     },
                    {'field': 'rating',  # Column name for input dataframe.
                       # Column name shows in the table.
                       'headerName': 'rating Score',
                       'formatter':'¥'
                     }]}
    rt = richTable(df, header_conf=header_conf)
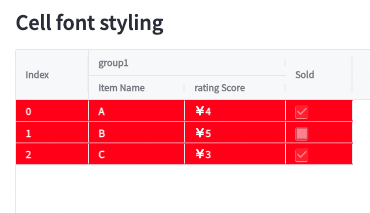
rt.show()Three parameters are provided:
- backgroundColor: Cell's background color.
- fontWeight: Font's weight.
- color: Font's color.
    st.subheader("Cell font styling")
    header_conf = {'group1':  # Group header's name.
                [{'field': 'Item',  # Column name for input dataframe.
                    # Column name shows in the table.
                    'headerName': 'Item Name'
                    },
                    {'field': 'rating',  # Column name for input dataframe.
                    # Column name shows in the table.
                    'headerName': 'rating Score',
                    'formatter': '¥'
                    }]}
    rt = richTable(df, header_conf=header_conf,
                backgroundColor='red',
                fontWeight='bold',
                color='white',
                pinned_cols=['index'])
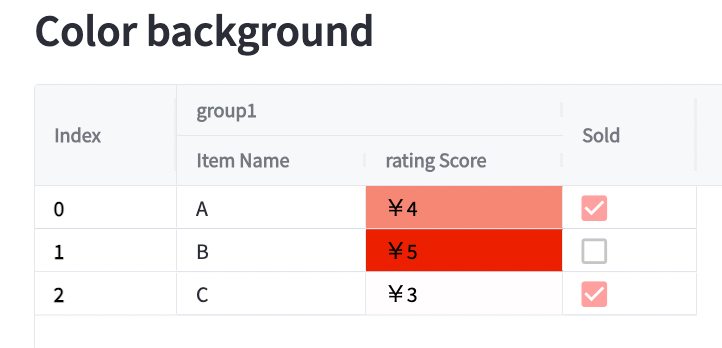
rt.show()You can do this by set with_color to True when call show().
- The default color will be red which will be deeper when value is larger.
- You can also add your color setup by adding color_map_file when you create richTable class.
- Please build your color map file by using this color scale generator
st.subheader("Color background")
header_conf = {'group1':  # Group header's name.
               [{'field': 'Item',  # Column name for input dataframe.
                 # Column name shows in the table.
                 'headerName': 'Item Name'
                 },
                {'field': 'rating',  # Column name for input dataframe.
                   # Column name shows in the table.
                 'headerName': 'rating Score',
                 'formatter': '¥'
                 }]}
rt = richTable(df, header_conf=header_conf, pinned_cols=['index'])
rt.show(with_color=True)python setup.py sdist
