Measuring cortical thickness in the primary visual cortex (V1), focusing on the pericalcarine region, using Freesurfer.
- Ensure Freesurfer is installed and properly configured on your system.
- Have the subject’s T1-weighted MRI scan available for processing.
Open a terminal and set the SUBJECTS_DIR environment variable to point to the directory where Freesurfer will store processing outputs. Replace /path/to/your/freesurfer_subjects_directory with the actual path to your subjects directory.
export SUBJECTS_DIR=/path/to/your/freesurfer_subjects_directoryNavigate to the directory containing the T1-weighted MRI. Start Freesurfer's processing pipeline using recon-all. Replace subjid with your subject's unique identifier, and /path/to/T1.nii with the actual path to the T1-weighted MRI file.
recon-all -s subjid -i /path/to/T1.nii -allThis will take several hours to complete!!!!!!!!!!!! maybe try FastSurfer if you are impatient!
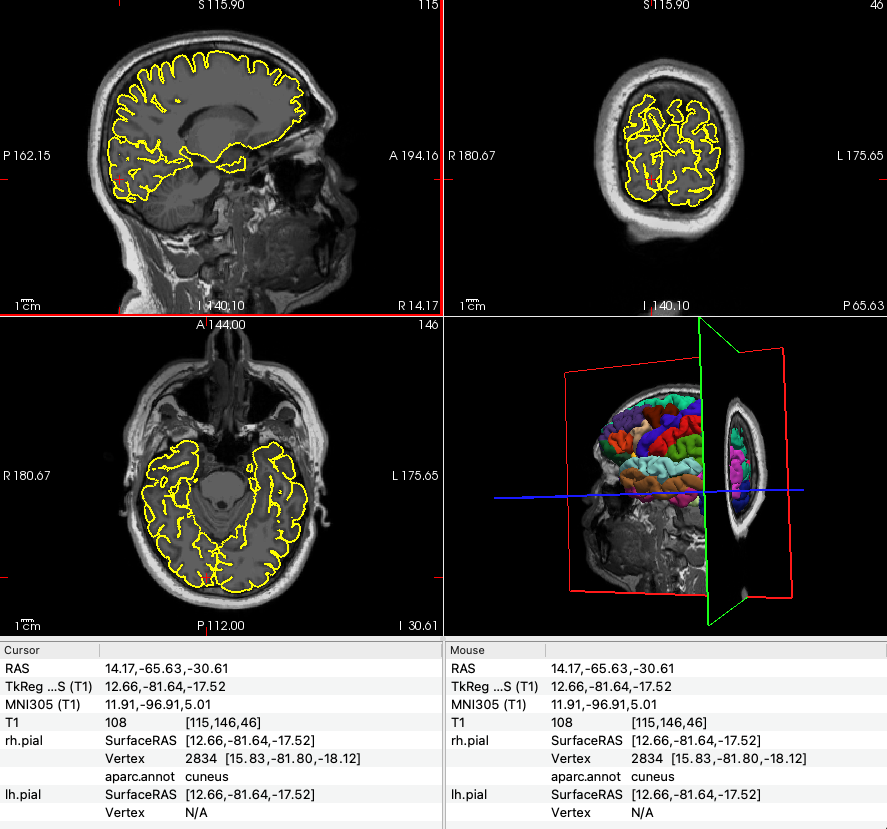
Once recon-all has finished, use freeview to visually inspect the cortical parcellations, including the pericalcarine area.
freeview -v $SUBJECTS_DIR/subjid/mri/T1.mgz \
         -f $SUBJECTS_DIR/subjid/surf/lh.pial:annot=aparc.annot \
         -f $SUBJECTS_DIR/subjid/surf/rh.pial:annot=aparc.annot
Explore the parcellations to familiarise yourself with the anatomical structures.
For the pericalcarine region, use mris_anatomical_stats to extract cortical thickness measurements. Perform this for both hemispheres:
Right hemisphere command:
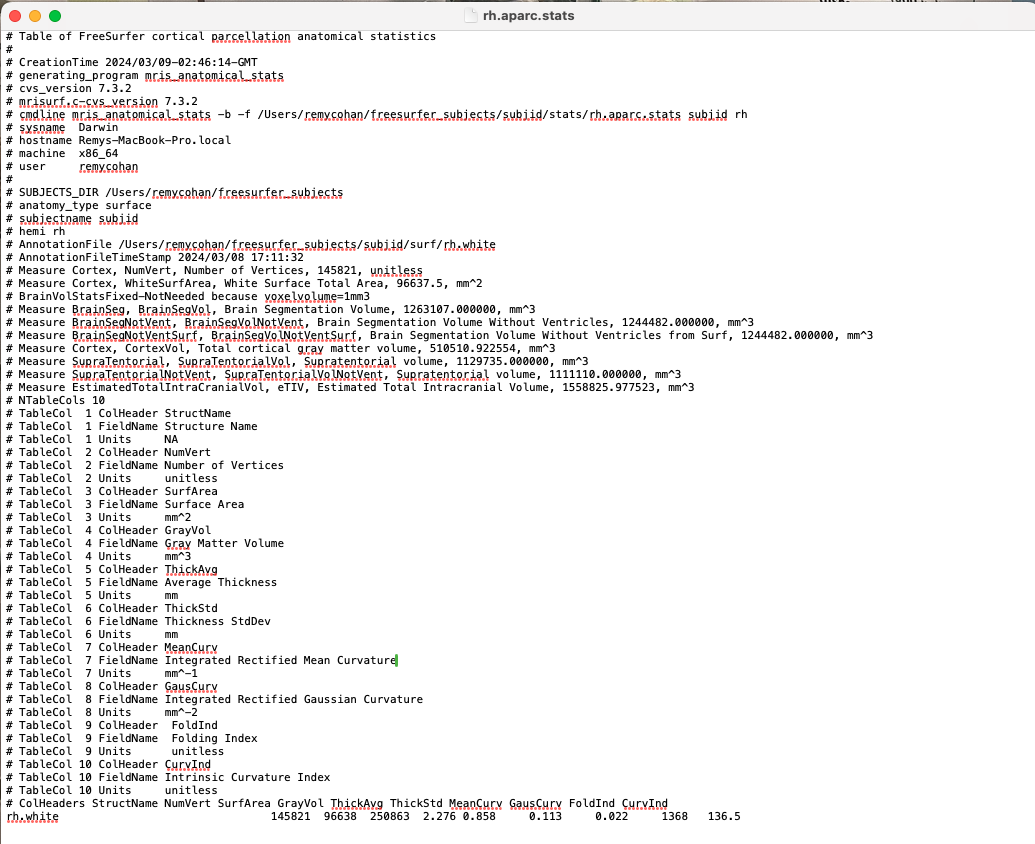
mris_anatomical_stats -b -f $SUBJECTS_DIR/subjid/stats/rh.aparc.stats subjid rhRepeat for the left/right hemisphere by replacing rh with lh.
Open the rh.aparc.stats and lh.aparc.stats files located in $SUBJECTS_DIR/subjid/stats to find detailed measurements. Search for the Pericalcarine entry for cortical thickness metrics.
The Pericalcarine entry provides average cortical thickness, surface area, volume, and other metrics for the primary visual cortex region (not actually, but as a practice assume this is the case). Use these measurements for comparisons or correlations.

