This repository contains a collection of example projects to be used with the newly developed GD32 PlatformIO integration. The examples range from using the new Arduino core, the SPL framework or being baremetal projects.
As these are PlatformIO projects, the PlatformIO documentation at https://docs.platformio.org/ always applies. Especially useful are the Getting started with VSCode + PlatformIO, CLI reference and platformio.ini options pages.
It is assumed that you have either installed VSCode + PlatformIO or PlatformIO on the CLI following the documentation above. As a first step, clone this repository in an arbitrary folder.
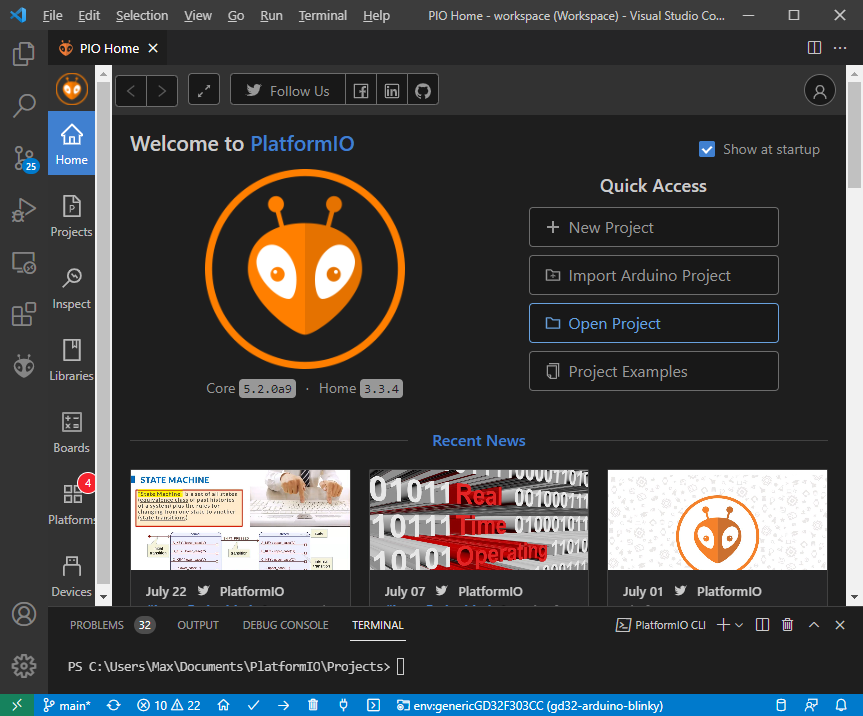
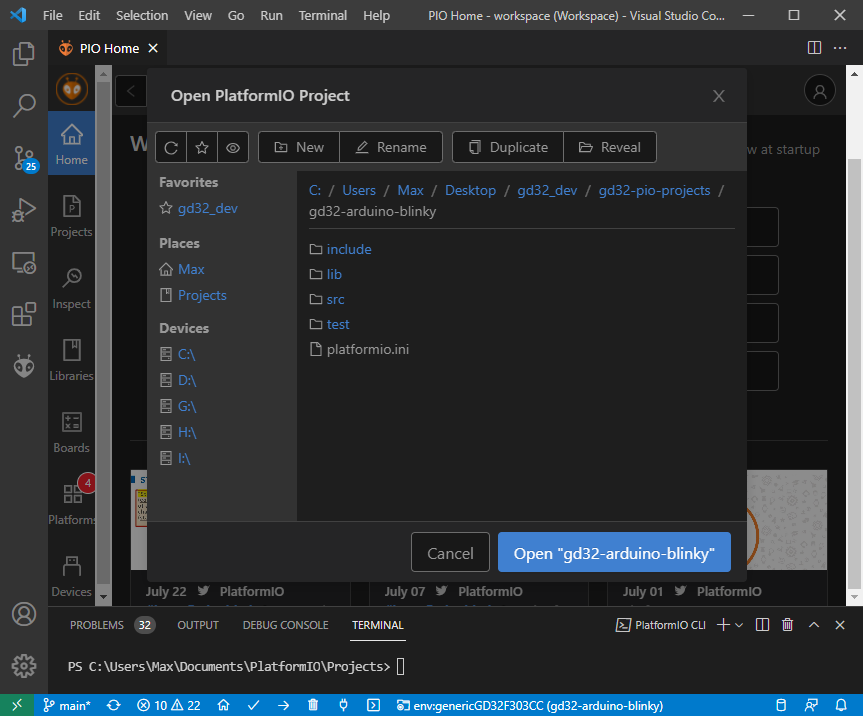
git clone https://github.com/CommunityGD32Cores/gd32-pio-projects/When using VSCode, open the PIO Home screen, e.g. via the toolbar. Use the "Open Project" open to navigate to one of the projects in the repository that you just cloned, e.g., gd32-arduino-blinky.
After opening the project, trust the VSCode workspace in the popup dialog. Your workspace should now contain the new project.
The available boards for an example are listed in the platformio.ini file of the project. For each board, there is an [env:board] section describing the build parameters. Refer to the documentation linked above for detailed information.
For example, the gd32-arduino-blinky project contains
[env]
platform = https://github.com/CommunityGD32Cores/platform-gd32.git
monitor_speed = 115200

[env:gd32f307_mbed]
board = gd32f307_mbed
framework = arduino

[env:gd32f303ze_eval]
board = gd32f303ze_eval
framework = arduino

[env:genericGD32F303CC]
board = genericGD32F303CC
framework = arduino
Thus these 3 boards are available.
The available board values are the boards available in the platform. Note that not every board supports every framework (e.g., Arduino) at the moment, but all e.g. support SPL.
In VSCode, to select a certain board environment (and project), you must use the project environment switcher in the bottom blue taskbar. Make sure your wanted board and project are selected before continuing. After selecting a new environment, the IntelliSense will be reloaded, which might take a bit.
For CLI users, the target environment is given as the -e switch in the pio run command, see documentation.
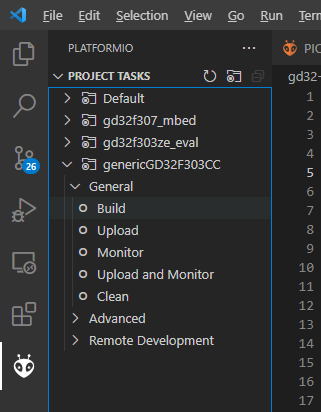
In VSCode, use the project tasks list in the left PIO sidebar as normal to trigger the "Build" action, or a different action, for a certain environment. The environment you have previously selected as your default will be the expanded one.
For CLI users, executue the pio run -e <environment> command, as documentend above.
Compilation should result in a success, e.g.:
> pio run -e genericGD32F303CC
CONFIGURATION: https://docs.platformio.org/page/boards/gd32/genericGD32F303CC.html
PLATFORM: GD GD32 (1.0.0+sha.bbcdaa1) > GD32F303CC (48k RAM. 256k Flash)
HARDWARE: GD32F303CCT6 120MHz, 48KB RAM, 256KB Flash
DEBUG: Current (stlink) External (blackmagic, cmsis-dap,
jlink, stlink)
PACKAGES:
 - framework-arduinogd32 4.20000.210603+sha.c50499f
 - toolchain-gccarmnoneeabi 1.90201.191206 (9.2.1)
LDF: Library Dependency Finder -> http://bit.ly/configure-pio-ldf
LDF Modes: Finder ~ chain, Compatibility ~ soft
Found 9 compatible libraries
Scanning dependencies...
No dependencies
Building in release mode
Compiling .pio\build\genericGD32F303CC\FrameworkArduinoVariant\PeripheralPins.c.o
..
Linking .pio\build\genericGD32F303CC\firmware.elf
Checking size .pio\build\genericGD32F303CC\firmware.elf
Advanced Memory Usage is available via "PlatformIO Home > Project Inspect"
RAM:   [          ]   0.8% (used 412 bytes from 49152 bytes)
Flash: [          ]   3.8% (used 9904 bytes from 262144 bytes)
Building .pio\build\genericGD32F303CC\firmware.bin
================== [SUCCESS] Took 5.01 seconds ==================
Note that the default upload method and available upload method is listed in the board manifest, e.g. for the GD32F303CC board, stlink is the default, attempting to upload via a ST-Link probe connected to the chip via SWD, using OpenOCD as tool. JLink, CMSIS-DAP, BMP, serial and USB-DFU (experimental) upload methods are available as well. To change the upload method, change upload_protocol accordingly. SWD based upload methods can also be used as debug_tool for live-debugging.
For VSCode users, use the project task "Upload".
For CLI users, use pio run -t upload -e <environment> as documented above.
Example of upload:
Configuring upload protocol...
AVAILABLE: blackmagic, cmsis-dap, dfu, jlink, serial, stlink
CURRENT: upload_protocol = stlink
Uploading .pio\build\genericGD32F303CC\firmware.elf
xPack OpenOCD, x86_64 Open On-Chip Debugger 0.11.0-00155-ge392e485e (2021-03-15-16:44)
Licensed under GNU GPL v2
For bug reports, read
        http://openocd.org/doc/doxygen/bugs.html
debug_level: 1

hla_swd
0x2ba01477
target halted due to debug-request, current mode: Thread
xPSR: 0x01000000 pc: 0x08003c0c msp: 0x2000c000
** Programming Started **
Warn : STM32 flash size failed, probe inaccurate - assuming 512k flash
** Programming Finished **
** Verify Started **
** Verified OK **
** Resetting Target **
shutdown command invoked
========= [SUCCESS] Took 4.06 seconds =========
For examples using serial output, you need to connect a USB-UART converter to the board and target UART pin to be able to observe it. In the case of Arduino and the GD32F303CC chip, the default serial is on UART1, TX = PA2, RX = PA3. Note that the UART adapter and the target board should also share a common GND connection.
To access the serial montior in VSCode, execute the "Monitor" project task, as shown above.
To access it from the CLI, execute pio device monitor.
The monitor is aborted by pressing the standard Ctrl+C combination.
Settings like the baud rate or adapter to use (if not auto-detected) are to be found in the monitor section of the platformio.ini.
Example:
> Executing task in folder gd32-arduino-blinky: C:\Users\Max\AppData\Local\Programs\Python\Python38\Scripts\platformio.exe device monitor --environment genericGD32F303CC <

--- Available filters and text transformations: colorize, debug, default, direct, hexlify, log2file, nocontrol, printable, send_on_enter, time
--- More details at http://bit.ly/pio-monitor-filters
--- Miniterm on COM3  115200,8,N,1 ---
--- Quit: Ctrl+C | Menu: Ctrl+T | Help: Ctrl+T followed by Ctrl+H ---
Blinky nr. 0
Blinky nr. 1
Blinky nr. 2
Blinky nr. 3

--- exit ---
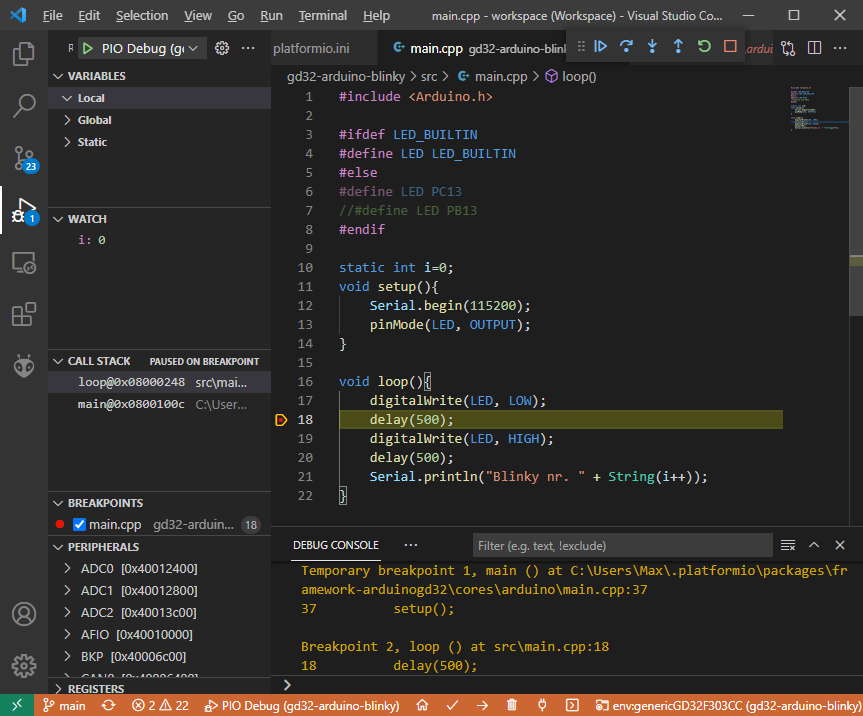
If a SWD capable debug probe is connected to the target, and configured via debug_tool, you can open the "Debug" sidebar in VSCode. In the upper left, the configuration "PIO Debug (your-project-name)" should be selected. By pressing the the "Play" button then, PlatformIO will start compiling the project in debug mode, start the debug server (e.g., OpenOCD) and connect to it with the appropriate GDB client.
It should hit a breakpoint in the main() function of the project (which can e.g. be in the Arduino core). From there, use the regular Step Over, Step Into, Step Out of, etc. buttons for debug control.
VSCode also shows the state of all peripheral registers (such as USART1, ADC0, etc.) and decodes them. The ARM core's internal registers are shown in the expandable "Registers" panel.
Note all the other possible debug configuration options.
The same can be achieved from the CLI, as documented. This launches the user into a GDB session.
>pio debug -e genericGD32F303CC --interface=gdb -x .pioinit
Reading symbols from C:\Users\Max\Desktop\gd32_dev\gd32-pio-projects\gd32-arduino-blinky\.pio\build\genericGD32F303CC\firmware.elf...
PlatformIO Unified Debugger -> http://bit.ly/pio-debug
PlatformIO: debug_tool = stlink
PlatformIO: Initializing remote target...
xPack OpenOCD, x86_64 Open On-Chip Debugger 0.11.0-00155-ge392e485e (2021-03-15-16:44)
Licensed under GNU GPL v2
For bug reports, read
        http://openocd.org/doc/doxygen/bugs.html
hla_swd
0x2ba01477
Info : The selected transport took over low-level target control. The results might differ compared to plain JTAG/SWD
Info : tcl server disabled
Info : telnet server disabled
Info : clock speed 1000 kHz
Info : STLINK V2J29M18 (API v2) VID:PID 0483:374B
Info : Target voltage: 3.250752
Info : stm32f1x.cpu: hardware has 6 breakpoints, 4 watchpoints
Info : starting gdb server for stm32f1x.cpu on pipe
Info : accepting 'gdb' connection from pipe
[...]
Temporary breakpoint 1 at 0x8001004: file C:\Users\Max\.platformio\packages\framework-arduinogd32\cores\arduino\main.cpp, line 37.
PlatformIO: Initialization completed
(gdb) PlatformIO: Resume the execution to `debug_init_break = tbreak main`
PlatformIO: More configuration options -> http://bit.ly/pio-debug
Continuing.
Note: automatically using hardware breakpoints for read-only addresses.

Temporary breakpoint 1, main ()
    at C:\Users\Max\.platformio\packages\framework-arduinogd32\cores\arduino\main.cpp:37
37          setup();
(gdb) backtrace
#0  main ()
    at C:\Users\Max\.platformio\packages\framework-arduinogd32\cores\arduino\main.cpp:37


