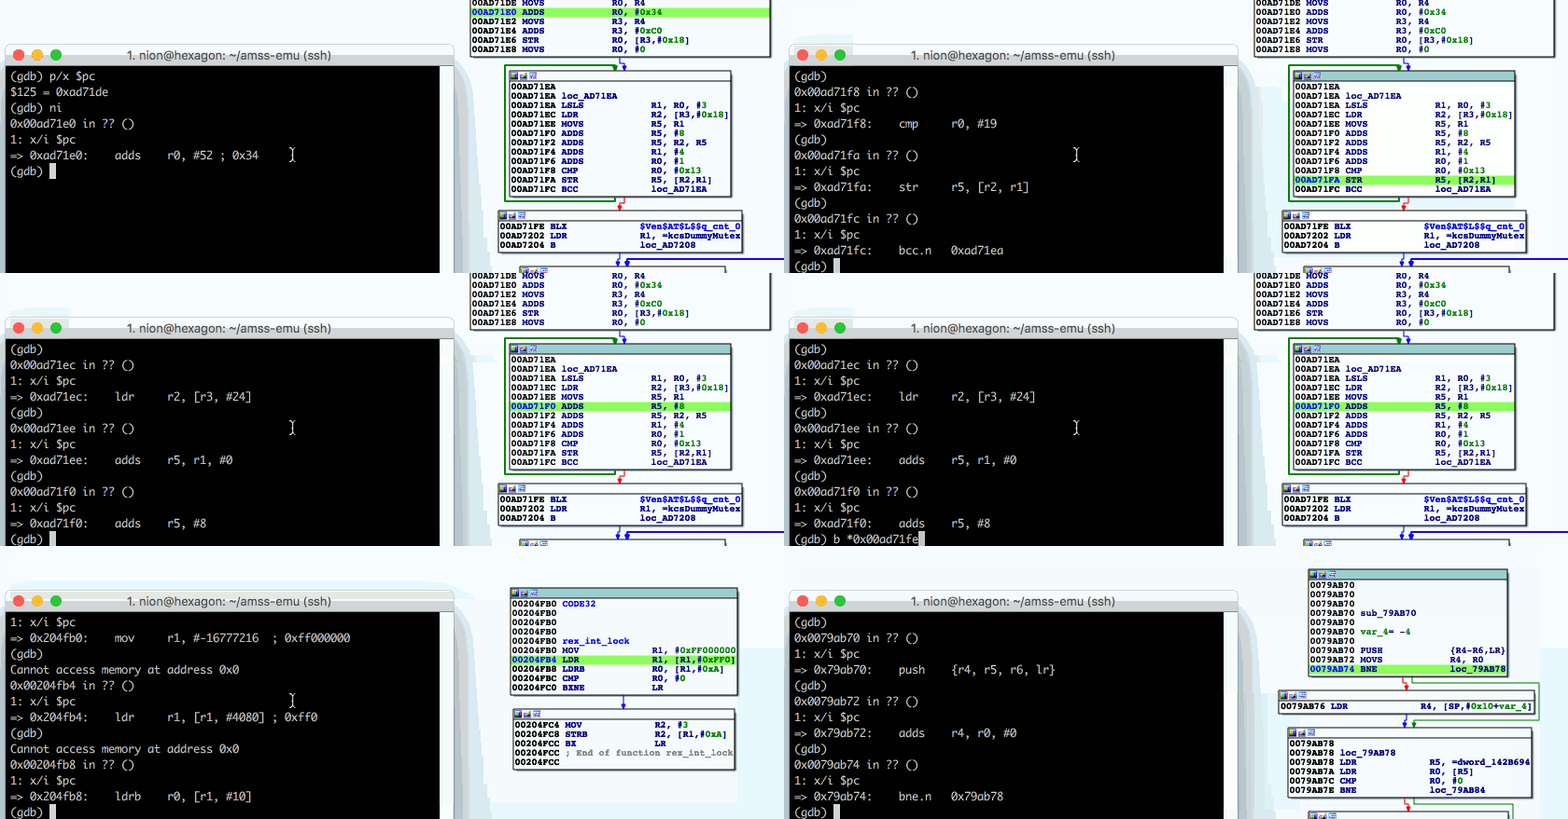
The purpose of gdbida is to provide means during interactive debug sessions in gdb to quickly follow the flow in IDA. gdbida is not meant to be a full debugger or replace IDA's own debugger. Instead, it merely serves as a small helper tool to assist during interactive debug sessions that make use of a mixture of tools. It provides simple means to quickly follow along a gdb debug session in IDA. gdbida was originally meant to be used with gdb. However, e.g. extending support to Windbg using pykd should be straight-forward.
gdbida consists of the following two parts:
- ida_gdb_bridge.py : main IDA Pro plugin
- gdb_ida_bridge_client.py : gdb python script
Make a change the ~/.gdbinit configuration file to include the plugin:
source ~/gdb_ida_bridge_client.py
Copy the IDA plugin to your plugins directory, e.g.:
cp gdb_ida_bridge_client.py /Applications/IDA\ Pro\ 6.95/idaq.app/Contents/MacOS/plugins/
Execute the plugin from IDA and specify a listener address and port. Next, configure the gdb stub to connect to gdbida's IDA port (either command line or gdbinit):
idabridge 10.0.10.10:2305
For debugging a PIE ELF binary,which is still relocated by the kernel, use the following to translate text addresses at runtime:
idabridge 10.0.10.10:2305 reloc_text
Please be aware that this is not considered to be finished. Specifically, the following thoughts are on my mind:
- Network listening input masks untested for errors.
- Individual TCP connections for 4 bytes payload are not ideal from a performance pov.
- The network connection is not authenticated in any way.
- A lot of potential for additional commands. For now, I kept it super simple.
- Color cleanup on exit is untested
