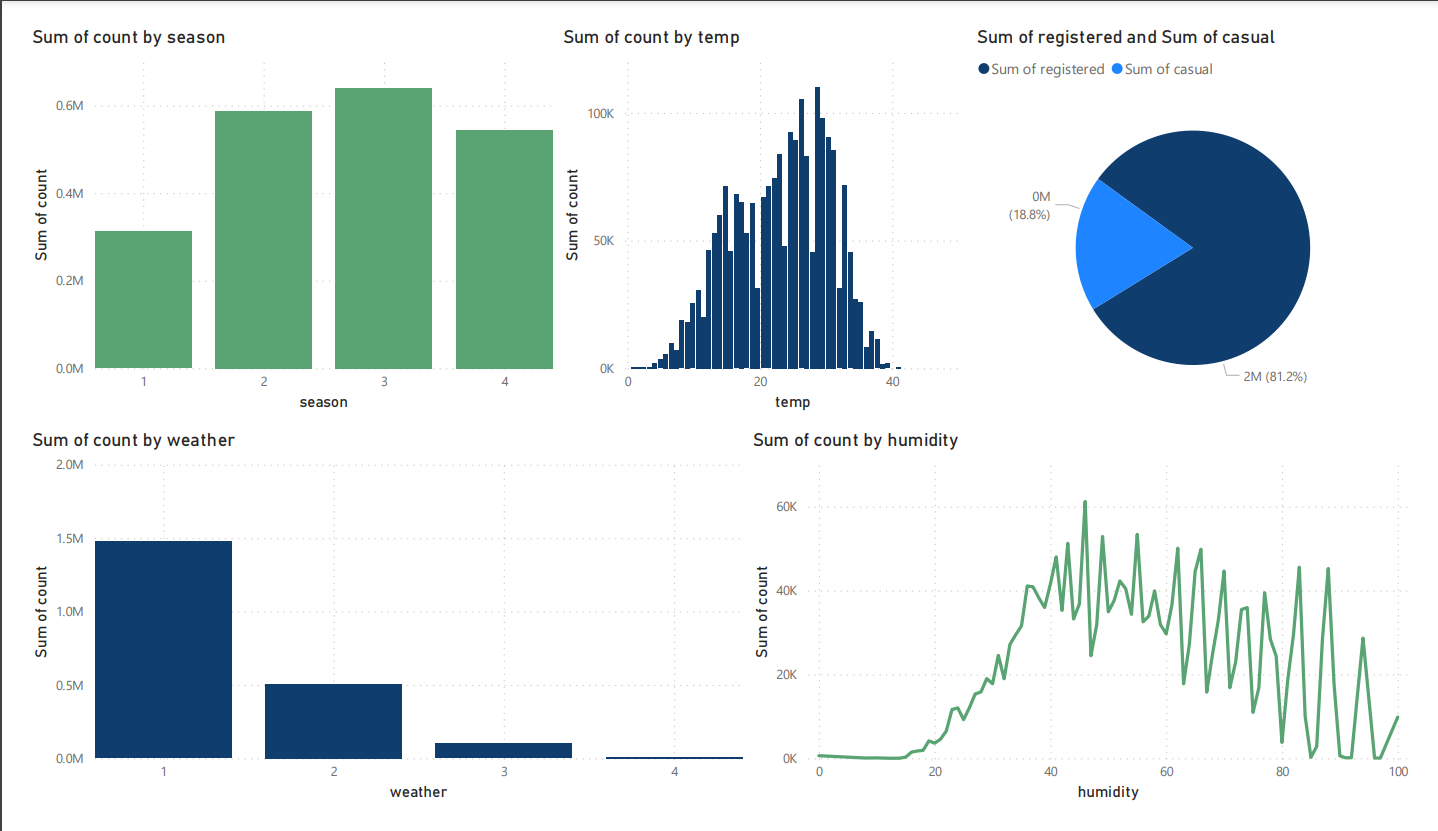
This dataset provides insights into the usage patterns of YULU bike sharing services. It includes a variety of factors such as weather conditions, time, and user type, which could influence bike rental behaviors. Target Columns
-
Casual: Count of Casual Users
-
Registered: Count of Registered Users
-
Count : Casual + Registered Note on Registration: YULU's policy requires a refundable security deposit of Rs 100 for registration. This aspect could influence user decisions to register and use the service regularly. Temperature Columns
-
temp: Ambient temperature as measured by standard devices, in Celsius.
-
atemp: 'Feels like' temperature, considering factors like humidity and wind, in Celsius. Column Profiling:
-
datetime: Date and time of the bike rental.
-
season: Categorical variable representing the season (1: Spring, 2: Summer, 3: Fall, 4: Winter).
-
holiday: Indicates if the day is a public holiday (1: Holiday, 0: Non-holiday).
-
workingday: Identifies working days (1: Working day, 0: Weekend or holiday).
-
weather: Categorical variable representing weather conditions:
-
1: Clear, few clouds, partly cloudy.
-
2: Mist + cloudy, mist + broken clouds, mist + few clouds.
-
3: Light snow, light rain + thunderstorm + scattered clouds, light rain + scattered clouds.
-
4: Heavy rain + ice pellets + thunderstorm + mist, snow + fog.
-
humidity: Relative humidity in percentage.
-
windspeed: Wind speed in km/h.
-
count: Total count of rented bikes, including both casual and registered users.
-
Which variables are significant in predicting the demand for shared electric cycles in the Indian market?✅
-
Select an appropriate test to check whether:
-
Working Day has effect on number of electric cycles rented✅
-
No. of cycles rented similar or different in different seasons✅
-
No. of cycles rented similar or different in different weather✅
-
Weather is dependent on season (check between 2 predictor variable)✅
-
-
Before finding out some insights lets focus on checking null value, outliers and prepare overall data, also we delete datetime column by adding the [year,month] columns
-
Our main focus will be on comparing other columns with these 3 columns [casual,register,count] because they explore about the count of users which is the main focus of Yulu's
-
We will compare and try to find relation between variables
-
At each set of visualization we provide a "short analysis (SA)" to understand what the visualization want to say
-
After that we will start our main part that is Hypothesis Testing
-
We have to use various test to check wether we have to Reject H0 or Accept H0
-
So after solving each problem we markdown the final Answer
Note : Please feel free to suggest any modifications, improvements, or corrections. I'm open to learning and improving
- Data Exploration & EDA ✅
- Relation Between Independent and Dependent Variables✅
- Hypothesis Testing (Shapiro, Levene , Whiteneyuu, Kruskal's Wallis, Dunn's Test)✅
- https://en.wikipedia.org/wiki/Kruskal%E2%80%93Wallis_one-way_analysis_of_variance
- https://www.kaggle.com/code/ekrembayar/a-b-testing-step-by-step-hypothesis-testing
- https://www.statology.org/dunns-test/
- Short Analysis : SA

