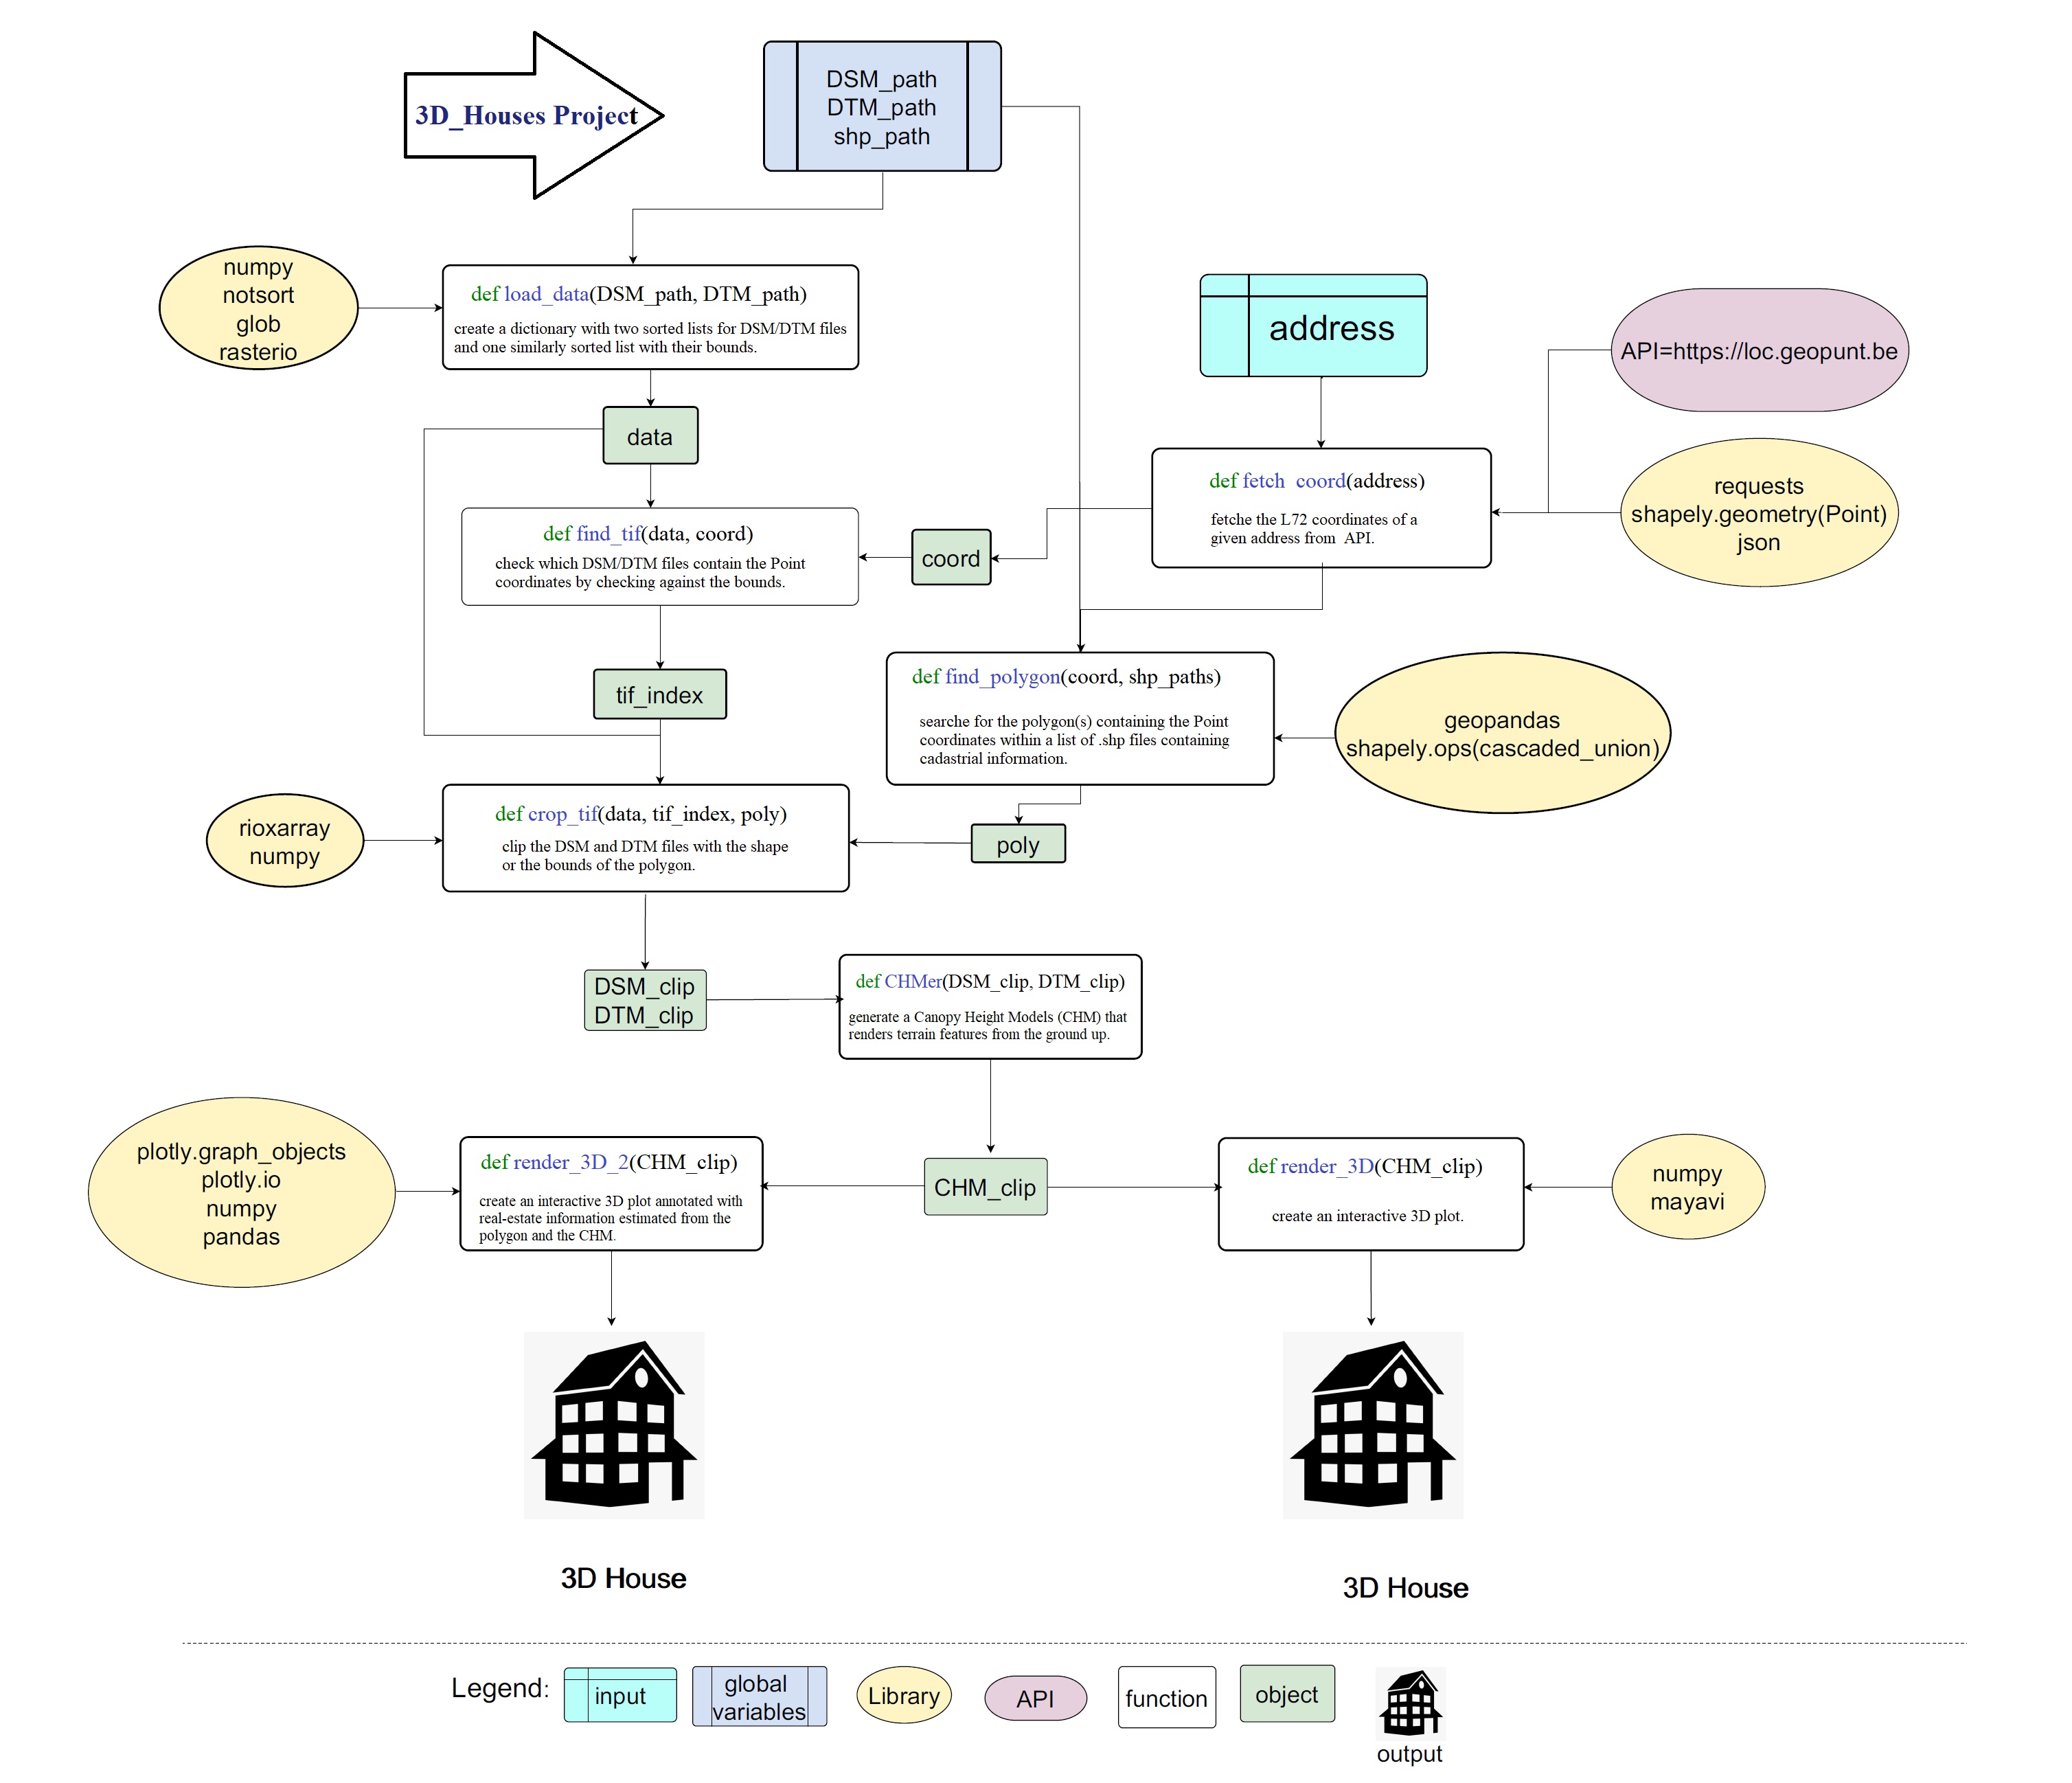
This repository provides a Jupyter notebook with the goal to let an end user generate a 3D plot of the house or building on a specified address within the entire Belgium. The main dataset being used to do this is publicly available, and originates from a governmental project called DHMV II.
- Repository:
3D_houses - Type of Challenge:
Learning & Consolidation - Duration:
1 weeks - Deadline:
18/06/21 12:30 AM - Deployment strategy :
- Jupyter Notebook
- Team challenge :
Team (3-4)
- Python : A programming language
- Jupyter : An open document format based on JSON
- Numpy : The fundamental package for scientific computing with Python
- Pandas : A fast, powerful, flexible and easy to use open source data analysis and manipulation tool, built on top of the Python programming language.
- Mayavi : 3D scientific data visualization and plotting in Python
- Json : A lightweight data-interchange format
- Plotly : An Open Source Graphing Library for python
- Geopandas : An open source project to make working with geospatial data in python easier
- Rasterio : A tool to Rasterio: access to geospatial raster data
- Rioxarray : Rasterio xarray extension
- Shapely : Manipulation and analysis of geometric objects in the Cartesian plane
| Collaborators | Role Description |
|---|---|
 Atefeh Hossein |
- API testing & shapefile processing - 3D Libraries (Mayavi) - Research & Documentation |
 Ceren Mörey |
- Raster files processing (rasterio) - API requests to find L-72 coordinates - Communication strategy |
 Corentin Chanet (Project Manager) |
- Code optimization & GUI - Coordination and support to team members - 3D Libraries (plotly) |
 Hugo Pradier |
- 3D rendering - github / README.md - Documentation - Jupyter Notebook setup |
Consolidate the knowledge in Python, specifically in :
- NumPy
- GeoPandas, shapely (Geo Data)
- rasterio, rioxarray (Raster Data)
- mayavi, plotly (3D plotting libraries)
- to be able to search and implement new libraries
- to be able to read and use the shapefile format
- to be able to read and use geoTIFFs
- to be able to render a 3D plot
- to be able to present a final product
We are LIDAR PLANES, active in the Geospatial industry. We would like to use our data to launch a new branch in the insurance business. So, we need you to build a solution with our data to model a house in 3D with only a home address.
- 3D lookup of houses.
- Optimize your solution to have the result as fast as possible.
- Features like the living area of the house in m², how many floors, if there is a pool, the vegetation in the neighborhood, etc...
- Better visualization.
The results we're interested in are DSM (Digital Surface Map) and DTM (Digital Terrain Map).
Which are already computed and available here :
First, open your terminal then clone the project into your local files
$ sudo git clone git@github.com:pradierh/3D_houses.git
Go into the repository and create a "map" directory and then in it, create a DSM and DTM directories
$ cd 3D_houses
$ mkdir map
$ cd map
$ mkdir DSM && mkdir DTM
Into DTM directory please download all the DTM files
Do the same with the DSM directory and download all the DSM files
Unzip all the files in both directories
$ unzip \*.zip
$ sudo pip install numpy pandas geopandas natsort fiona shapely rasterio open3d PyQt5 mayavi jupyterlab rioxarray plotly ipywidgets plotly requests
To install jupyterlab, if you are using a Unix derivative (FreeBSD, GNU / Linux, OS X), please use this command line:
$ export PATH="$HOME/.local/bin:$PATH"
If you are interested in the mayavi jupyter notebook support as well, do the following (after ensuring that you have jupyter installed of course):
$ jupyter nbextension install --py mayavi --user
$ jupyter nbextension enable --py mayavi --user
Navigate to the repo root on your terminal then write this command line:
$ jupyter notebook
Visuals exemples of the Sint-Jacob church located in Antwerpen:
(Lange Nieuwstraat 73, 2000 Antwerpen, Belgique)


