Author: Austin Peel
Email: austin.peel@cea.fr
Year: 2019
This repository is a collection of python codes useful for the weak-lensing analysis of galaxy catalogs and shear/convergence maps. The full documentation can be found here.
- python (version 3.5 or later)
- numpy
- scipy
- astropy
- emcee (optional)
- nicaea (optional)
- Sparse2D (optional)
Install the latest release from PyPi.
$ pip install lenspack
Clone this repository to your local machine. You might find it helpful to do this in a virtual environment in order to keep a clean workspace.
$ git clone https://github.com/cosmostat/lenspack.git
A new directory lenspack will be generated. Navigate into it.
$ cd lenspack
Run the setup script to install lenspack and its necessary dependencies.
$ pip install .
The package will also soon be available to install directly using pip.
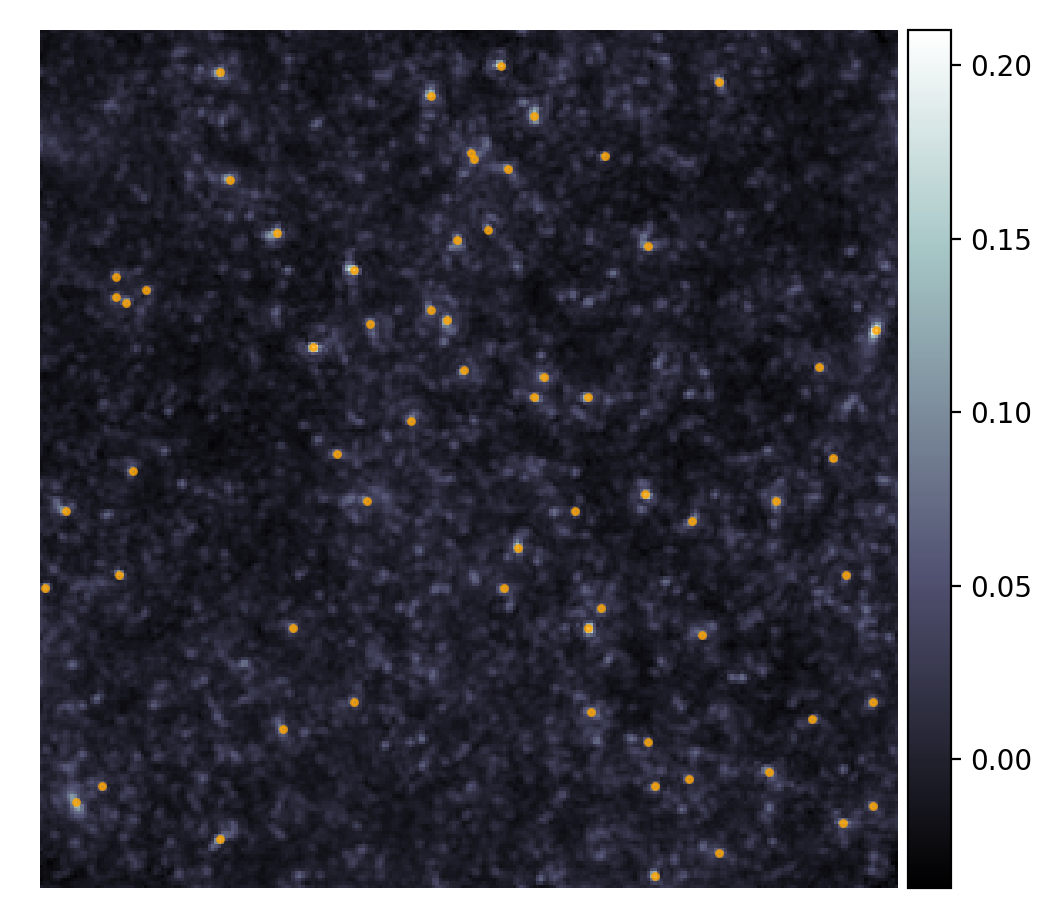
Suppose you have a galaxy catalog cat containing sky position columns ra and dec, along with ellipticity components e1 and e2. You can bin the galaxies into pixels, invert the shear to obtain convergence (Kaiser & Squires, 1993), detect peaks above a given threshold, and plot the result as follows.
import matplotlib.pyplot as plt
from lenspack.utils import bin2d
from lenspack.image.inversion import ks93
from lenspack.peaks import find_peaks2d

# Bin ellipticity components based on galaxy position into a 128 x 128 map
e1map, e2map = bin2d(cat['ra'], cat['dec'], v=(cat['e1'], cat['e2']), npix=128)

# Recover convergence via Kaiser-Squires inversion
kappaE, kappaB = ks93(e1map, e2map)

# Detect peaks on the convergence E-mode map
x, y, h = find_peaks2d(kappaE, threshold=0.03, include_border=True)

# Plot peak positions over the convergence
fig, ax = plt.subplots(1, 1, figsize=(7, 5.5))
mappable = ax.imshow(kappaE, origin='lower', cmap='bone')
ax.scatter(y, x, s=10, c='orange')  # reverse x and y due to array indexing
ax.set_axis_off()
fig.colorbar(mappable)
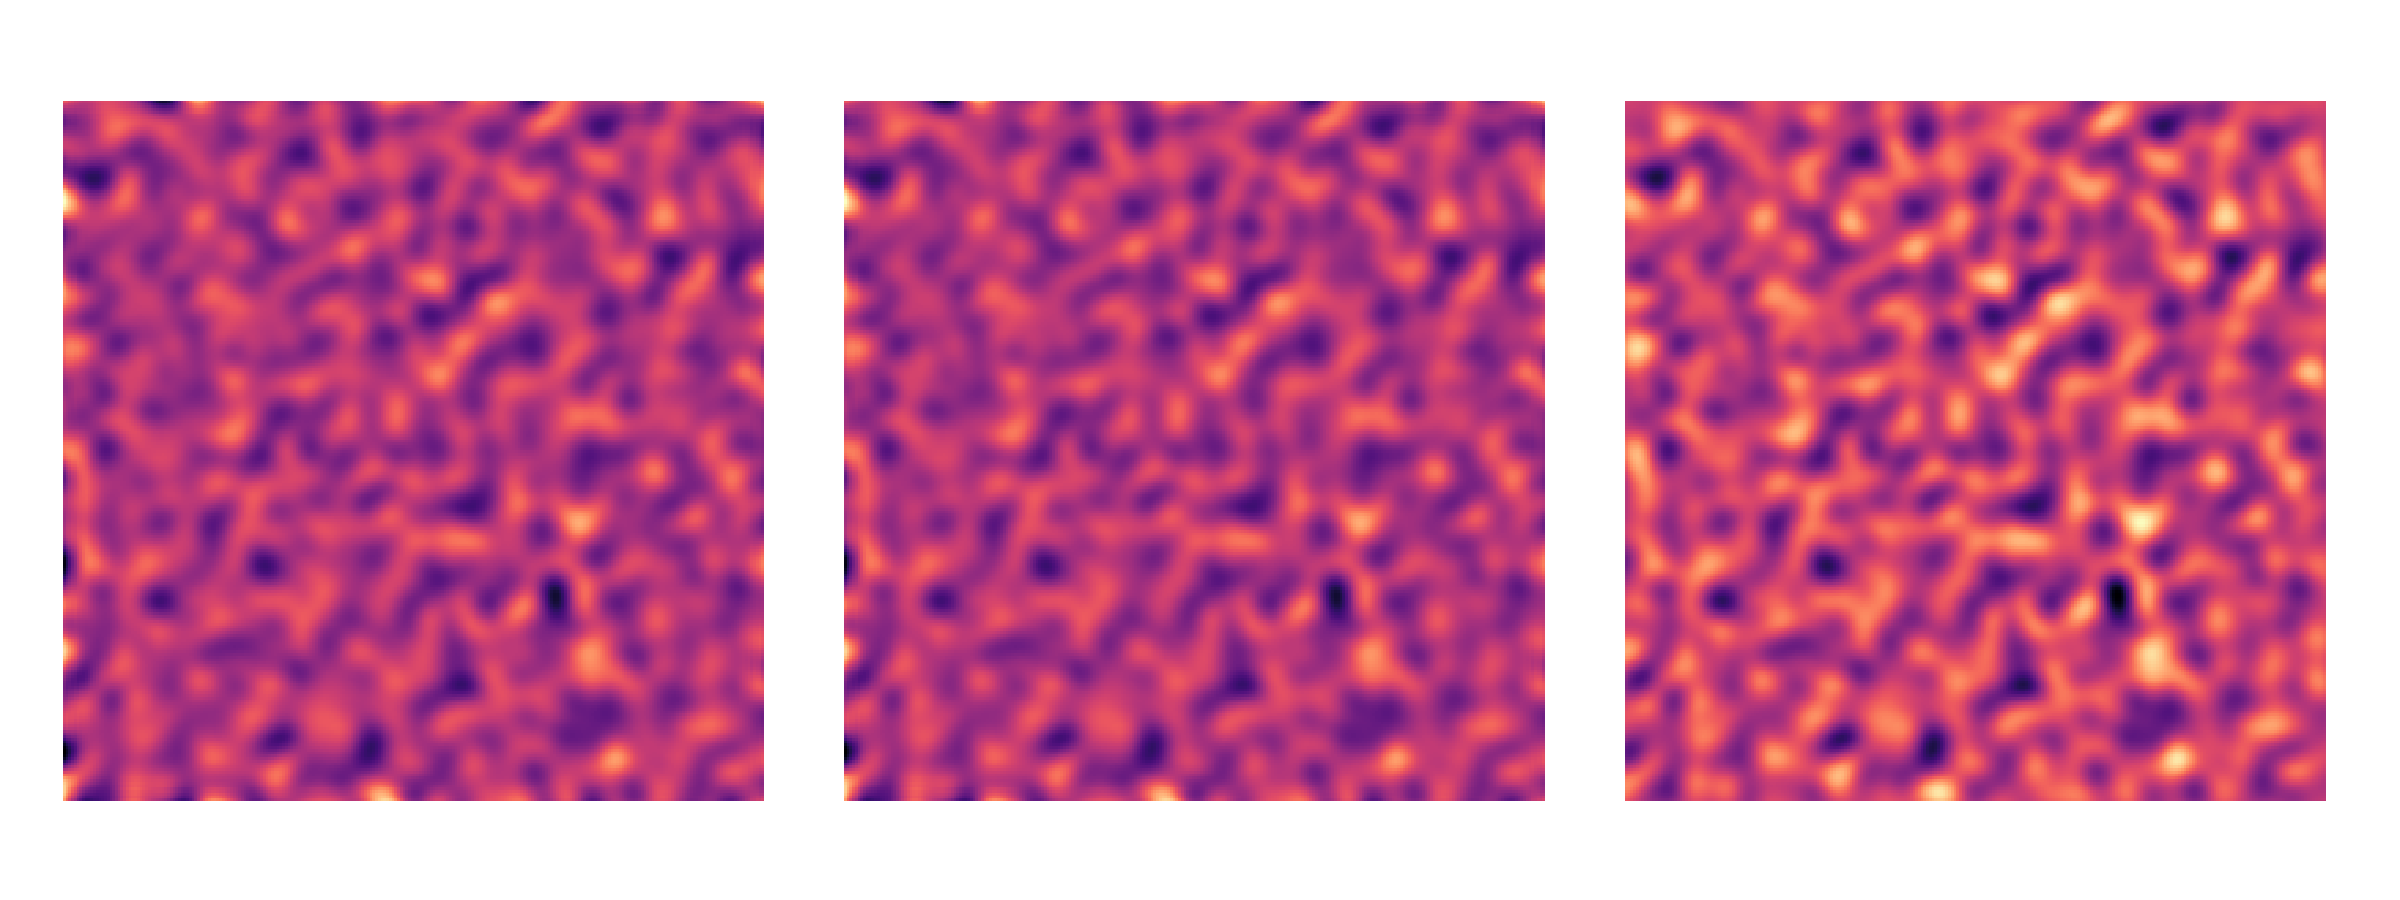
plt.show()Take the starlet transform of an image using two different methods. Compare results to the equivalent aperture mass filter at a given scale.
import numpy as np
import matplotlib.pyplot as plt
from lenspack.image.transforms import starlet2d, mr_transform
from lenspack.image.filters import aperture_mass

# Generate a test image
img = np.random.randn(256, 256)

# Take the starlet transform with 5 wavelet scales
st = starlet2d(img, nscales=5)
mrt = mr_transform(img, nscales=5)  # The Sparse2D mr_transform binary is required for this
                                    # wrapper function to work

# Compute the aperture mass map at scale 4 using the starlet filter
apm = aperture_mass(img, theta=2**4, filter='starlet')

# Plot
fig, (ax1, ax2, ax3) = plt.subplots(1, 3, figsize=(12, 5))
ax1.imshow(st[3], cmap='magma')
ax2.imshow(mrt[3], cmap='magma')
ax3.imshow(apm, cmap='magma')
for ax in (ax1, ax2, ax3):
    ax.set_axis_off()
