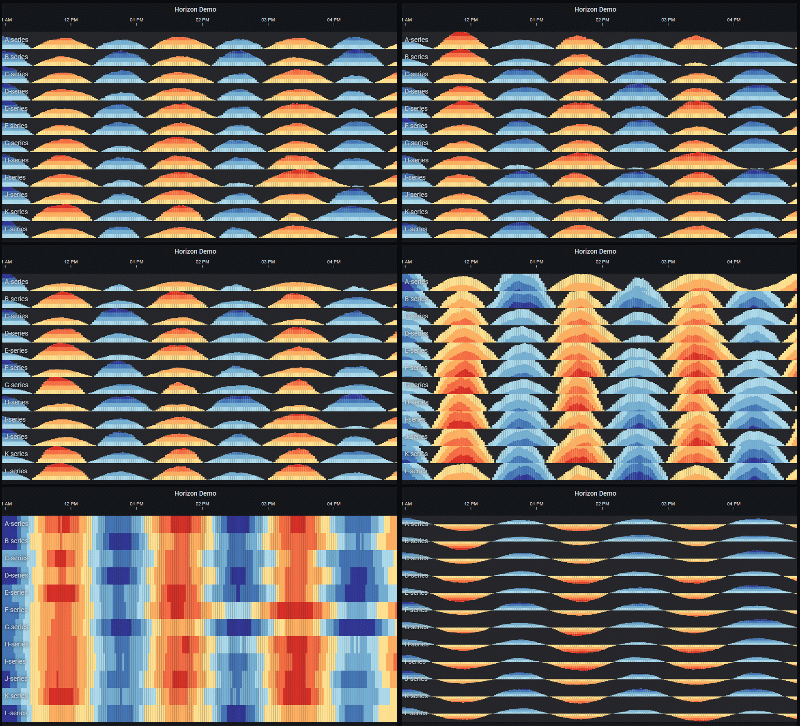
Grealtly inspired by small multiples from the almighty data visualization world. Small multiple "is a series of similiar graphs or charts using the same scale and axes, allowing them to be easily compared".
One first approach on utilizing this plugin would would be to give the user a bird's-eye view of what one's willing to monitor. Allowing the user to quickly grasp changes and insights.
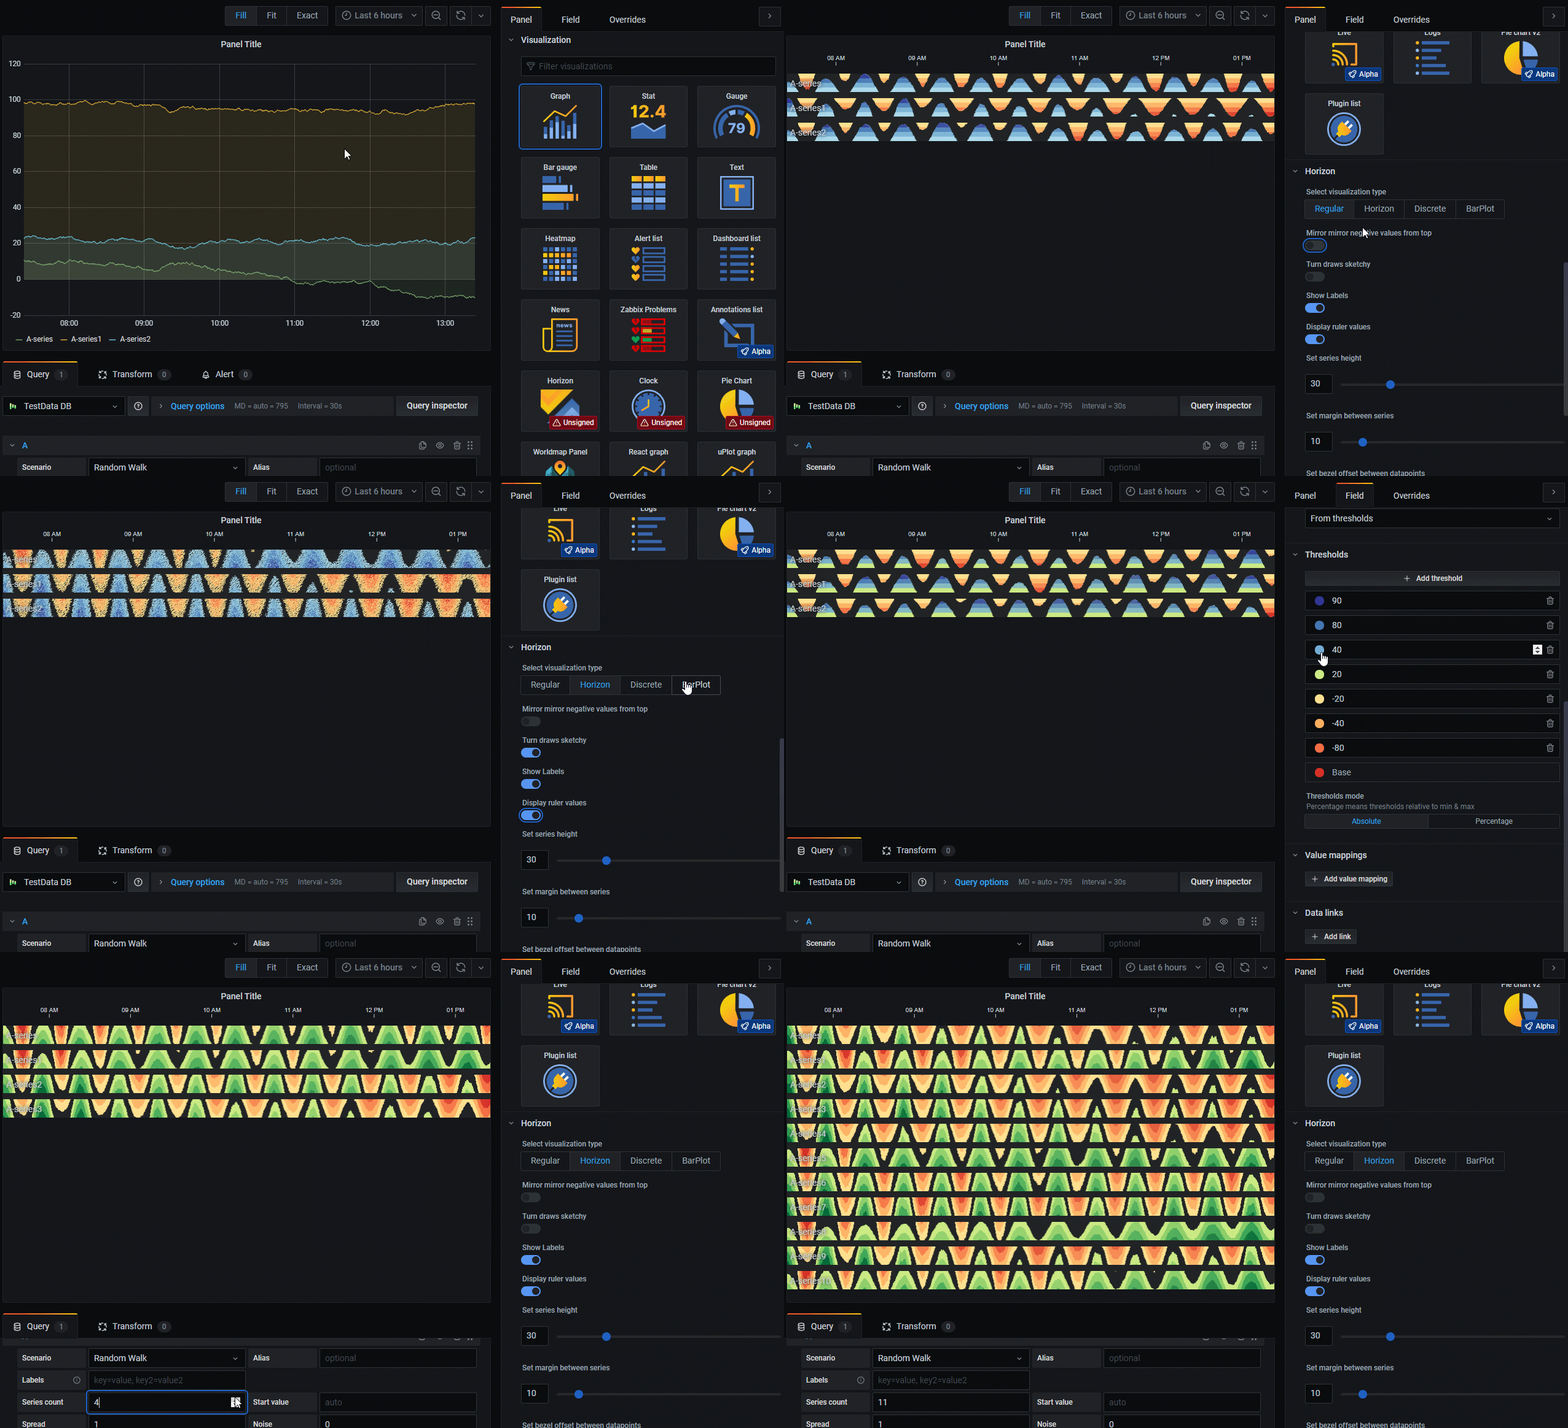
Download .zip and extract it to your grafana plugins folder e.g. /var/lib/grafana/plugins.
Then click Horizon Badge in your visualizations gallery.
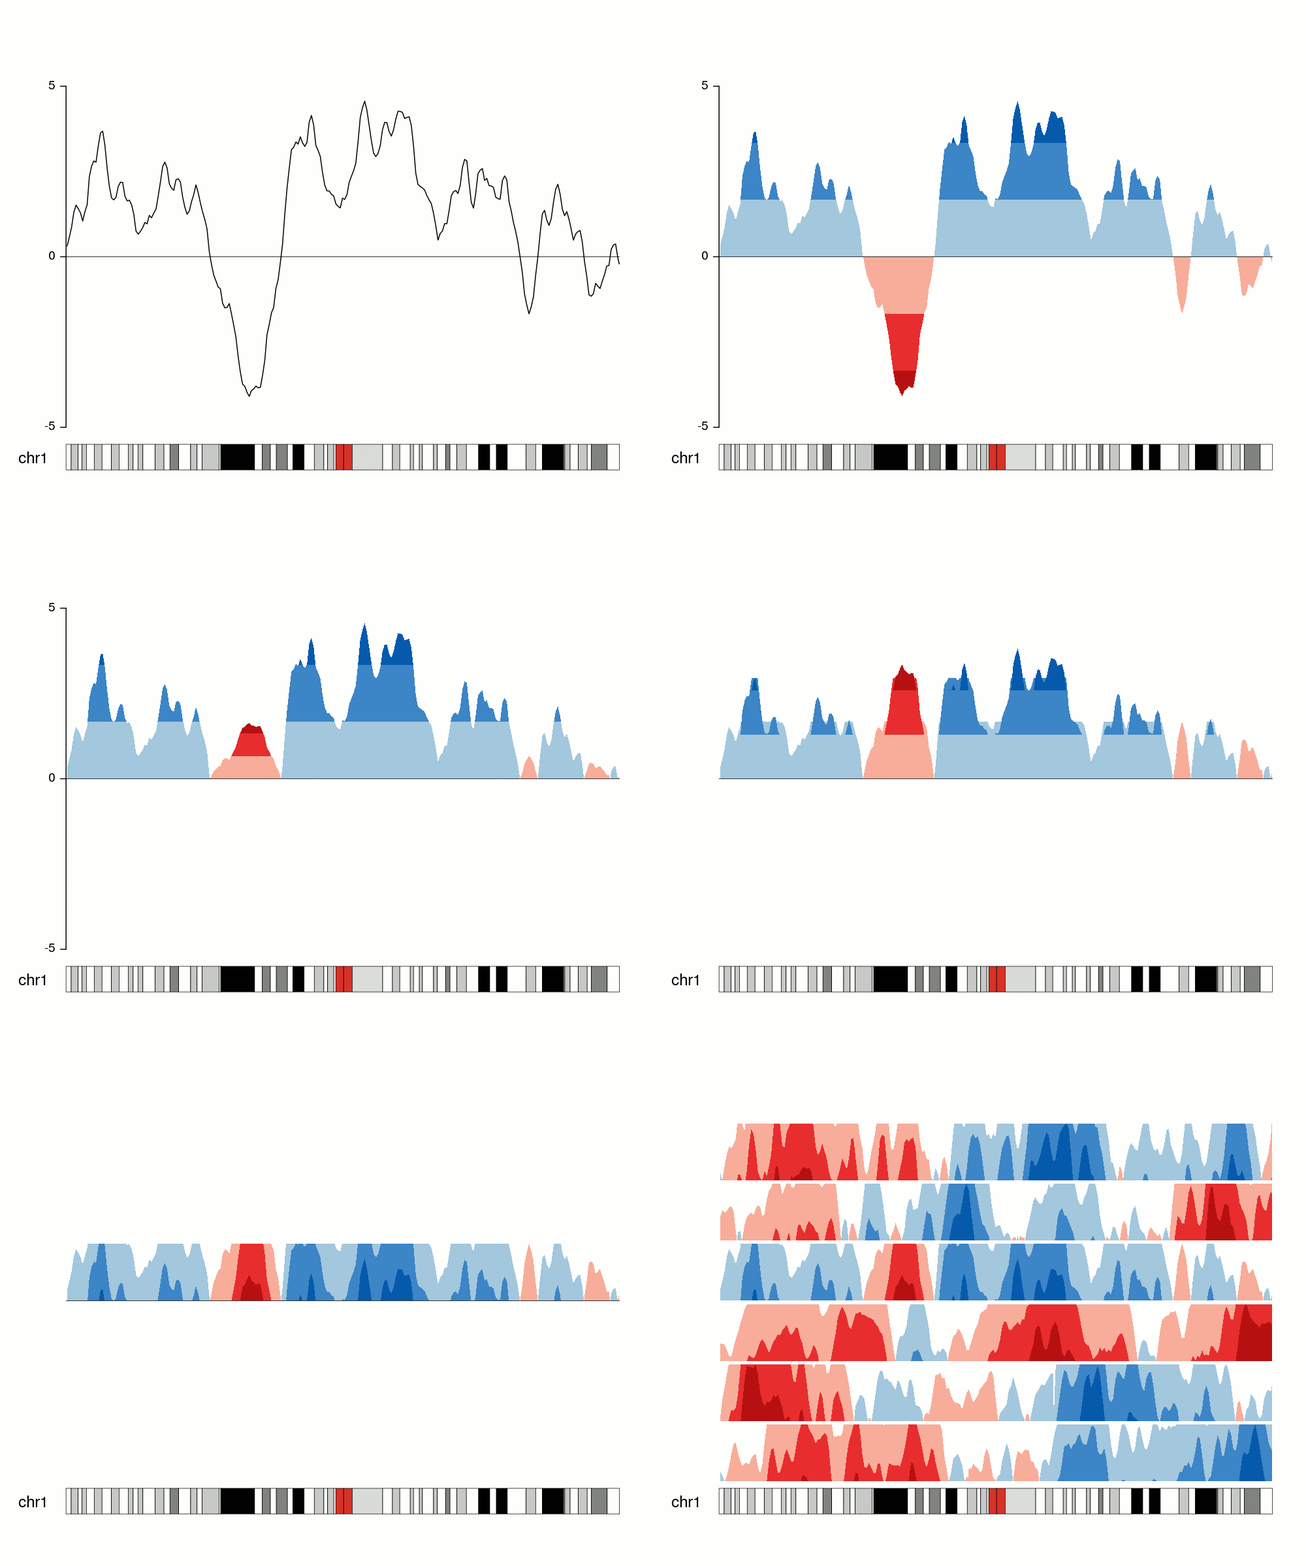
https://bernatgel.github.io/karyoploter_tutorial/Tutorial/PlotHorizon/PlotHorizon.html
What's in this first release?
- 4 vis engines:
- Regular
- Horizon
- Discrete
- BarPlot
- Sketchy vis
- Show:
- Labels
- Ruler Values
- Mirror/Offset View
- Set:
- bgColor
- Series Height
- Series Margin
- Bar Width
- Bar Margin Offset
- Thresholds
- Sort series by some aggregation. e.g. last, mean, avg, percentile, etc.
- Brush change timerange
- Shared Mouse Hover Tooltip Ruler
- Fetch event from other panels
- Emit to other panels
- Compress datapoints:
- e.g. Fit 1800 datapoints into 1000 pixels
- Get options: avg, max, first, last, percentile, etc.
- Color + Band preset:
- e.g. Automatically generate colors palette + band. would need to bring ThresholdEditor to PanelBuilder. not possible atm grafana/grafana#26554
- Check Light Theme
- Grab dark/light theme in code
- Assess Timezones
- Assess other datasources:
- Zabbix
- SimpleJson
https://semver.org/ MAJOR.MINOR.PATCH
- Major: Incompatible API changes
- Minor: Added functionality in a backwards-compatible manner
- Patch: Backwards compatible fixes (such as bug fixes)
- D3JSv6
- moments
- grafana/ui
- grafana/data
- grafana/runtime
This plugin was heavily inspired by Mike Bostock's cubism and all sorts of small multiples data visualization out there.


