Richard Sprague 2019-11-27
See Continous Glucose Monitoring: Start Here
I’ve been tracking my glucose levels 24 x 7 using a continuous glucose monitor from Abbott Labs called the Freestyle Libre.
View a Shiny version of my current data at https://personalscience.shinyapps.io/librelink/. [Source]
Read (and edit!) my Continuous Glucose Monitoring Hackers Guide for details for how to get started, plus as many resources as I know about other apps and links that you might find useful for beginning your own CGM analysis.
This is a short R script I use for my analysis. (also available as an R Package: cgmr)
Besides the working sensor, to run this script you’ll need:
- A registered account on Freestyle’s official site: libreview.com
- Data downloaded from the Libreview site. (I download it and convert to XLSX format in the file “Librelink.xlsx”)
- A separate activity file to register your food, exercise, sleep, and other events. (Another XLSX file I call “Activity.XLSX”)
See examples of all my raw data files in the librelink directory.
One you have downloaded the raw Librelink data and created the activity file, you must read the results into two dataframes:
libre_raw : the raw output from a Librelink CSV file. You could just
read.csv straight from the CSV if you like.
activity_raw: your file containing the metadata about whatever you’d
like to track. The following script assumes you’ll have variables for
Sleep, Exercise, Food, and a catch-all called Event.
Now clean up the data and then set up a few other useful variables. Be careful about time zones: the raw data comes as UTC time, so you’ll need to convert everything to your local time zone if you want the following charts to match.
library(tidyverse)
library(lubridate)
library(ggthemes)

activity_raw$Start <- activity_raw$Start %>% lubridate::parse_date_time(order = "ymd HMS",tz = "US/Pacific")
activity_raw$End <- activity_raw$End %>% lubridate::parse_date_time(order = "ymd HMS", tz = "US/Pacific")


glucose <- libre_raw %>% select(time = "Meter Timestamp",
                                scan = "Scan Glucose(mg/dL)",
                                hist = "Historic Glucose(mg/dL)",
                                strip = "Strip Glucose(mg/dL)",
                                food = "Notes")

#glucose$time <- readr::parse_datetime(libre_raw$`Meter Timestamp`,locale = locale(tz="US/Pacific"))

glucose$time <- as_datetime(libre_raw$`Meter Timestamp`, tz = "US/Pacific")
#
glucose$value <- dplyr::if_else(is.na(glucose$scan),glucose$hist,glucose$scan)

# apply correction for faulty 2019-01-08 sensor
#glucose$value <- dplyr::if_else(glucose$time>as_datetime("2019-01-08"),glucose$value+35,glucose$value)

# apply correction for faulty 2019-03-24 sensor
#glucose$value <- dplyr::if_else(glucose$time>as_datetime("2019-03-23"),glucose$value+35,glucose$value)


glucose_raw <- glucose

# libre_raw$`Meter Timestamp` %>% lubridate::parse_date_time(order = "ymd HMS",tz = "US/Pacific")
Set up a few convenience functions.
library(cgmr) # loads my private package that includes all the functions for analysisView the last couple days of the dataset:
startDate <- now() - days(2) #min(glucose$time)

#cgm_display(startDate,now()-days(6))

cgm_display(startDate,startDate + days(2))
Here’s just for a single day. Note that the commented-out lines will let you output to a PDF file if you like.
#pdf("icecream.pdf", width = 11, height = 8.5)
cgm_display(start = min(glucose_raw$time),min(glucose_raw$time)+hours(24))#dev.off()The final full day of the dataset:
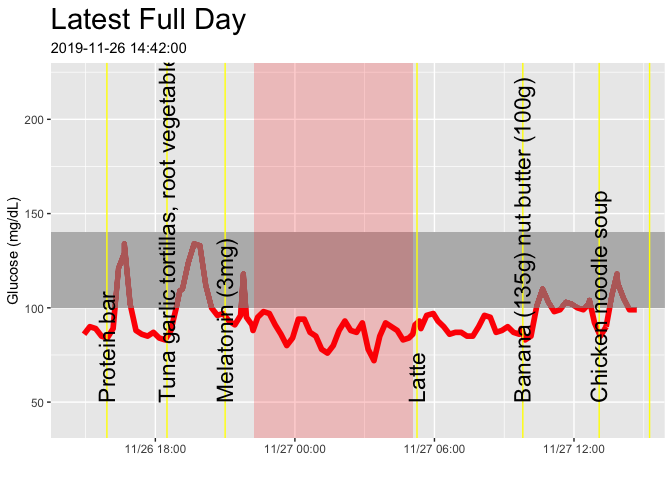
cgm_start_plot(startTime = max(glucose_raw$time)-days(1), timeLength = 24, title = "Latest Full Day")I measured myself while trying various foods. Click here to see the results.
What is my average glucose level while sleeping?
library(lubridate)

options(scipen = 999)

# all sleep intervals, using the lubridate function lubridate::interval
# sleep_intervals <- interval(activity_raw %>% dplyr::filter(Activity == "Sleep") %>% select(Start)
#                             %>% unlist() %>% as_datetime(),
#                             activity_raw %>% dplyr::filter(Activity == "Sleep") %>% select(End)
#                             %>% unlist() %>% as_datetime())

activity_intervals <- function(activity_raw_df, activity_name){
  interval(activity_raw_df %>% dplyr::filter(Activity == activity_name) %>% select(Start)
                            %>% unlist() %>% as_datetime(),
                            activity_raw_df %>% dplyr::filter(Activity ==activity_name) %>% select(End)
                            %>% unlist() %>% as_datetime())
}


#
# glucose %>% dplyr::filter(apply(sapply(glucose$time,
#                                 function(x) x %within% activity_intervals(activity_raw,"Sleep")),2,any)) %>% select(value) %>%
#   DescTools::Desc(main = "Glucose Values While Sleeping")

# glucose %>% filter(apply(sapply(glucose$time,
#                                 function(x) !(x %within% activity_intervals(activity_raw,"Sleep"))),
#                          2,
#                          any)) %>% select(value) %>%
#   DescTools::Desc(main = "Glucose Values While Awake")


# glucose %>% filter(apply(sapply(glucose$time,
#                                 function(x) x %within% activity_intervals(activity_raw,"Exercise")),2,any)) %>% select(value) %>%
#   DescTools::Desc(main = "Glucose Values While Exercising")

