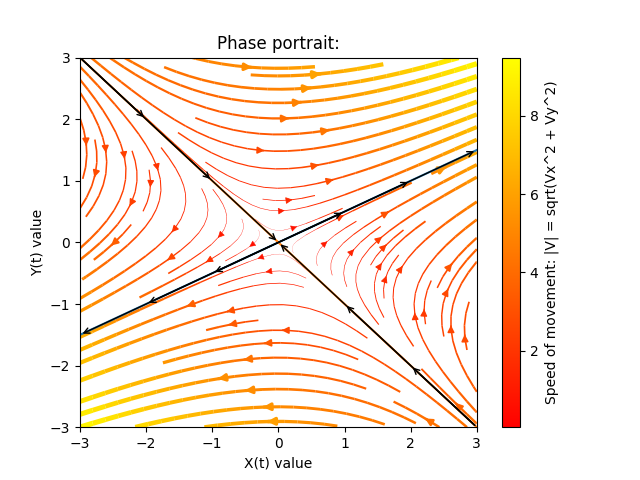
Goals for this code:
- Done: draw phase prtrait of non-linear systems of 2D coupled differential equations
- Done: find the Jacobian matrix of these systems
- Done: be able to trace a single curve in the system using a numerical method of choice
- Done: plot any eigenvectors
TODO: Write documentation TODO: Add requirements.txt TODO: Publish GitHub package TODO: Organize, productionalize all plotting code into a single, well documented function, and remove uneccessary code. TODO: Use Google Python Fire to make the Python function into an organized, production ready CLI function. TODO: Try to follow Google Python Style Guide.
def plot(plot_eigenvectors = True)

plot(blaah=foo, ...)- matrix (required): A 2 by 2 matrix for the phase portrait stream plot.
- plot_eigenvectors (optional, default true): If any eigenvalue is complex, this option does nothing. If all eigenvalues are real (none are complex) then plots arrows indicating the direction of the eigenvectors.
Result:
This code was inspired by the Fall 2017 Math 125 Ordinary Differential Equations class at UC Merced. Special thanks to Professor Shilpa Khatri, as well as Ms. Shayna Bennett and Ms. Matea Alvarado, for teaching the class.
Much of the code was also inspired by the MATLAB code of the author of the textbook. The code can be found at: http://www.cambridge.org/us/academic/subjects/mathematics/differential-and-integral-equations-dynamical-systems-and-co/introduction-ordinary-differential-equations?format=PB&isbn=9780521533911#i6bXGsqpr95zt3FP.97
Here is a link to the textbook: http://www.cambridge.org/0521533910
More differential equation software: http://math.rice.edu/~dfield/index.html
