To execute the program, simply run:
../MandelBrot.exe
Without any parameters the exe will output a very basic 1920x1080 image of a mandelbrot named "Mandelbrot.bmp". The file will be located in the same folder as the exe. There are multiple commandline parameters you can provide to change the configuration:
-fn [string] Sets the filename of the final image
-r [int] [int] Sets the resolution of the final image. The dimensions are ordered as Width - Height
-i [int] Sets the maxumum amount of iterations used to render the mandelbrot
-s [double] [double] [double] [double] Sets the targets section of the mandelbrot that needs to be rendered, The parameters are ordered as "Left, Right, Top, Bottom", so a full mandelbrot would be "-s 0 1 0 1". If you want to render a specific section of the mandelbrot, you can calculate it like this:
-c [colorcurve] Sets the colors of the image.
The formula of the mandelbrot creates a series of doubles, the ColorCurve is the thing that transforms that value into a rgb color. You can change the curves yourself by providing it in a certain format:
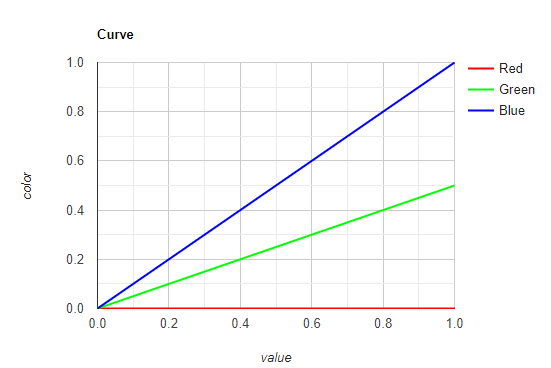
-c "r 0 0 1 0 g 0 0 1 0.5 b 0 0 1 1"The above color curve would provide a value to color mapping like this:

You can add extra points to the curves by adding extra numbers in sets of two. For example:
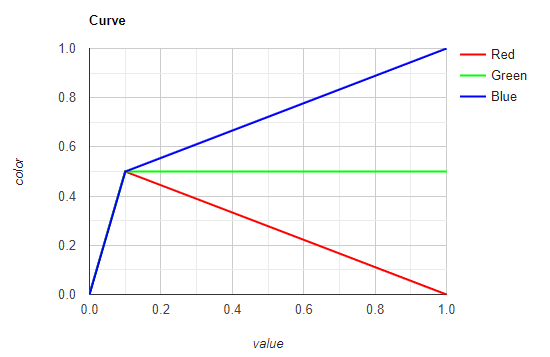
-c "r 0 0 0.1 0.5 1 0 g 0 0 0.1 0.5 1 0.5 b 0 0 0.1 0.5 1 1"In this curve we have defined another point at value 0.1 that would result in 0.5. which results in the following color curve:

I recommend fooling around with it to get a feel for it. The points that have most effect are between 0.003 and 0.5 and I recommend making those values brighter in any color.
-i 1500 -s 0.3052 0.4 0.2712 0.3759 -c "r 0 0 0.03 0.5 0.09 0.8 1 1 g 0 0 0.1 0.1 1 0.7 b 0 0 0.05 0.5 1 1"
- Build GUI for selecting a section
- Build GUI for configuring colors
- Actually how about building a GUI to just, do everything. It makes life so much easier for the less tech savvy.


