A crossplatform GUI to display tabulated data from files or python pandas dataframes. It's compatible Windows, Linux and MacOS, python 2 and python 3. Some of its features are: multiples plots, FFT plots, probability plots, export of figures... The file formats supported, are: CSV files and other formats present in the weio library. Additional file formats can easily be added.
For Windows users, an installer executable is available here (look for the latest pyDatView*.exe)
Linux and MacOS users can use the command lines below. Linux users may need to install the package python-wxgtk* (e.g. python-gtk3.0) from their distribution. MacOS users can use a brew, anaconda or virtualenv version of python and pip, but the final version of python that calls the script needs to have access to the screen (see details for MacOS). The main commands for Linux and MacOS users are:
git clone --recurse-submodules https://github.com/ebranlard/pyDatView
cd pyDatView
python -m pip install --user -r requirements.txt
make     # executes: 'python pyDatView.py' (on linux) or './pythonmac pyDatView.py' (on Mac)
echo "alias pydat='make -C `pwd`'" >> ~/.bashrc
More information about the download, requirements and installation is provided further down this page
Windows users that used a setup.exe file should be able to look for pyDatView in the Windows menu, then launch it, and pin the program to the taskbar for easier access.
If you cloned this repository, the main script at the root (pyDatView.py) is executable and will open the GUI directly. A command line interface is provided, e.g.:
pyDatView file.csvThe python package can also be used directly from python/jupyter to display a dataframe or show the data in a file
import pydatview
pydatview.show(dataframe=df)
# OR
pydatview.show(filenames=['file.csv'])
# OR
pydatview.show('file.csv')Windows
- If you used the
setup.exe, you will find thepyDatViewApp in the windows menu, you can launch it from there, pin it to start, pin it to the startbar, open the file location to - If you used the portable version, you'll find
pyDatView.exeat the root of the directory. You can launch it and pin it to your taskbar. You can also right click, and create a short cut to add to your desktop or start menu. - If you clone the repository, you can create a shortcut at the root of the repository. In explorer, right click on an empty space, select New , Shortcut. Set the shortcut as follows:
"C:\PYTHON_DIR\PythonXX\pythonw.exe" "C:\INSTALL_DIR\pyDatView\pyDatView.launch.pyw"
Linux
You can add an alias to your bashrc as follows. Navigate to the root of the pyDatView repository, and type:
echo "alias pydat='python `pwd`/pyDatView.py'" >> ~/.bashrc
Next time you open a terminal, you can type pydat to launch pyDatView.
Adapt to another terminal like .shrc
MacOS
The procedure is the same as for linux, the small issue is that you need to find the "proper" python to call. When you run ./pythonmac from the root of the directory, the script tries to find the right version for you and finishes by showing a line of the form: [INFO] Using: /PATH/TO/PYTHON . This line gives you the path to python. Add pydat as an alias by running the line below (after adapting the PATH/TO/PYTHON):
echo "alias pydat='PATH/TO/PYTHON `pwd`/pyDatView.py'" >> ~/.zshrc
Next time you open a terminal, you can type pydat to launch pyDatView.
Windows
To associate a given file type with pyDatView, follow the following steps:
-
Locate
pyDatView.exe. If you installed usingsetup.exeor the portablezip, you'll findpyDatView.exeat the root of the installation folder (default isC:\Users\%USERNAME%\AppData\Local\pyDatView\). If you cannot find the exe, download it from the repository. If you cloned the repository, you'll find the executable in the subfolder_tools\of the repository. -
Verify that the exe works. Double click on the executable to verify that it lauches pyDatView. If it doesnt, run it from a terminal and look at the outputs.
-
Add the file association. Right click on a file you want to associate pyDatView with. Select "Open With" > "More Apps" > scroll to "Look for another App on my PC" > Navigate to the location of
pyDatView.exementioned above. If this works, repeat the operation and check the box "Always use this App for his filetype".
Documentation is scarce for now, but here are some tips for using the program:
- You can drag and drop files to the GUI directly to open them. Hold the Ctrl key to add.
- You can open several files at once, with same or different filetypes. Upon opening multiple files, a new table appears with the list of open files.
- To add multiple channels or data from multiple files to a plot, use
ctrl + clickor shift-click to make selections. - Look for the menus indicated by the "sandwich" symbol (3 horizontal bars ). These menus are also accessible with right clicks.
- The menus will allow you to edit tables (rename, delete them), add or remove columns (for instance to convert a signal from one unit to another unit), or change the values displayed in the information table at the bottom.
- Few options are also available in the menus
dataandtoolslocated at the top of the program. - The modes and file format drop down menus at the top can usually be kept on
auto. If a file cannot be read, pay attention to the file extension used, and possibly select a specific file format in the dropdown menu instead ofauto.
Main features:
- Plot of tabular data within a file
- Automatic detection of fileformat (based on weio but possibility to add more formats)
- Reload of data (e.g. on file change)
- Display of statistics
- Export figure as pdf, png, eps, svg
Different kind of plots:
- Scatter plots or line plots
- Multiple plots using sub-figures or a different colors
- Probability density function (PDF) plot
- Fast Fourier Transform (FFT) plot
Plot options:
- Logarithmic scales on x and y axis
- Scaling of data between 0 and 1 using min and max
- Synchronization of the x-axis of the sub-figures while zooming
Data manipulation options:
- Remove columns in a table, add columns using a given formula, and export the table to csv
- Mask part of the data (for instance selecting times above a certain value to remove the transient). Apply the mask temporarily, or create a new table from it
- Estimate logarithmic decrement from a signal tthat is decaying
- Extract radial data from OpenFAST input files
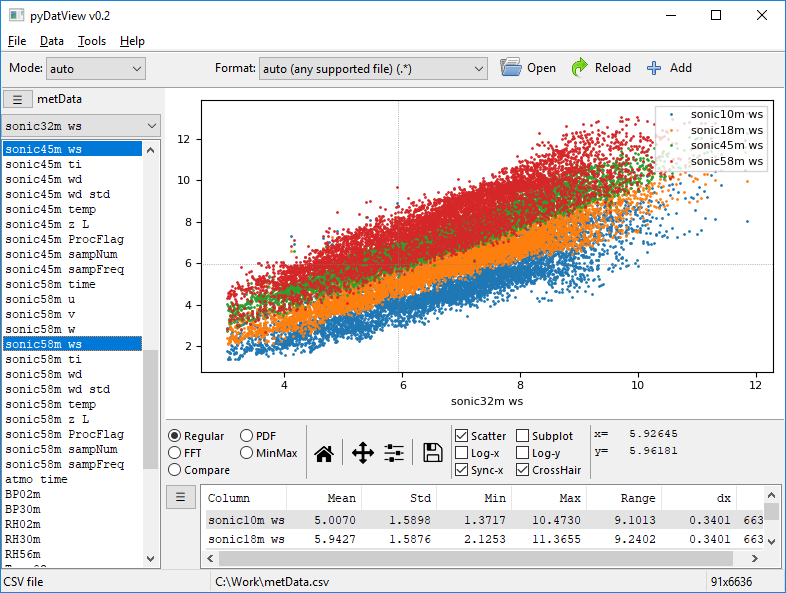
Scatter plot (by selecting Scatter) and several plots on the same figure:
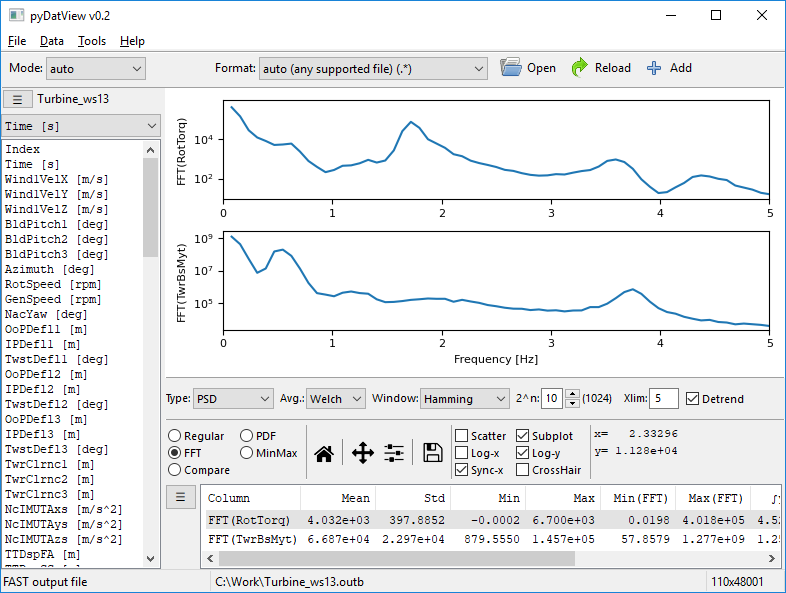
Fast Fourier Transform of the signals (by selecting FFT) and displaying several plots using subfigures (by selecting Subplot).
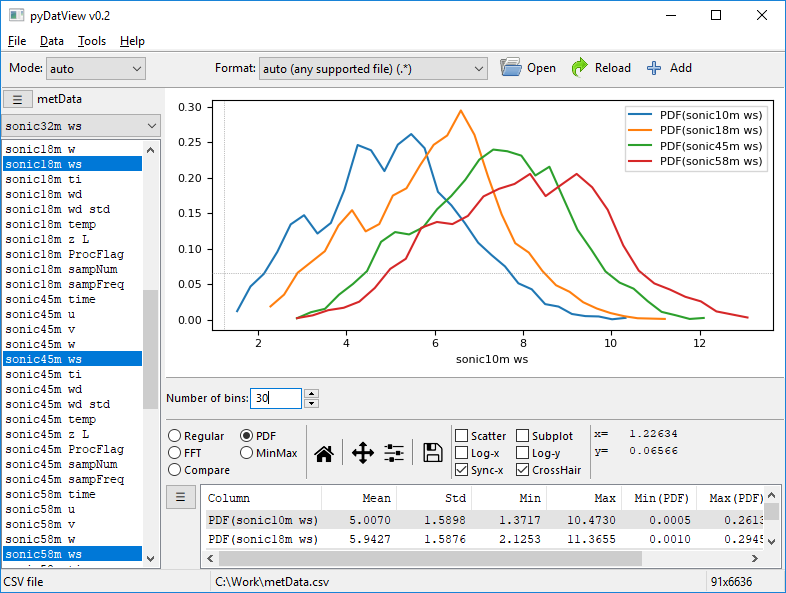
Probability density function:
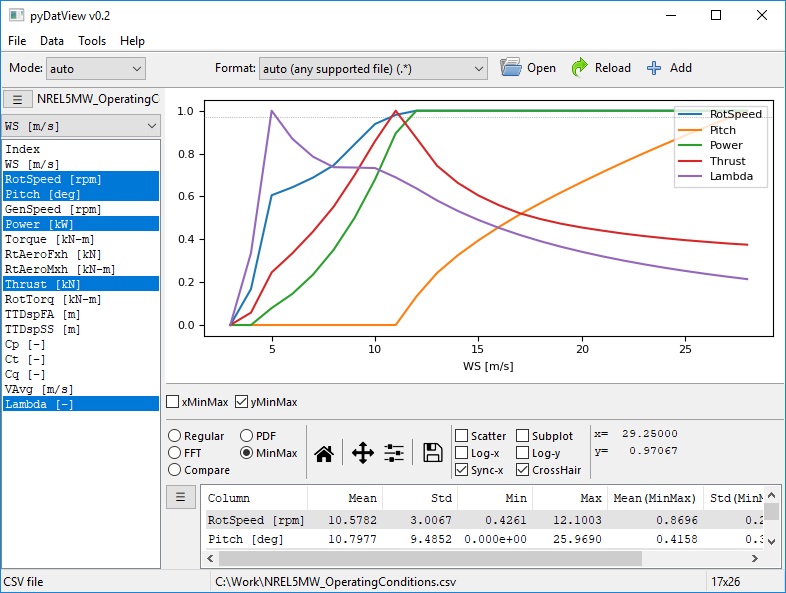
Scaling all plots between 0 and 1 (by selecting MinMax)

For Windows users, installer executables are available here (look for the latest pyDatView*.exe)
The script is compatible python 2.7 and python 3 and relies on the following python packages: numpy matplotlib, pandas, wxpython.
To download the code and install the dependencies (with pip) run the following:
git clone --recurse-submodules https://github.com/ebranlard/pyDatView
cd pyDatView
python -m pip install --user -r requirements.txt
If the installation of wxpython fails, you may need to install the package python-wxgtk* (e.g. python-gtk3.0) from your distribution. For Debian/Ubuntu systems, try:
sudo apt-get install python-wxgtk3.0.
For further troubleshooting you can check the wxPython wiki page.
If the requirements are successfully installed you can run pyDatView by typing:
python pyDatView.pyTo easily access it later, you can add an alias to your .bashrc or install the pydatview module:
echo "alias pydat='python `pwd`/pyDatview.py'" >> ~/.bashrc
# or
python setup.py installThe installation works with python2 and python3, with brew (with or without a virtualenv) or anaconda.
First, download the source code:
git clone --recurse-submodules https://github.com/ebranlard/pyDatView
cd pyDatView
Before installing the requirements, you need to be aware of the two following issues with MacOS:
- If you are using the native version of python, there is an incompatibility between the native version of
matplotlibon MacOS and the version ofwxpython. The solution is to usevirtualenv,breworanaconda. - To use a GUI app, you need a python program that has access to the screen. These special python programs are in different locations. For the system-python, it's usually in
/System, thebrewversions are usually in/usr/local/Cellar, and theanacondaversions are usually calledpython.app. The scriptpythonmacprovided in this repository attempt to find the correct python program depending if you are in a virtual environment, in a conda environment, a system-python or a python from brew or conda.
Different solutions are provided below depending on your preferred way of working.
If you have brew installed, and you installed python with brew install python, then the easiest is to use your python3 version:
python3 -m pip install --user -r requirements.txt
python3 pyDatView.py
If you are inside a virtualenv, with python 2 or 3, use:
pip install -r requirements.txt
./pythonmac pyDatView.py
If the pythonmac commands fails, contact the developer, and in the meantime try to replace it with something like:
$(brew --prefix)/Cellar/python/XXXXX/Frameworks/python.framework/Versions/XXXX/bin/pythonXXX
where the result from brew --prefix is usually /usr/loca/ and the XXX above corresponds to the version of python you are using in your virtual environment.
The installation of anaconda sometimes replaces the system python with the anaconda version of python. You can see that by typing which python. Use the following:
python -m pip install --user -r requirements.txt
./pythonmac pyDatView.py
If the pythonmac commands fails, contact the developer, and in the meantime try to replace it with a path similar to
/anaconda3/bin/python.appwhere /anaconda3/bin/ is the path that would be returned by the command which conda. Note the .app at the end. If you don't have python.app, try installing it with conda install -c anaconda python.app
To easily access the program later, you can add an alias to your .bashrc or install the pydatview module:
echo "alias pydat='python `pwd`/pyDatview.py'" >> ~/.bashrc
# or
python setup.py installFile formats can be added by implementing a subclass of weio/File.py, for instance weio/VTKFile.py. Existing examples are found in the folder weio.
Once implemented the fileformat needs to be registered in weio/__init__.py by adding an import line at the beginning of this script and adding a line in the function fileFormats() of the form formats.append(FileFormat(VTKFile))
Any contributions to this project are welcome! If you find this project useful, you can also buy me a coffee (donate a small amount) with the link below:


