🆕✅🎉 updated: 21th April 2022: We release different model weights.
🆕✅🎉 updated: 15th December 2021: We extend the proposed aggregation method to a variety of existing local features.
We provide results of Token. mAP is computed with Medium and Hard evaluation protocols.
| Model | ROxf (M) | ROxf + R1M (M) | RPar (M) | RPar + R1M (M) | ROxf (H) | ROxf + R1M (H) | RPar (H) | RPar + R1M (H) |
|---|---|---|---|---|---|---|---|---|
| R101-HOW + VLAD | 73.54 | 60.38 | 82.33 | 62.56 | 51.93 | 33.17 | 66.95 | 41.82 |
| R101-HOW + ASMK | 80.42 | 70.17 | 85.43 | 68.80 | 62.51 | 45.36 | 70.76 | 45.39 |
| R101-NetVLAD | 73.91 | 60.51 | 86.81 | 71.31 | 56.45 | 37.92 | 73.61 | 48.98 |
| R101-RMAC | 75.14 | 61.88 | 85.28 | 67.37 | 53.77 | 36.45 | 71.28 | 44.01 |
| R101-SOLAR | 79.65 | 67.61 | 88.63 | 73.21 | 59.99 | 41.14 | 76.15 | 50.98 |
| R101-DELG | 78.55 | 66.02 | 88.58 | 73.65 | 60.89 | 41.75 | 76.05 | 51.46 |
| R50-Token | 79.79 | 67.36 | 88.08 | 74.33 | 62.68 | 45.70 | 75.49 | 52.68 |
| R101-Token | 82.16 | 70.58 | 89.40 | 77.24 | 65.75 | 47.46 | 78.44 | 56.81 |
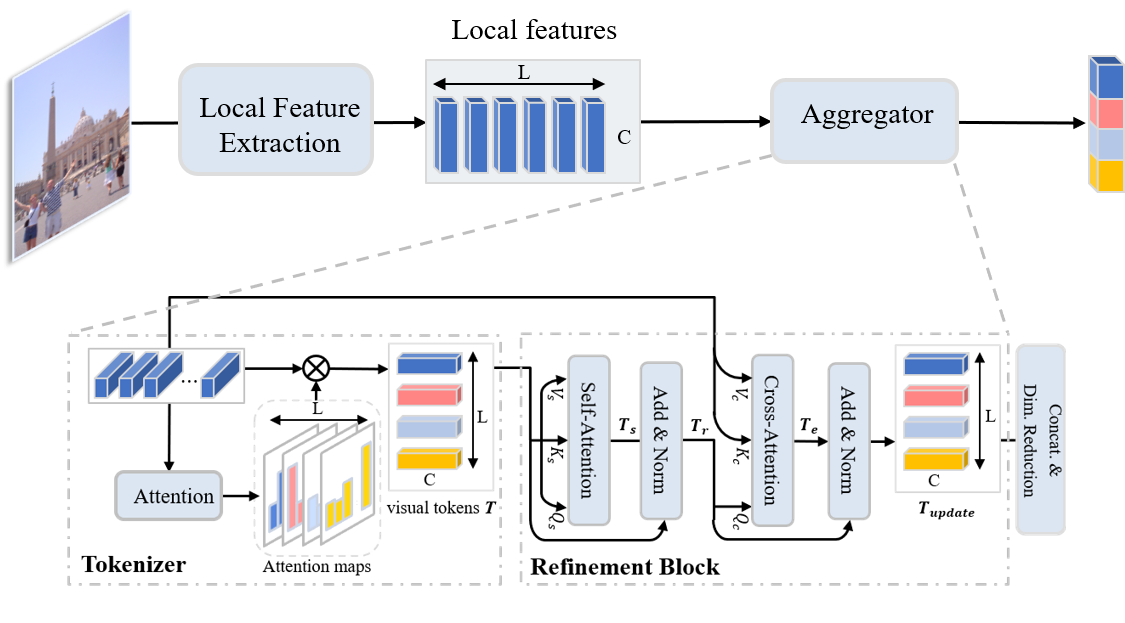
The new framework diagram is shown below. For an image, we extract its local features and aggregate them using our proposed method.

The table below shows the performance comparison between ASMK aggregation and our proposed aggregation method. The ASMK aggregator requires offline clustering to generate large codebooks, and our aggregator requires supervised training, where we utilize the GLDv2 dataset for training.
| Model | ROxf (M) | RPar (M) | ROxf (H) | RPar (H) |
|---|---|---|---|---|
| R50-HOW + ASMK | 79.4 | 81.6 | 56.9 | 62.4 |
| R50-HOW+Ours | 80.7 | 86.5 | 60.9 | 72.0 |
| R101-HOW + ASMK | 80.4 | 85.4 | 62.5 | 70.8 |
| R101-HOW + Ours | 83.2 | 87.7 | 64.8 | 75.3 |
| R50-DELF + ASMK | 67.8 | 76.9 | 43.1 | 55.4 |
| R50-DELF + Ours | 75.2 | 86.0 | 55.0 | 72.2 |
PyTorch training code for Token-based Representation for Image Retrieval. We propose a joint local feature learning and aggregation framework, obtaining 82.3 mAP on ROxf with Medium evaluation protocols. Inference in 50 lines of PyTorch.
What it is. Given an image, Token first uses a CNN and a Local Feature Self-Attention (LFSA) module to extract local features
About the code. Token is very simple to implement and experiment with. Training code follows this idea - it is not a library, but simply a train.py importing model and criterion definitions with standard training loops.
- Python 3
- cuda 11.0
- PyTorch tested on 1.8.0, torchvision 0.9.0
- numpy
- matplotlib
There are no extra compiled components in Token and package dependencies are minimal, so the code is very simple to use. We provide instructions how to install dependencies via conda. Install PyTorch 1.8.0 and torchvision 0.9.0:
conda install -c pytorch pytorch torchvision
Before going further, please check out Google landmarkv2 github. We use their training images. If you use this code in your research, please also cite their work!
Download and extract Google landmarkv2 train and val images with annotations from https://github.com/cvdfoundation/google-landmark.
Download ROxf and RPar datastes with annotations. We expect the directory structure to be the following:
/data/
  ├─ Google-landmark-v2 # train images
  │   ├─ train.csv
  │   ├─ train_clean.csv
  │   ├─ GLDv2-clean-train-split.pkl
  │   ├─ GLDv2-clean-val-split.pkl
  |   └─ train
  └─test # test images
      ├─ roxford5k
      |   ├─ jpg
      |   └─ gnd_roxford5k.pkl
      └─ rparis6k
          ├─ jpg
          └─ gnd_rparis6k.pkl
To train Token on a single node with 4 gpus for 30 epochs run:
sh experiment.sh
A single epoch takes 2.5 hours, so 30 epoch training takes around 3 days on a single machine with 4 3090Ti cards.
We train Token with SGD setting learning rate to 0.01. The refinement block is trained with dropout of 0.1, and linearly decaying scheduler is adopted to gradually decay the learning rate to 0 when the desired number of steps is reached.
To evaluate on Roxf and Rparis with a single GPU run:
python test.py
and get results as below
>> Test Dataset: roxford5k *** local aggregation >>
>> mAP Medium: 82.28, Hard: 66.57

>> Test Dataset: rparis6k *** local aggregation >>
>> mAP Medium: 89.34, Hard: 78.56
We found that there is a change in performance when the test environment is different, for example, when the environment is GeForce RTX 2080Ti with cuda 10.2, pytorch 1.7.1 and torchvision 0.8.2, the test performance is
>> Test Dataset: roxford5k *** local aggregation >>
>> mAP Medium: 81.36, Hard: 62.09

>> Test Dataset: rparis6k *** local aggregation >>
>> mAP Medium: 90.19, Hard: 80.16
Selected qualitative examples of different methods. Top-11 results are shown in the figure. The image with green denotes the true positives and the red bounding boxes are false positives.

