To build an application which generates simulated PV (photovoltaic) power values (in kW)
The picture of a real PV power output curve during a normal day is given as input.
Apparently we have to approximate the function and use it for the simulation.
Looking at visual representation I had two hypothesis:
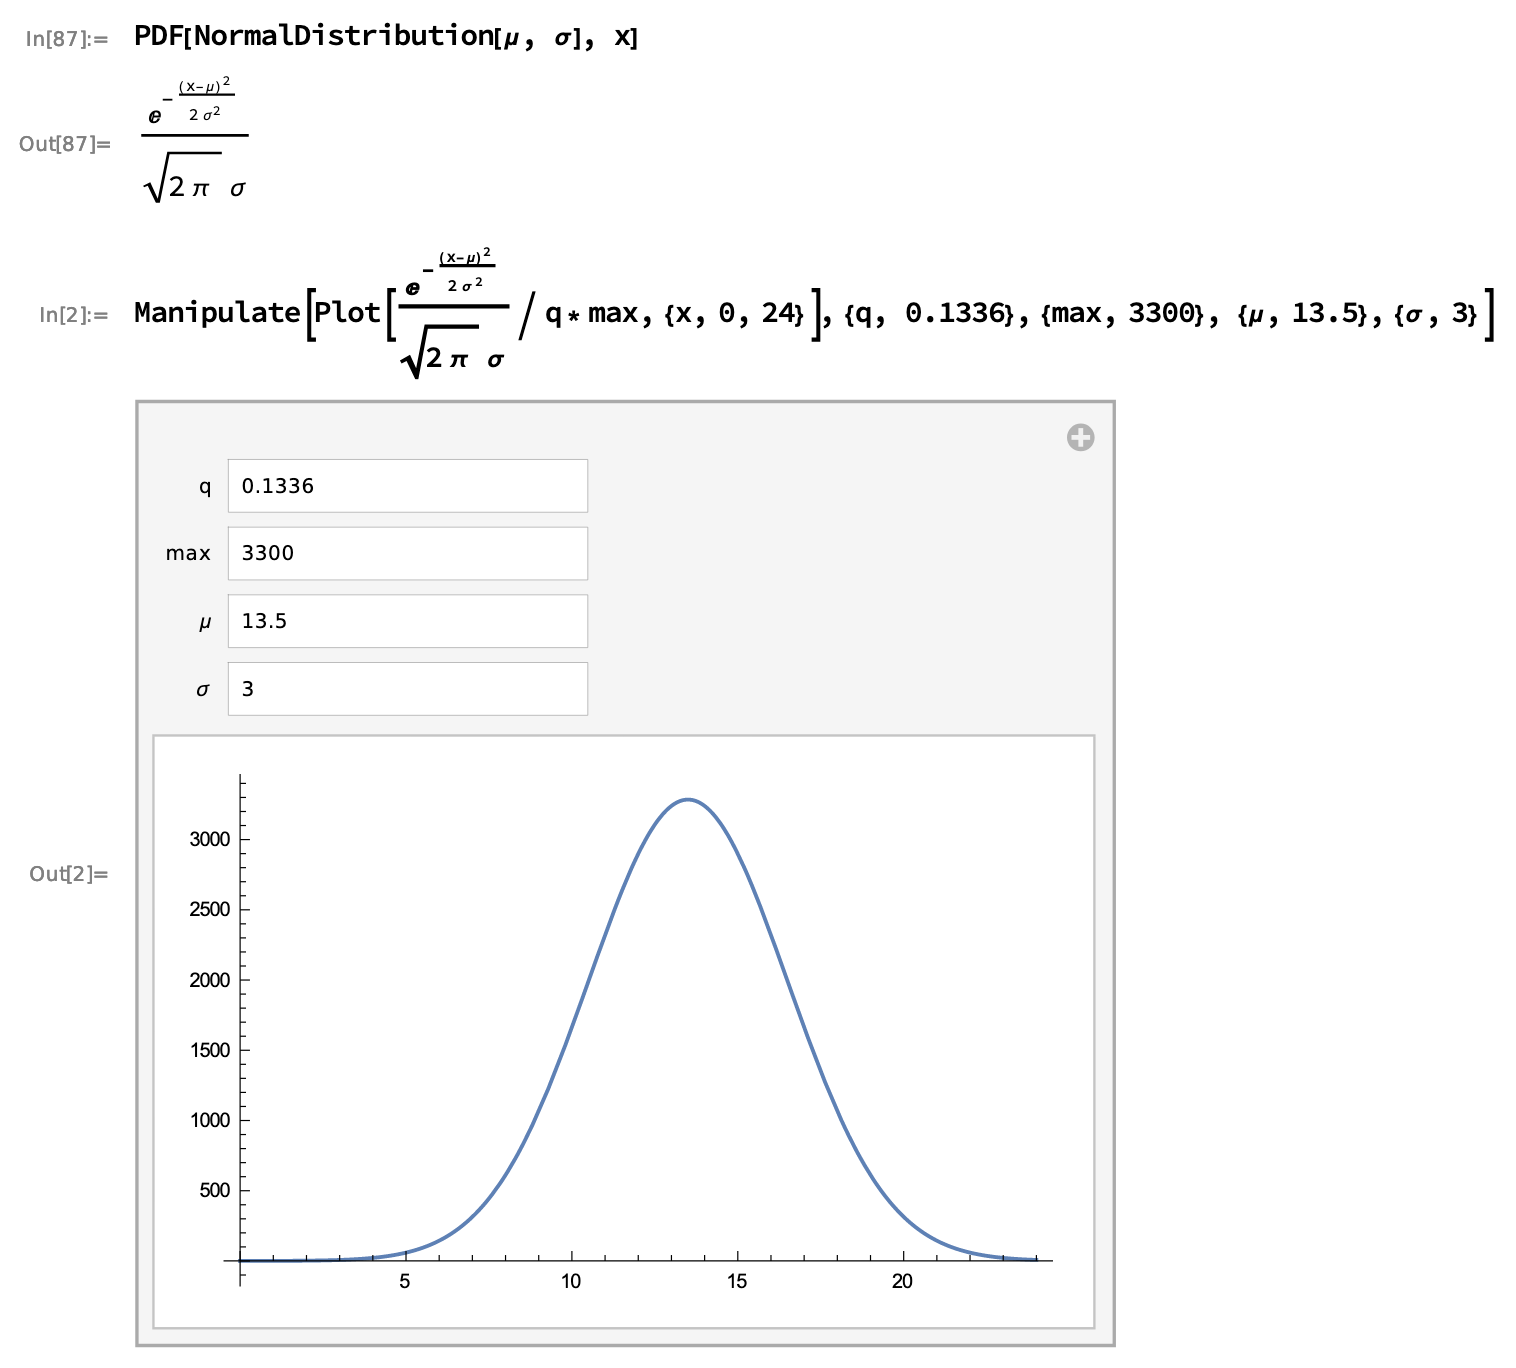
- First (and apparently chosen at the end) impression is that it looks like Gaussian Kernel
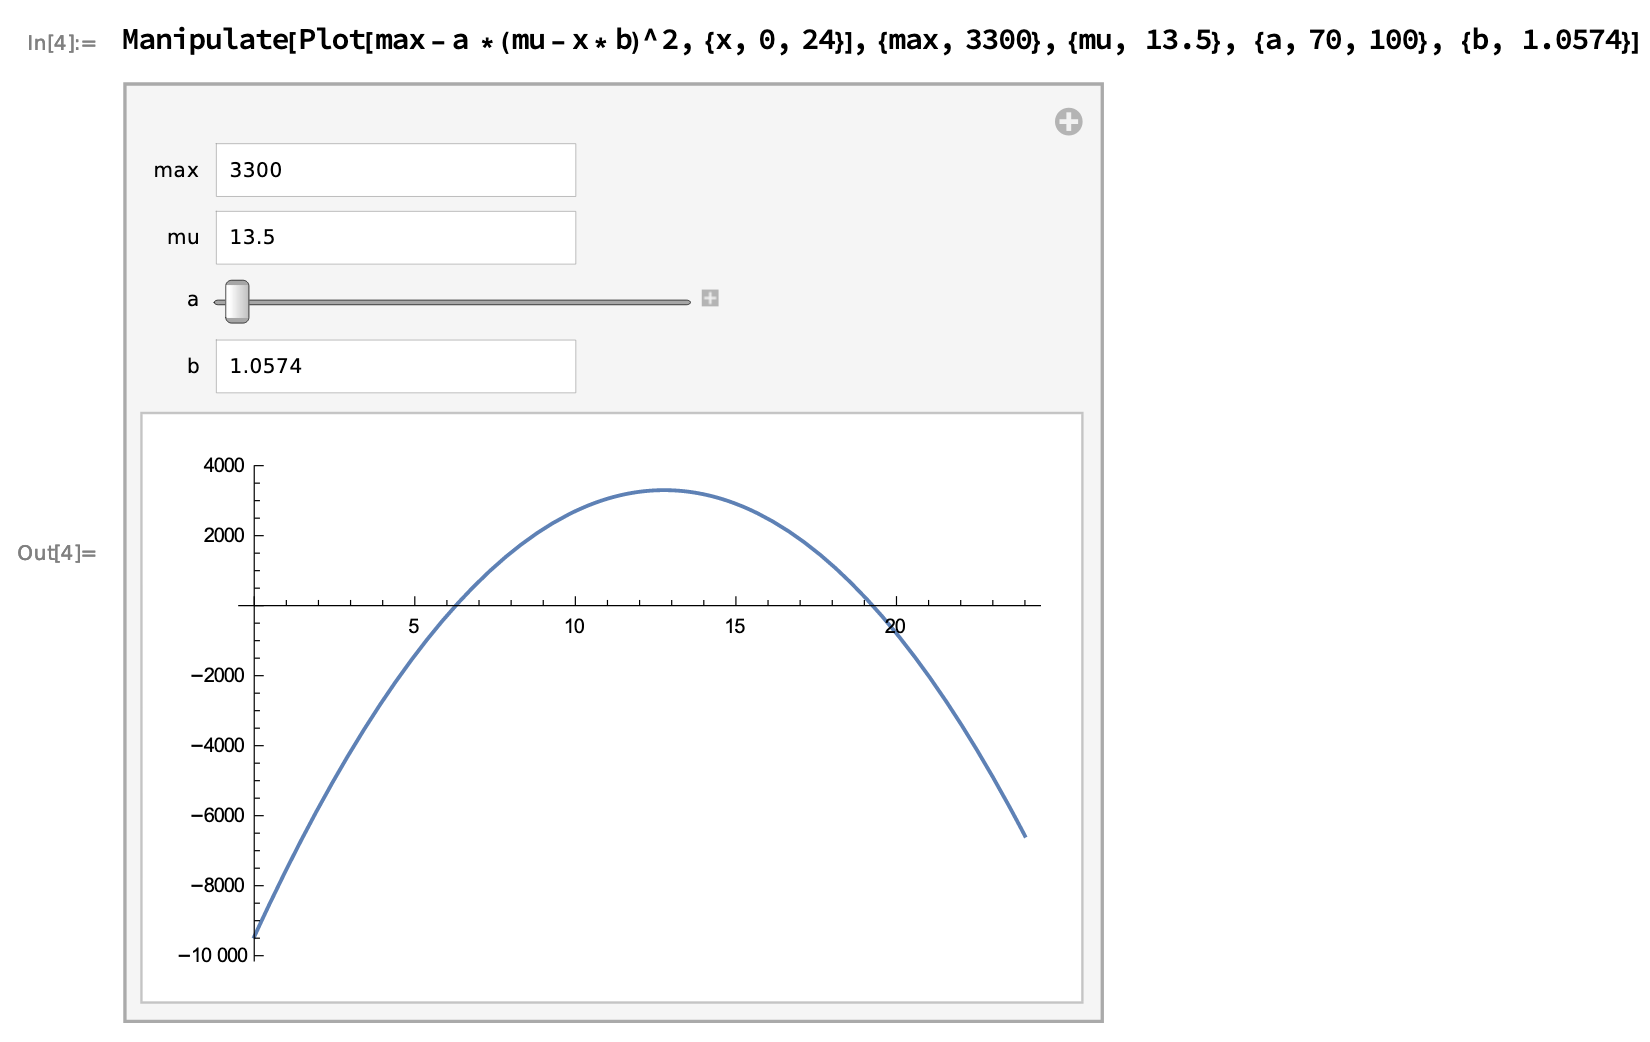
- The first option above is too cuspidal (arrow-headed peak). Next best option was inverted parabola.
The analytical investigation and mathematical experiments in Wolfram Alpha and then Wolfram Cloud resulted in such approximation formulas:
The notes are available as Wolfram Cloud notebook.
The notebook source code.
To ease access it was exported to pdf online and locally
- Gaussian curve
    x = np.arange(0, 24, step, float)
    y = max_value * 1/(sigma * np.sqrt(2 * np.pi)*0.1336) \
* np.exp(- (x - mu)**2 / (2 * sigma**2))- Inverted parabola curve
    x = np.arange(0, 24, step, float)
    y = max_value - 70 * (mu - x * 1.0574) ** 2
After several experiments I gave preference to Gaussian combined with two simple lines (left and right endings) to cut the Gaussian long tails.
The program runs on Python 3, Docker engine, RabbitMQ 3.
The program is written on Python 3.7.5 for Mac and tested on version 3.7.4 for Windows.
To check available Python please run:
python --version
Py files have Shebang line and could run from command line. For example:
cd demo_visual
chmod +x ./visualize.py
./visualize.pyThis folder contains two simple Python scripts to demonstrate RabbitMQ functionality. This is an excellent way to check that RabbitMQ is deployed (via Docker, more and that in another section) with proper credentials and proper version and configuration (very close to default one).
In order to run those two Python 3 scripts (and others in this repository) please ensure your environment has proper dependencies. The simplest way to install the dependencies is to run in local Python Virtual Environment (more on Python install and venv setup in another section) a following command:
pip install -r requirements.txtThe RabbitMQ demo consists of two parts/processes: send.py and receive.py.
send will (hem, well) ... send test messages and respectively receive will receive ones.
The folder contains four shell (bash) scripts in order to automate RabbitMQ related tasks. Of course the proper environment (Docker, shell, Python and the project dependencies) is assumed. The description and a guide for installation are in other sections. Please note that scripts will pull RabbitMQ Docker image if it is absent in local Docker setup.
rabbit_demo.shis entry point to whole demo and will show the whole RabbitMQ demo in this folder by calling other scriptsrabbit_start.shwhen run is starting Docker image of proper version (3.8.1) with default user (user) and default password (Munich19). It setups port mapping (8080:15672 5672:5672). First one is to open RabbitMQ web management console. The second port is for accessing the RabbitMQ instance from host (using default port5672).rabbit_list.shchecks that RabbitMQ container is running in local docker instance and shows allqueuesin the local RabbitMQ instance (in Docker container).rabbit_clear.shstops and removes RabbitMQ container (and its all data and queues of course).
The folder contains two simple Python 3 scripts simulator_function.py and visualize.py.
This folder was used to "play" with mathematical definitions and visualization of hypothesis.
Wolfram|Alpha and then Wolfram Cloud proved to be more powerful and interesting tool for researching and experimenting with math concepts and practical approximations. The Wolfram Cloud notebooks and related exports are explained in another section.
simulator_function.pycontains code and comments used to approximate the PV emulator function. The script usesnumpywhich is installed with help ofrequirements.txtdescribed indemo_rabbitfolder section. Of course you are free to setup your environement independently.visualize.pymakespyplotplot of the simulator function fromsimulator_function.py.scipy.statsis used to play with "original" Gaussian PDF (probability density function)norm.ppf.
is used to store pictures which illustrate this Guide.
This folder contains "main" results for this little task.
.gitignoreis options for git/GitHub to ignore unnecessary files.FunctionApproximationByWolframCloud.pdfis an export from Wolfram Cloud notebook which perfectly shows graphs if the notebook is not accessible by whatever reason. This makes the repo self-sufficient.README.mdis this Guide itself.requirements.txtispipway to manage Python dependencies.
Next two files are "the most important" ones in this repository.
Assuming that the environment is setup properly (Python 3, venv, dependencies, Docker engine, RabbitMQ docker container and RabbitMQ credentials) these files "demonstrate" to console PV Simulator messages worth of 24 hours. Those messages are handled and stored to file results.csv as requested.
meter.pyconnects to RabbitMQ instance (which is setup using scriptdemo_rabbit/rabbit_start.sh). Then generates messages with randompower_valueandtimestampstarting fromnowand for 24 hours in future every "couple seconds" (2 seconds exactly).pv_simulator.pyconnects to RabbitMQ instance ans sets a callback to listen incoming messages. Those messages are stored to file. Each message is stored as text line in the requested format with opening for append the result fileresults.csvand closing OS file handler after 1 message/row. This simplistic approach has to be changed for production e.g. batching messages handling (prefetch_count) and batching write to file. Of course production case must use multiple consumers to load balance and scale out purposes eliminating SPoF (single point of failure) as well.
As mentioned through the Guide this implementation is only to cover bare minimum of the task.
Enjoying my unlimited time frame I plan:
- make multiple consumers
- each consumer handling several messages at once
- each consumer is running as a container (Docker or other for fun)
- make
meteras a container as well - setup K8s to orchestrate several
meters and several consumers (pv_simulator) - setup a Public Cloud environment for K8s (Azure or AWS depending where I have free subscription left)
- setup CI/CD pipeline to implement GitOps flow for the project
- examine security angles, make pentest, and implement DevSecOps practices
All this I am planning to do just for fun. It's more like DevOps or Security Officer than Development.

