Slide Deck from this CITE 2021 Conference Workshop How to get started and utilize visual dashboards using Power BI
-
Download the following files using your browser:
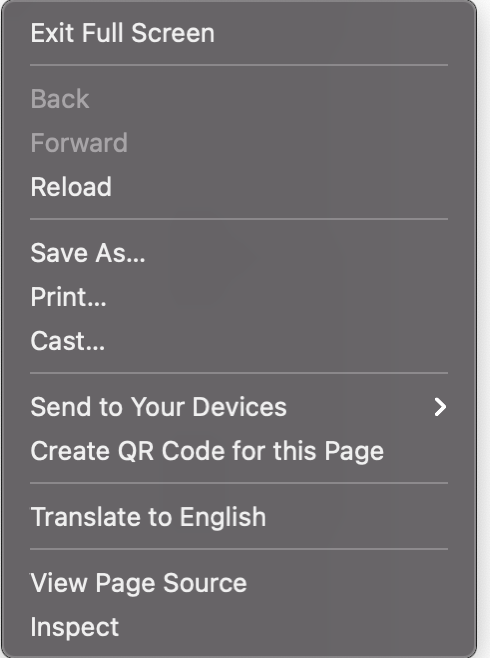
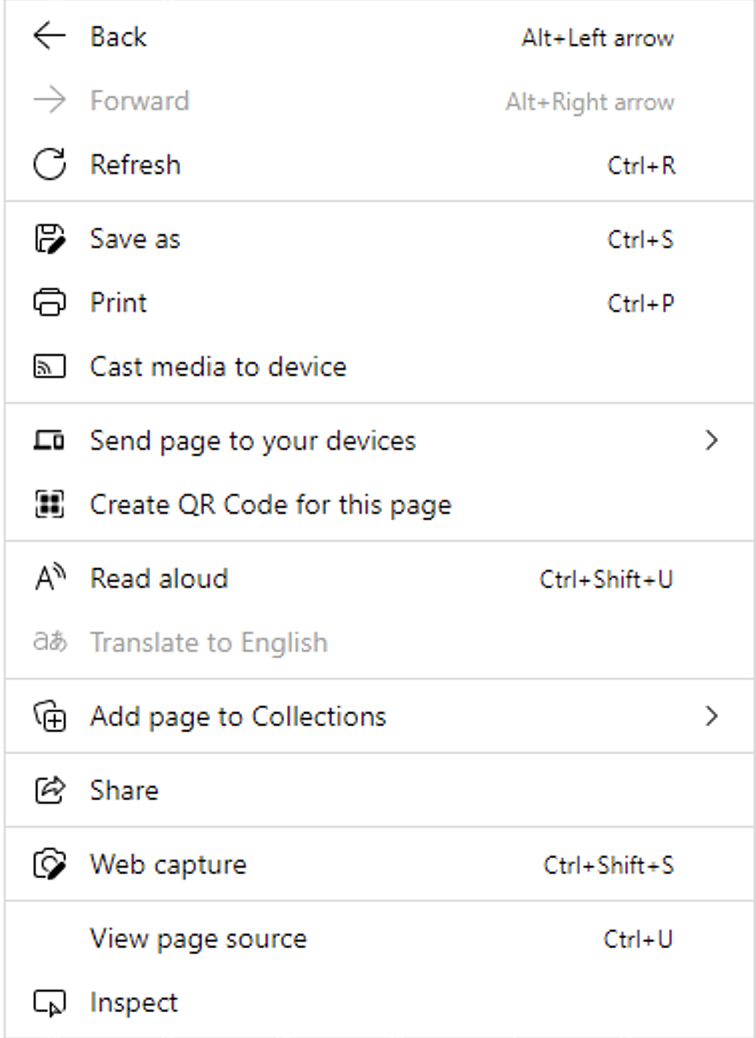
Right click, select Save As, and save to Desktop or other location.
Chrome
Edge
To look at the structure of the files refer to the file structure
-
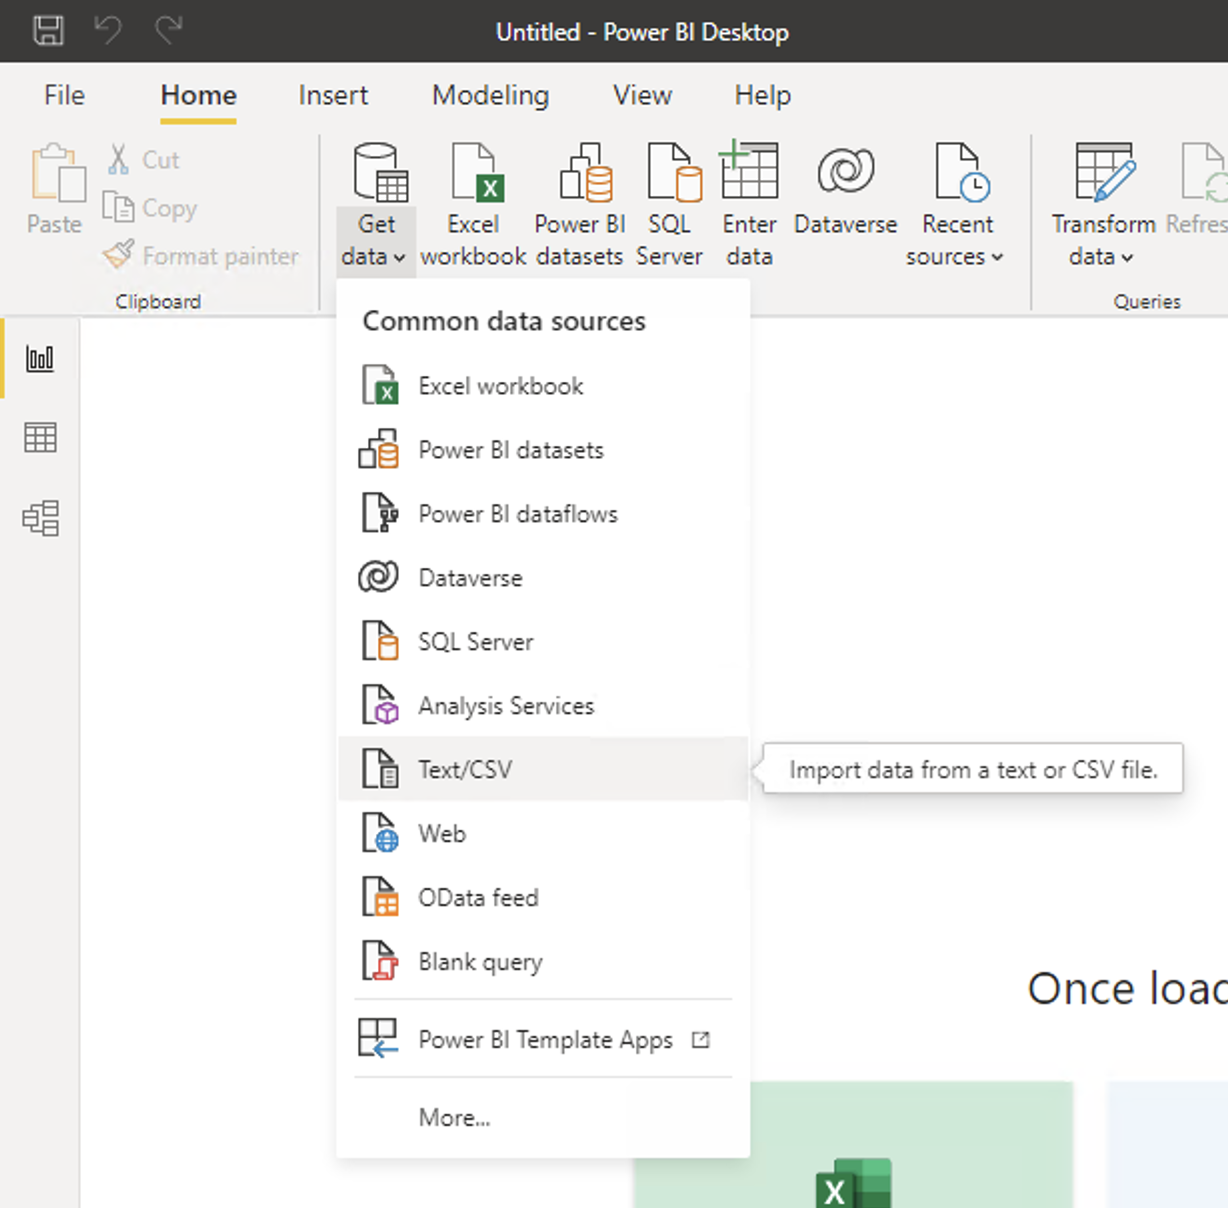
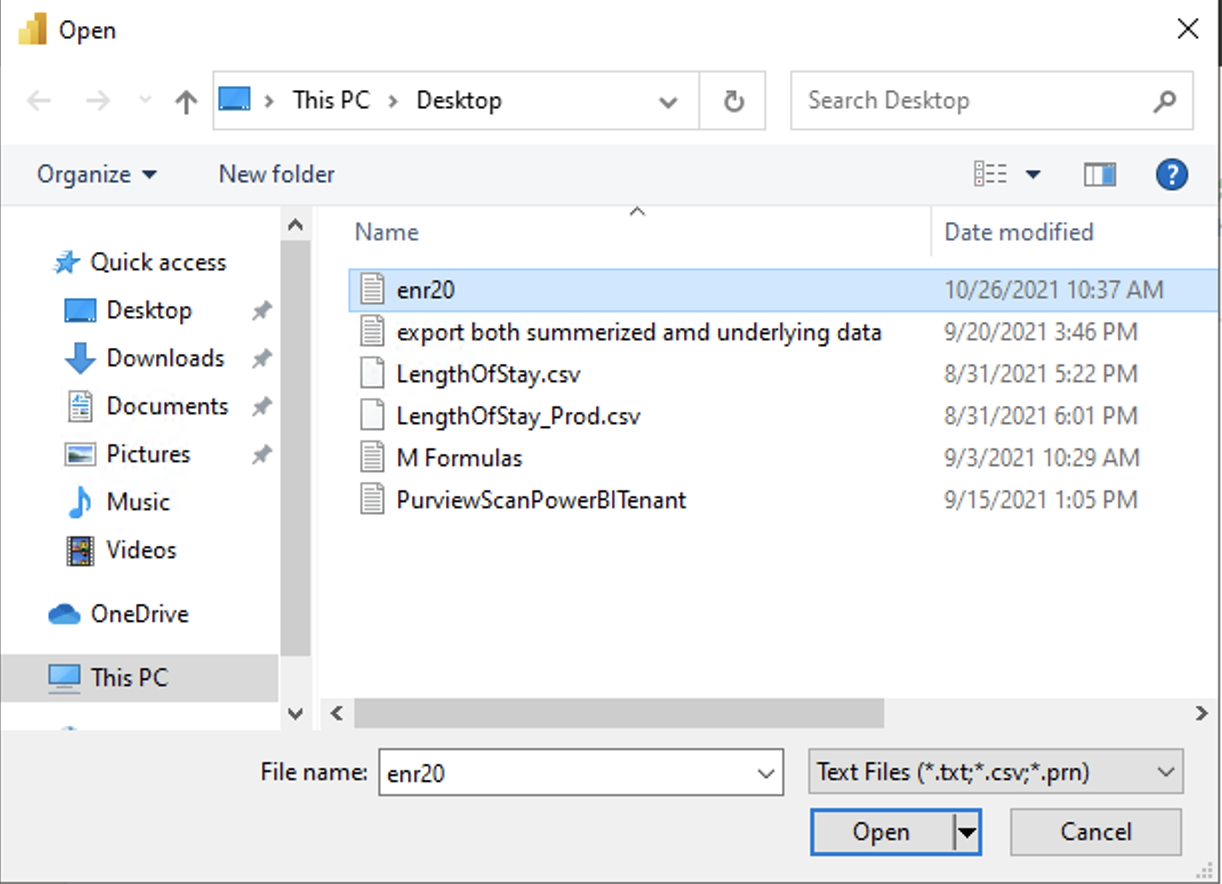
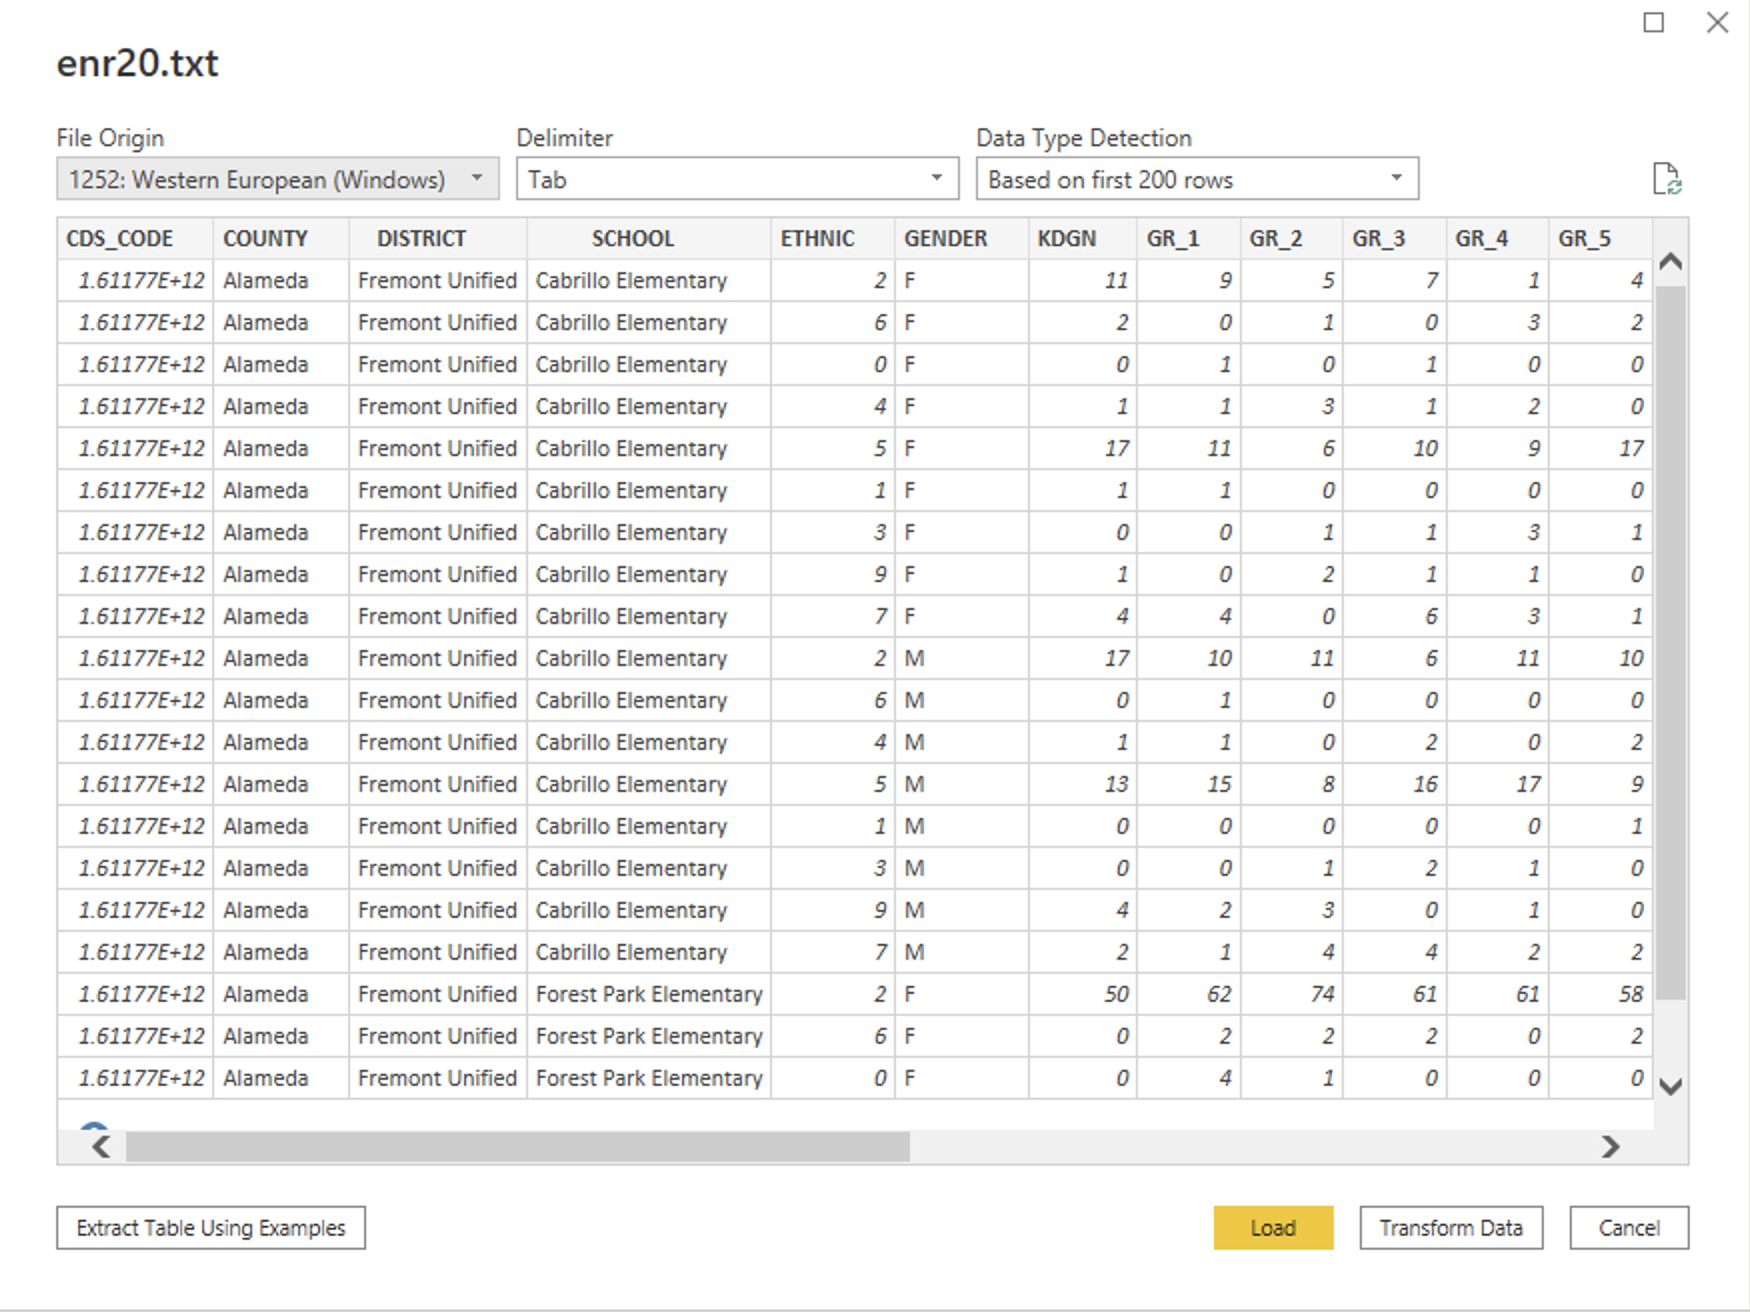
Import the file into Power BI Desktop
-
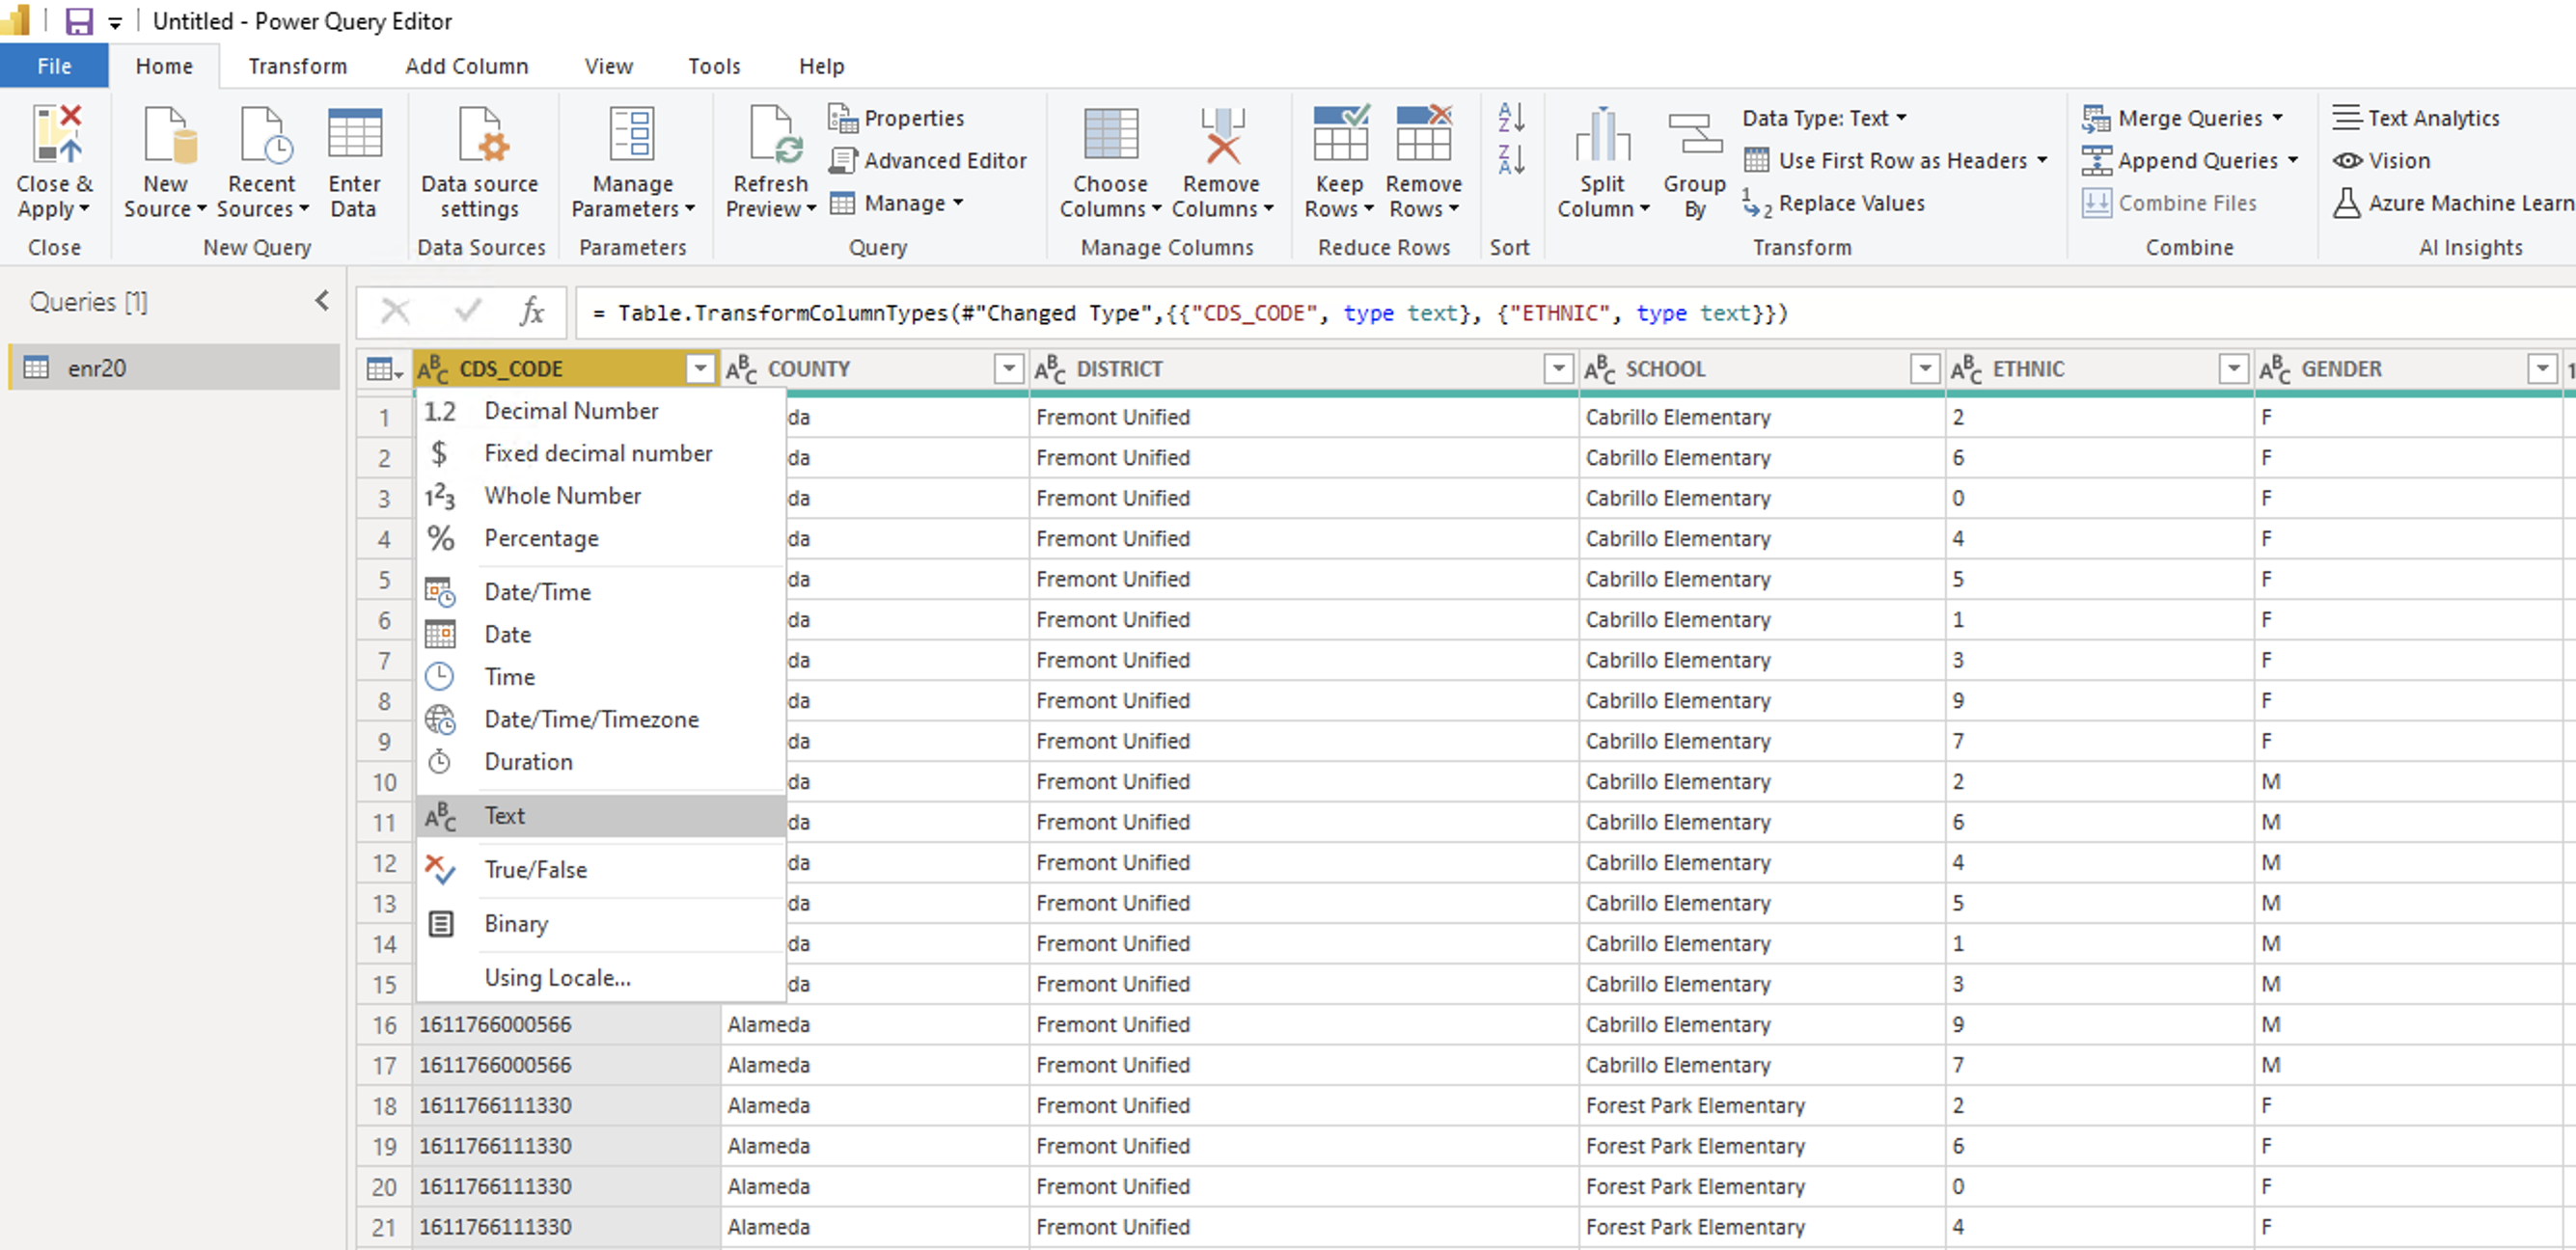
Transform the datatypes of columns in the file
-
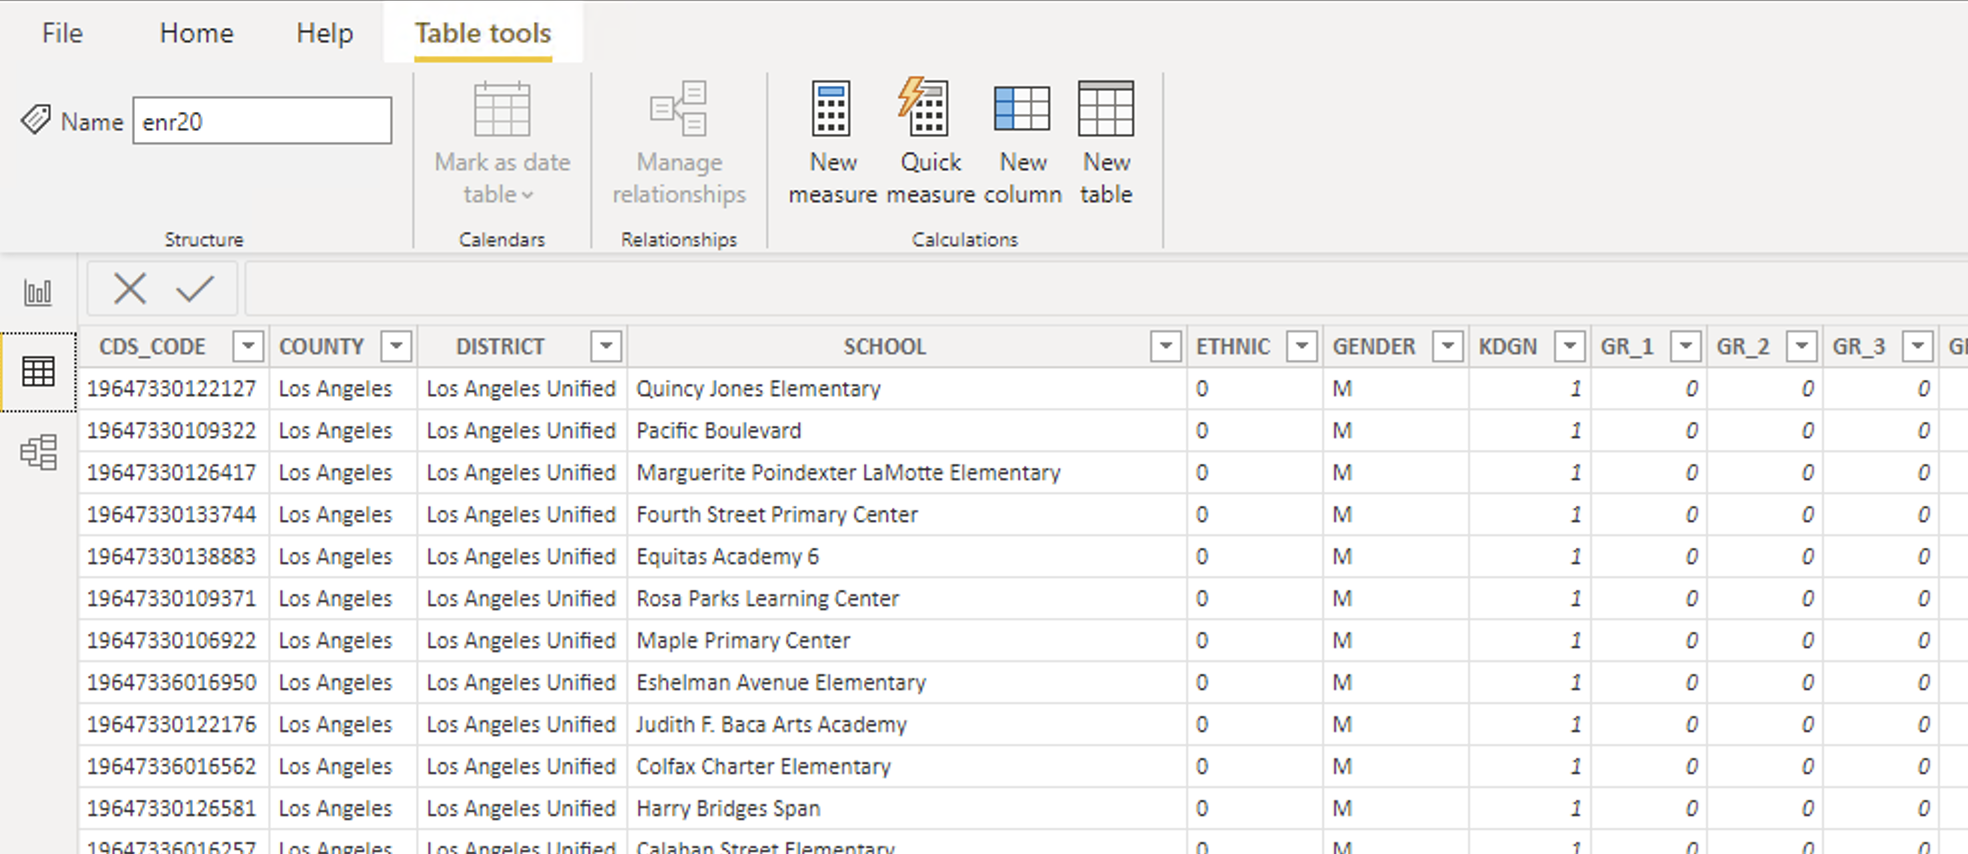
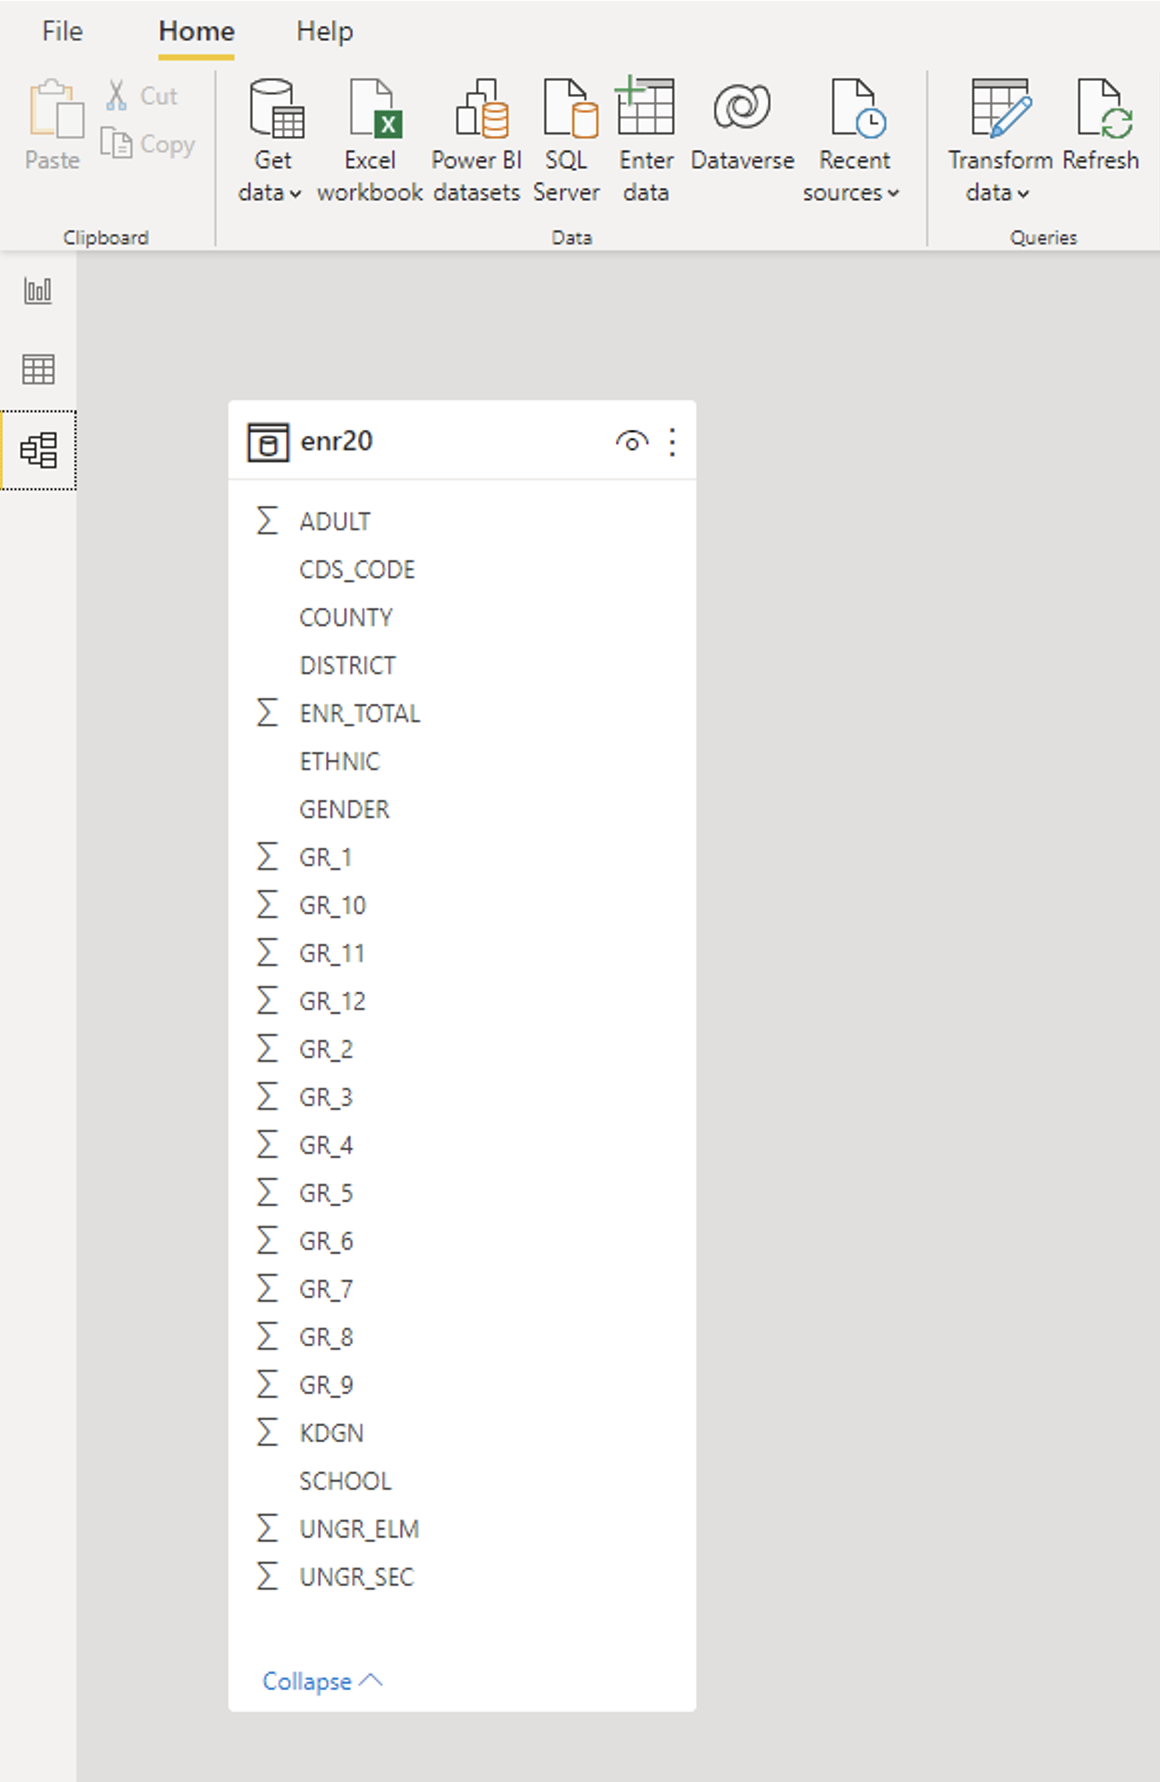
Review the Data and Model tabs
-
Transform the data by creating a new dataset with breakdown by Elementary School (K through 4), Middle School (5 through 8), and High School (9 through 12)
-
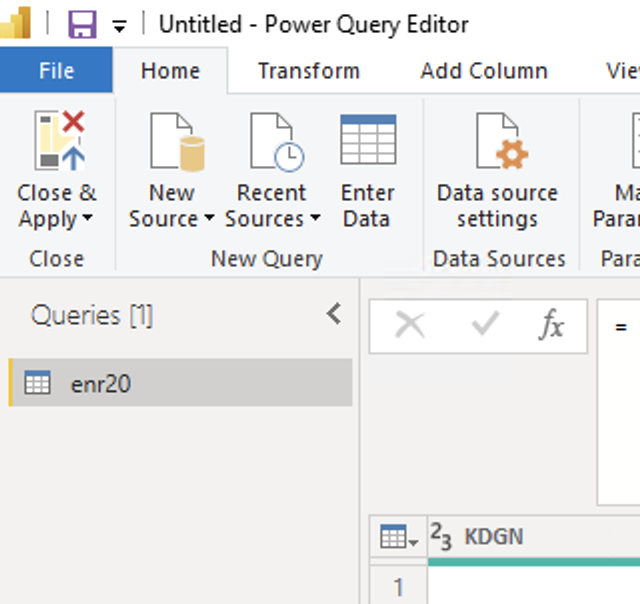
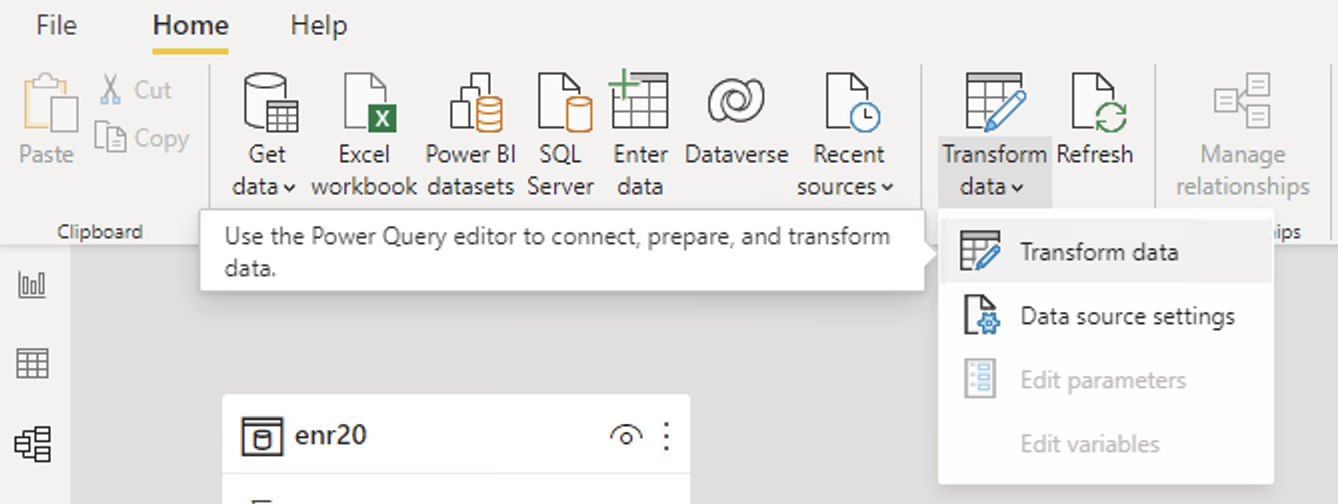
Click on the Transform data button on the Model or Report tab and select Transform data
-
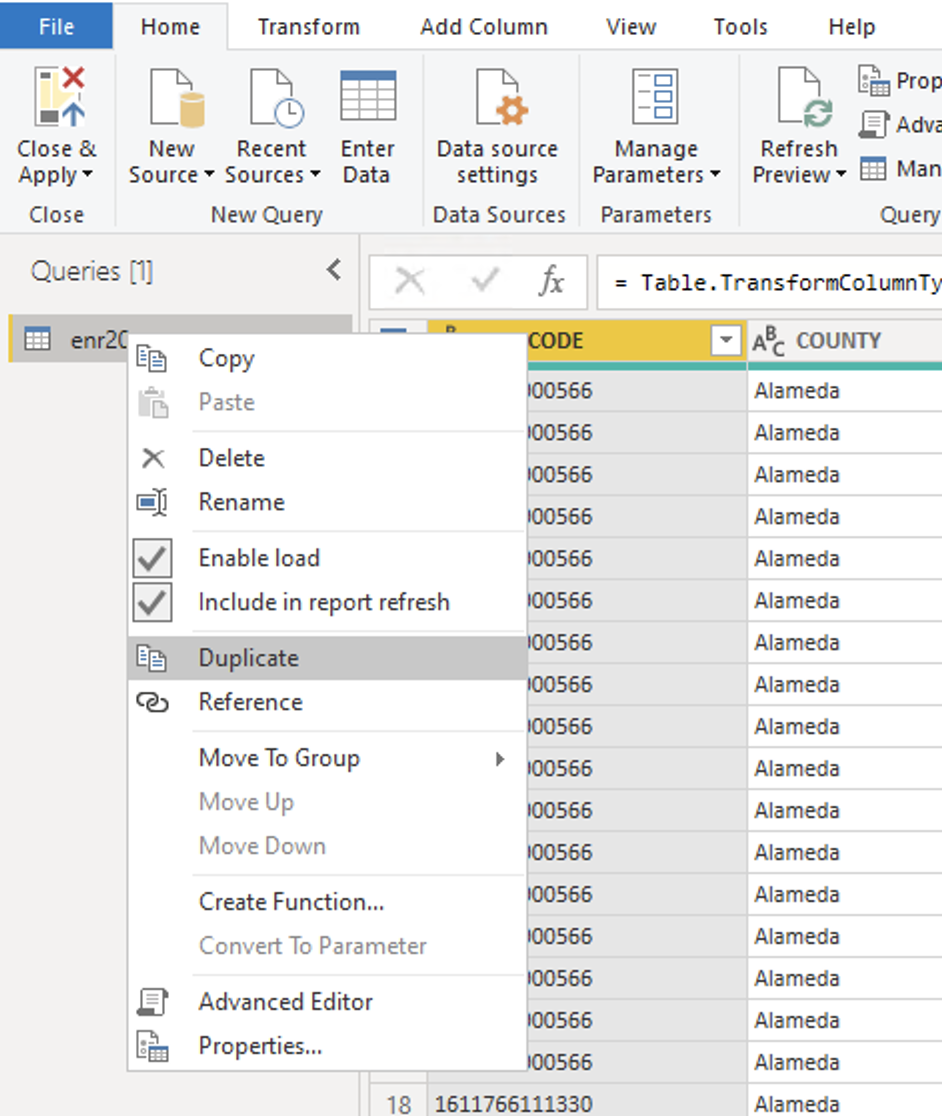
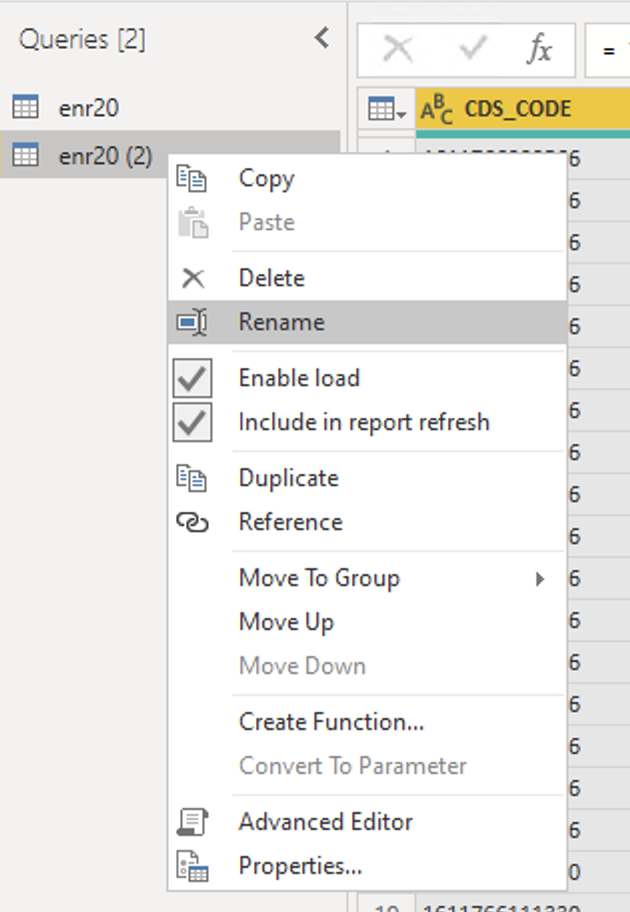
Right click on the enr20 query and select Duplicate
-
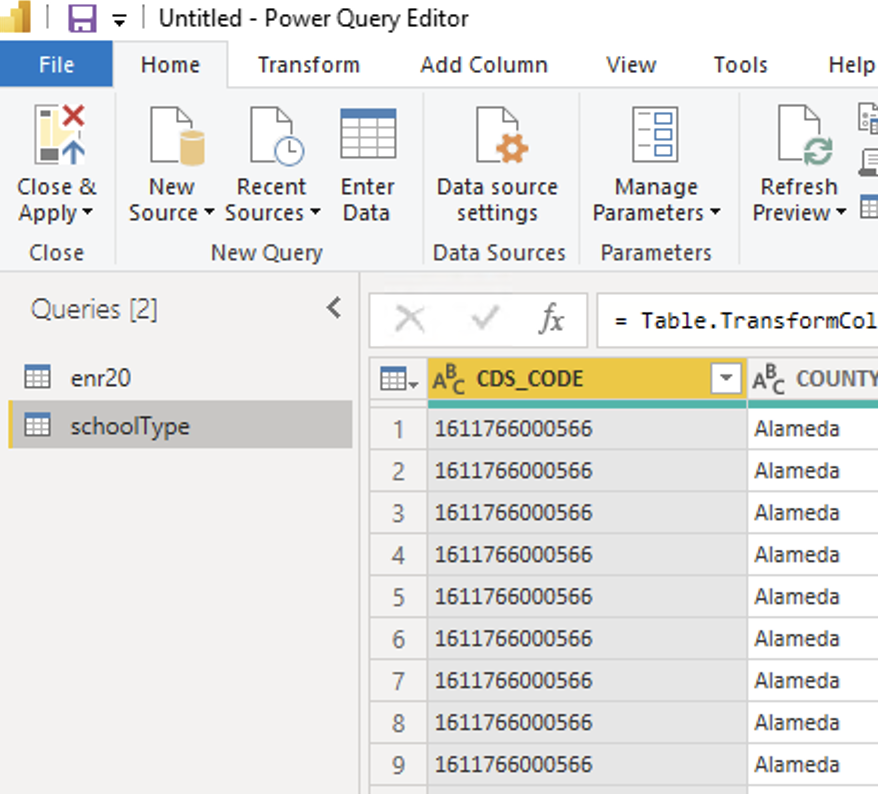
Right click on the enr20 (2) query and select Rename to change its name to schoolType
-
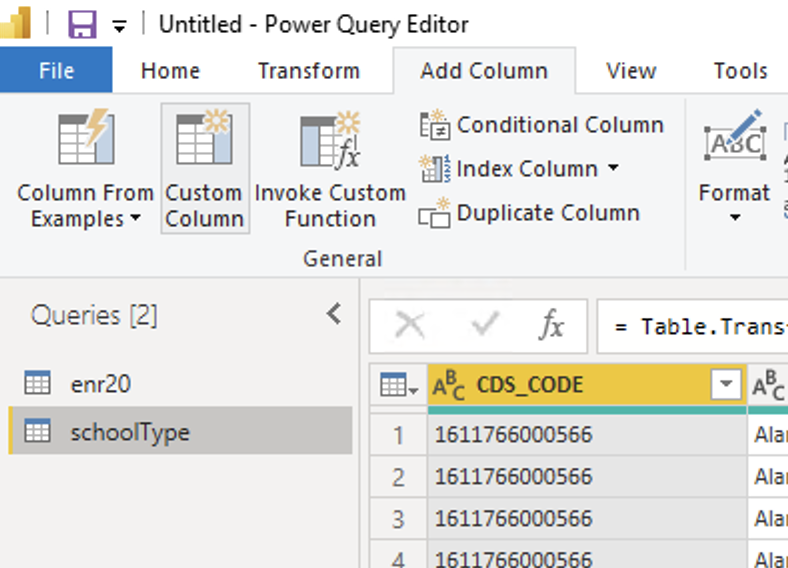
With schoolType highlighted select Add Column
-
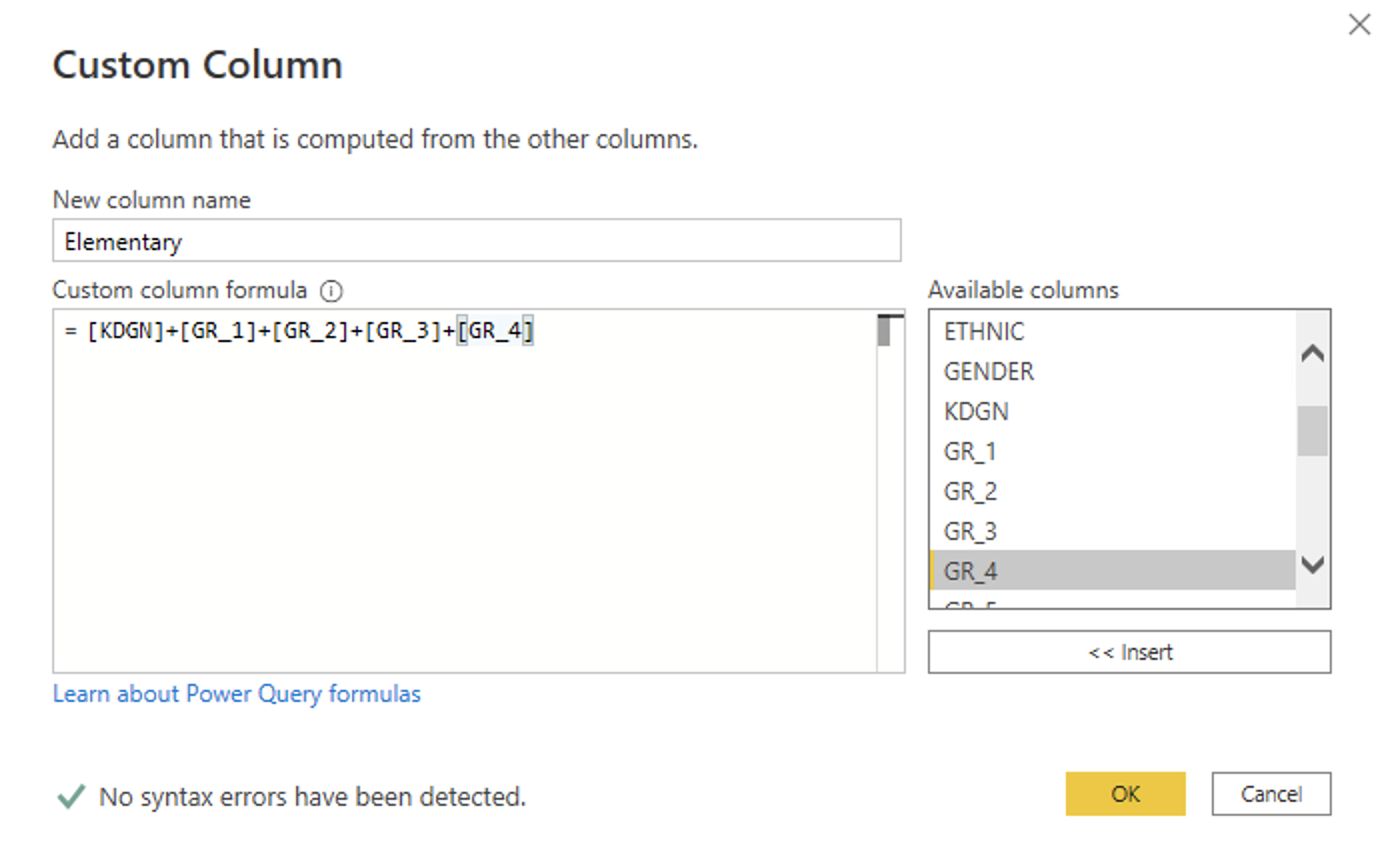
Select Custom Column and enter
New column name:
ElementaryCustom column formula:
[KDGN]+[GR_1]+[GR_2]+[GR_3]+[GR_4] -
Click OK
-
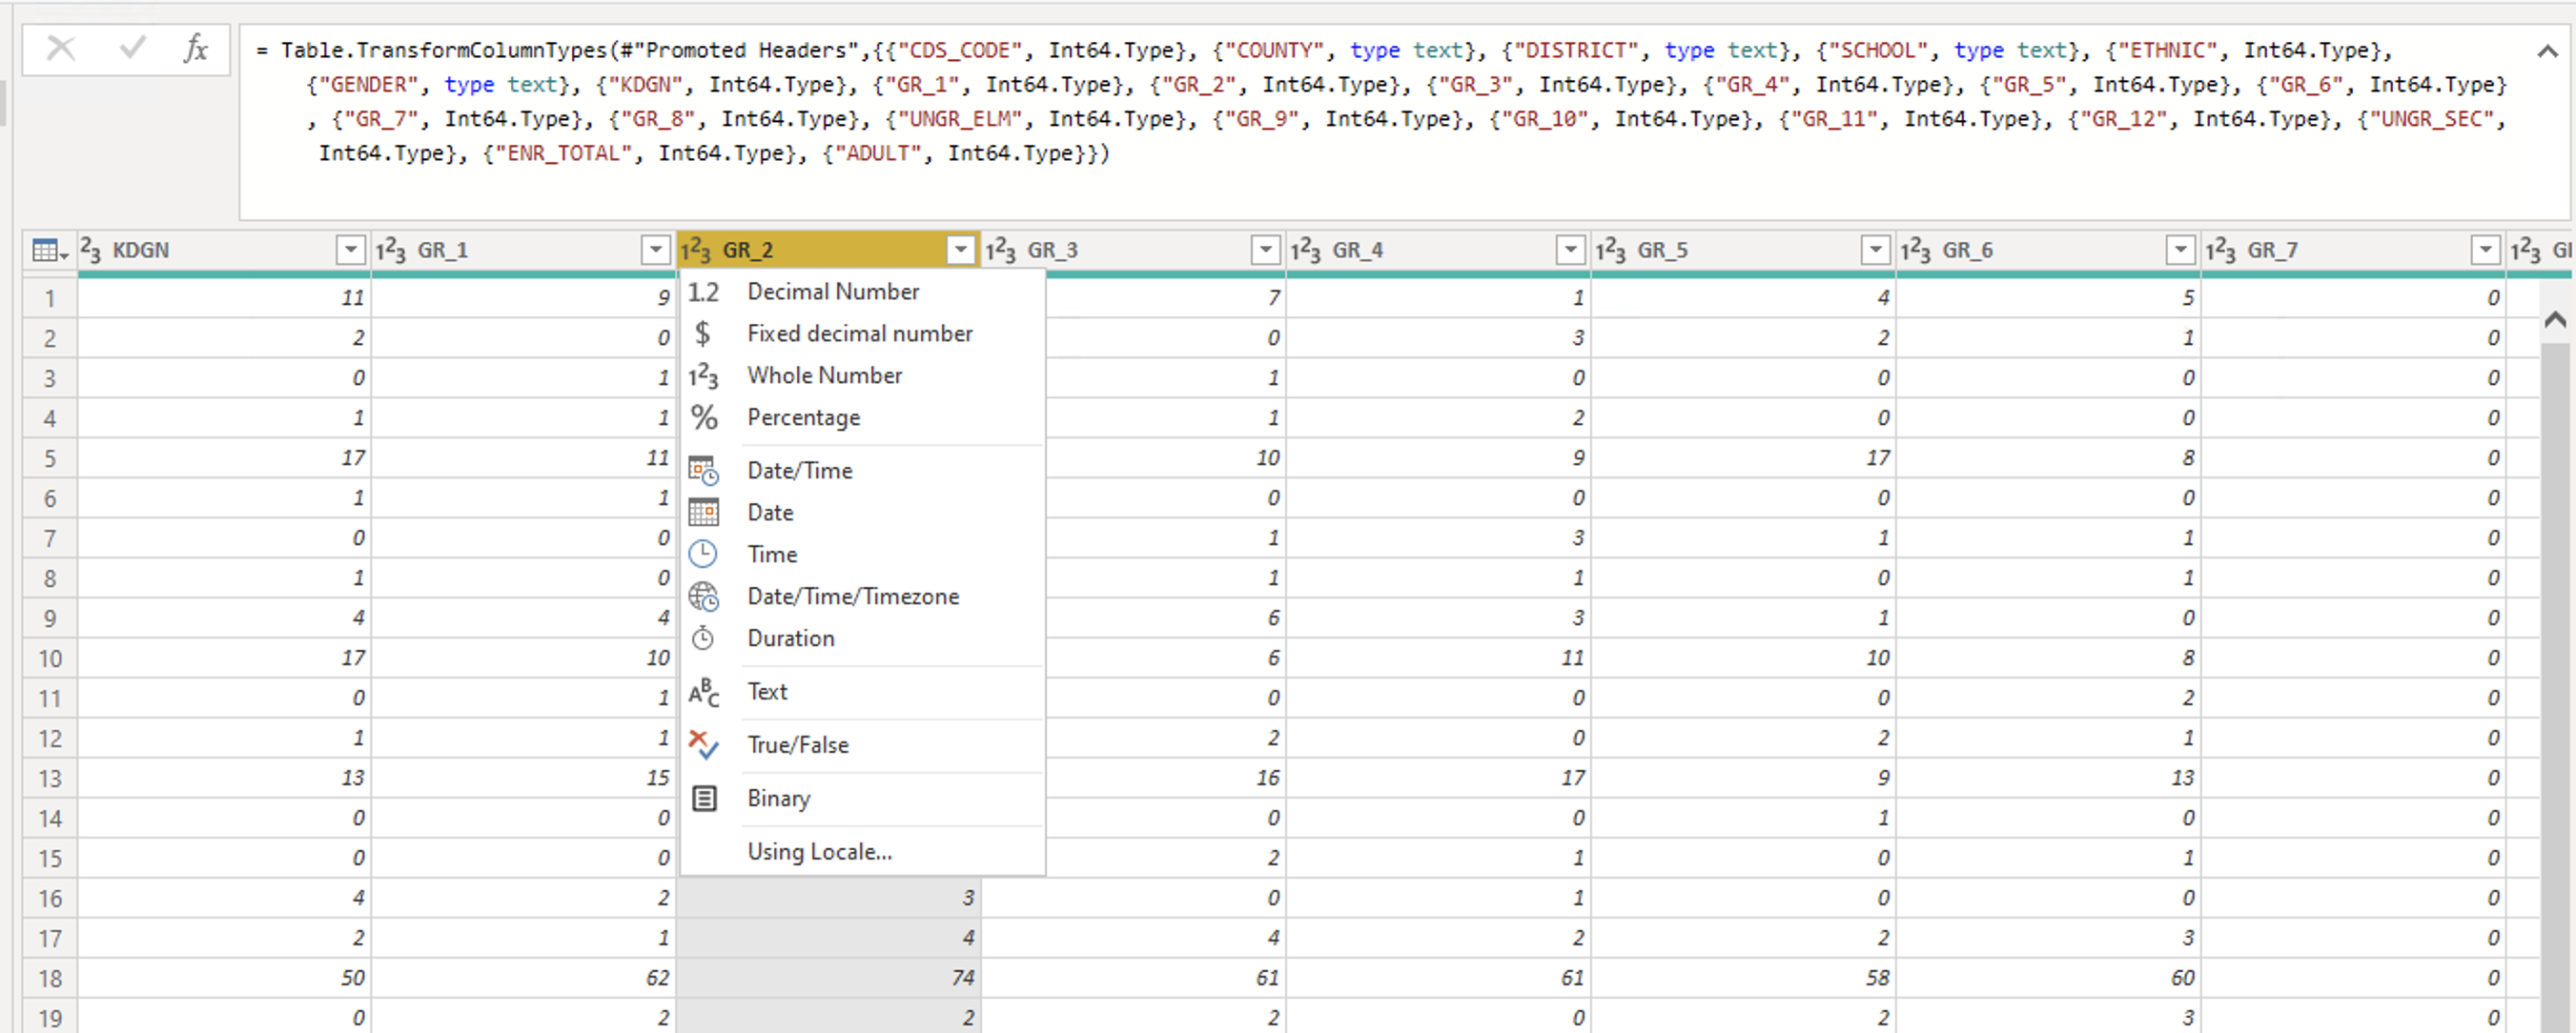
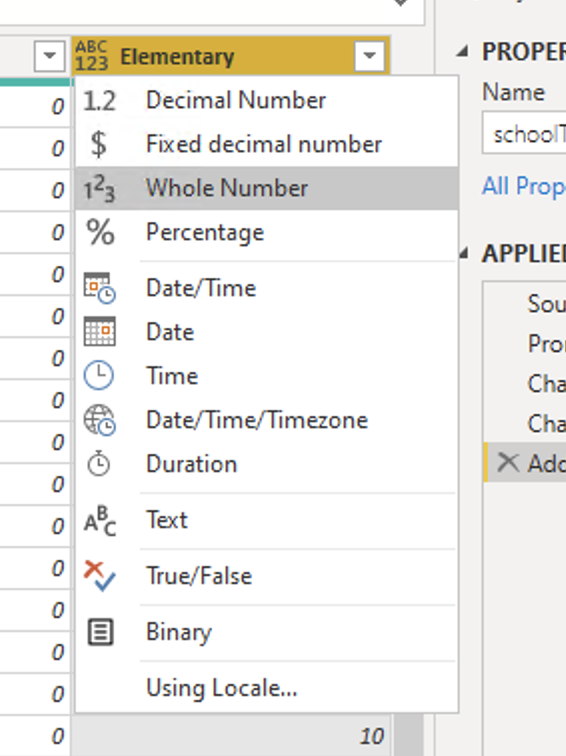
Make sure the data type for the new Elementary column is set to Whole Number
-
Select Custom Column and create two more columns:
A) Middle School
New column name:
MiddleCustom column formula:
[GR_5]+[GR_6]+[GR_7]+[GR_8]B) High School
New column name:
HighCustom column formula:
[GR_9]+[GR_10]+[GR_11]+[GR_12] -
Make sure the data type for the new Middle and High columns are set to Whole Number
-
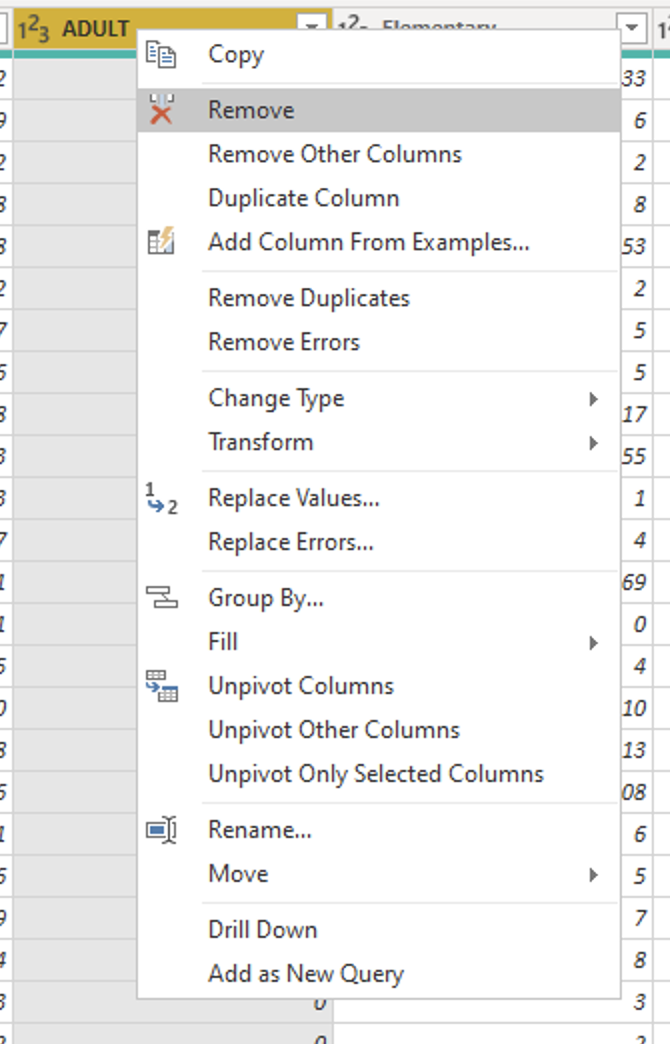
Remove the ADULT Column
-
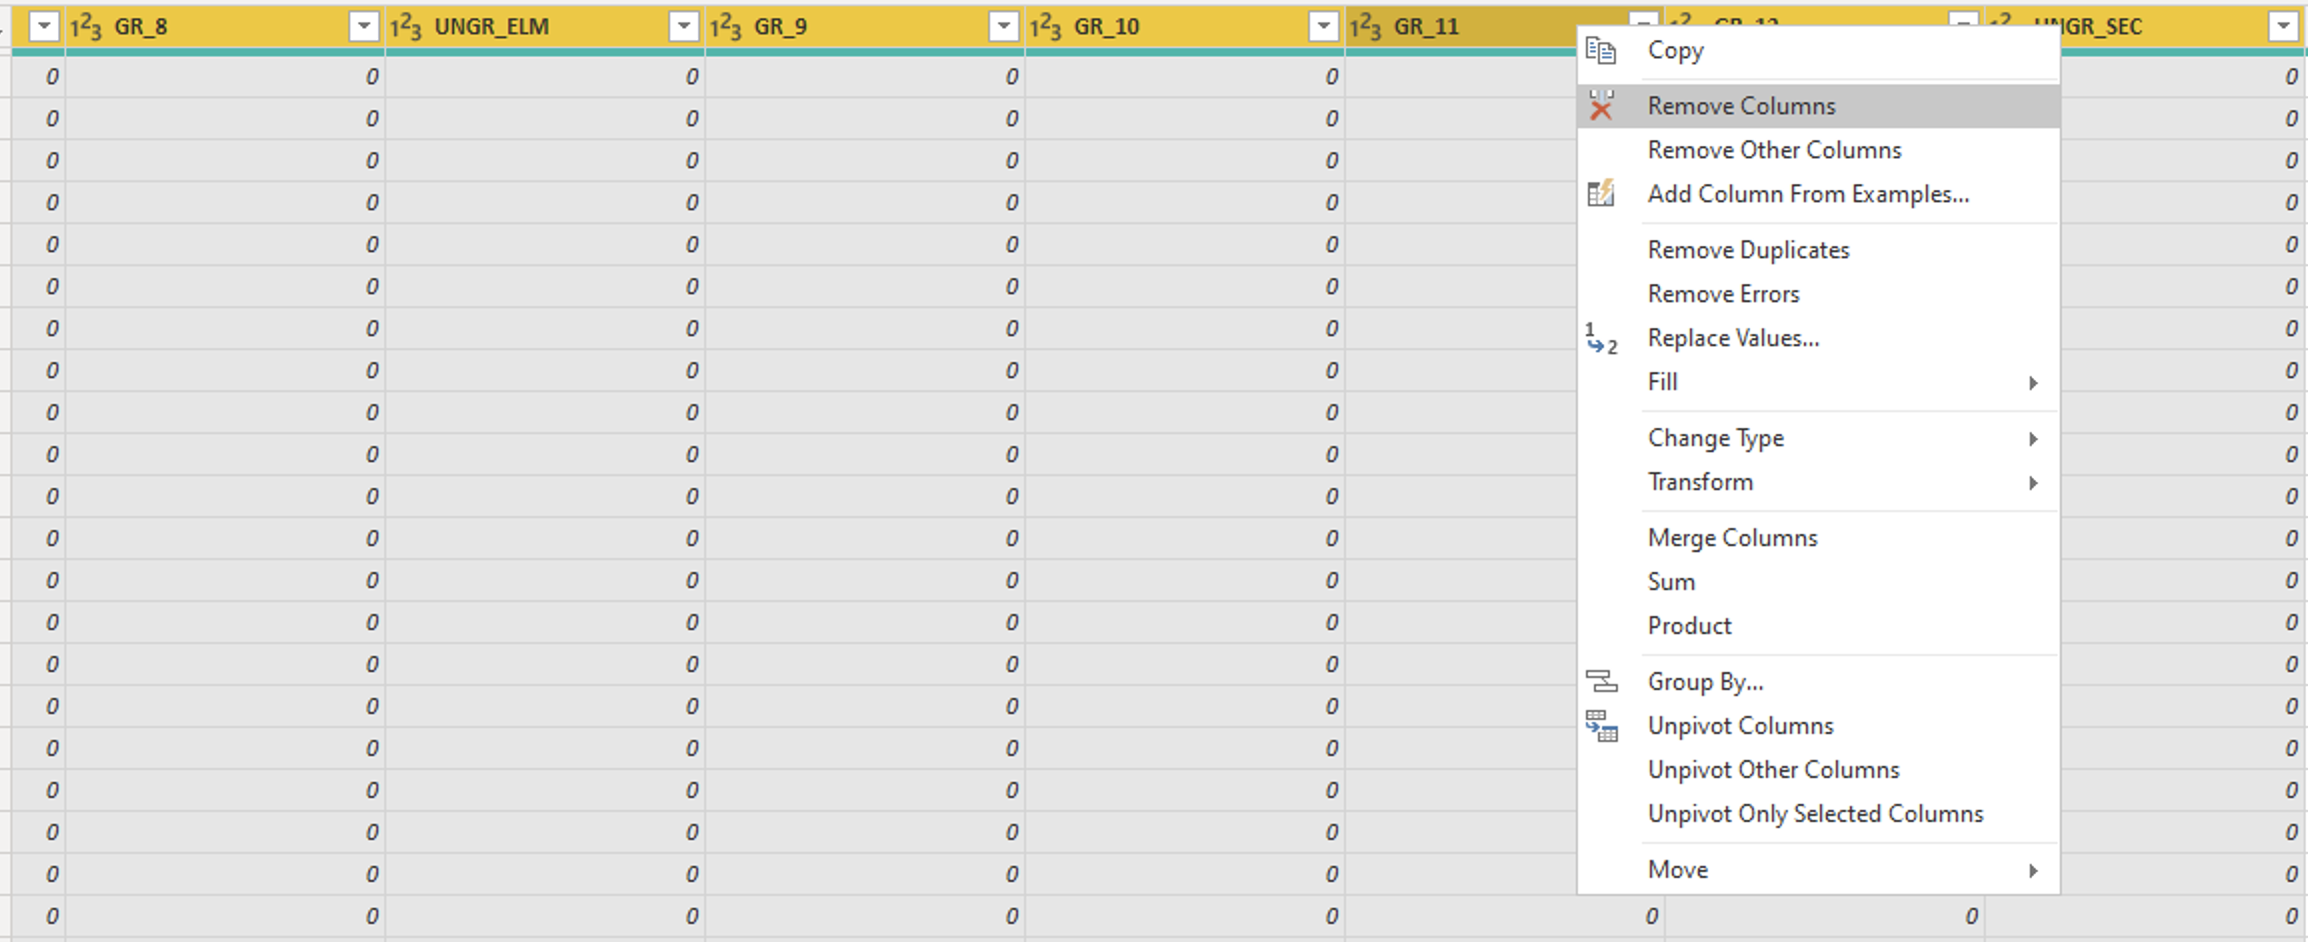
Remove all the Grade Columns. Select KDGN and hold down the shift key and then select UNGR_SEC. This will select all the columns between and including KDGN and UNGR_SEC
-
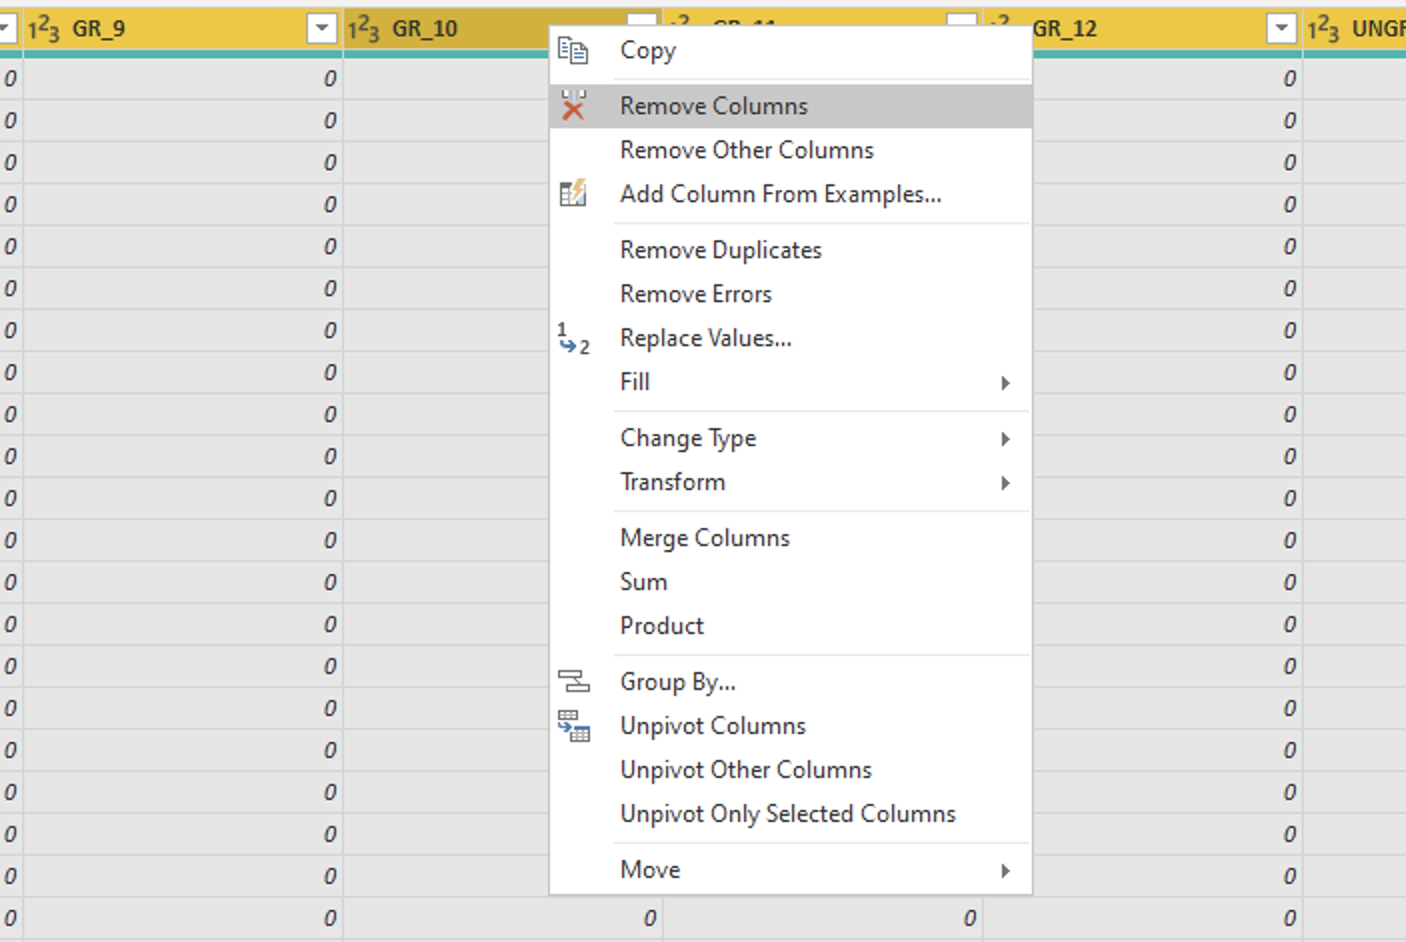
Right click on the yellow bar and select Remove Columns
-
The remaining Columns should be: CDS_CODE", "COUNTY", "DISTRICT", "SCHOOL", "ETHNIC", "GENDER", "ENR_TOTAL", "Elementary", "Middle", "High"
-
Click Close & Apply. This is what it looks like in the Data tab
-
-
Add in the descriptions for Ethnic Codes
-
Click on the Transform data button on the Model or Report tab and select Transform data
-
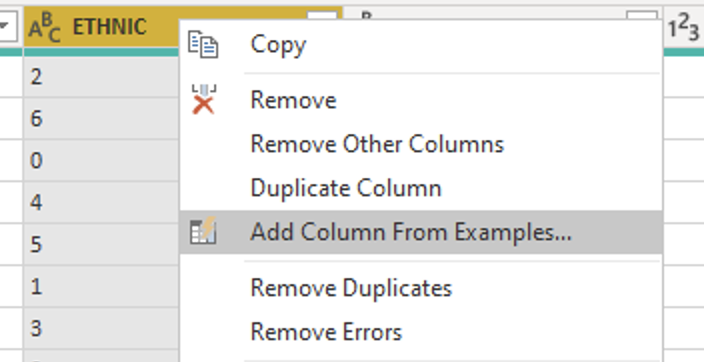
Click on the schoolType query and select the ETHNIC column and right click and choose Add Column From Examples
-
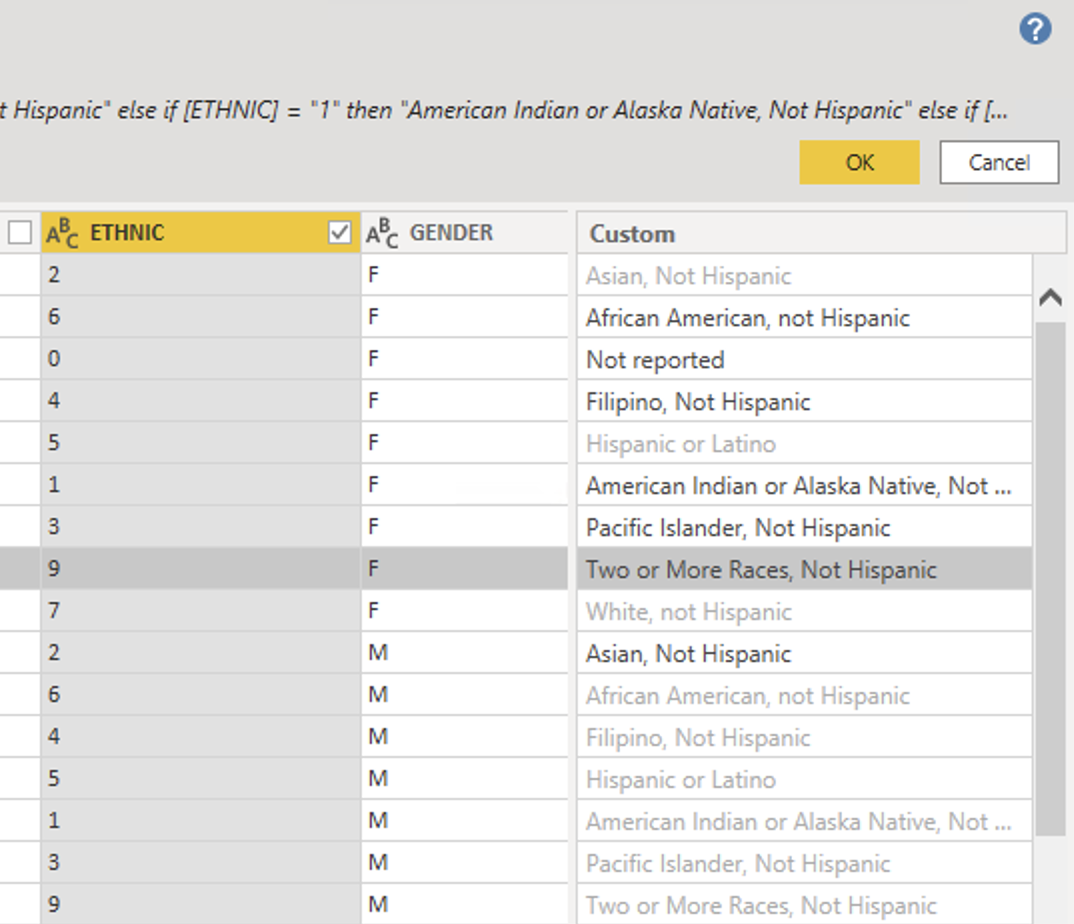
Look for the Racial/ethnic designation
-
Copy and paste the descriptions to the codes and click OK
-
Name the Custom Columnn "EthnicDesignation"
-
Click Close & Apply
-
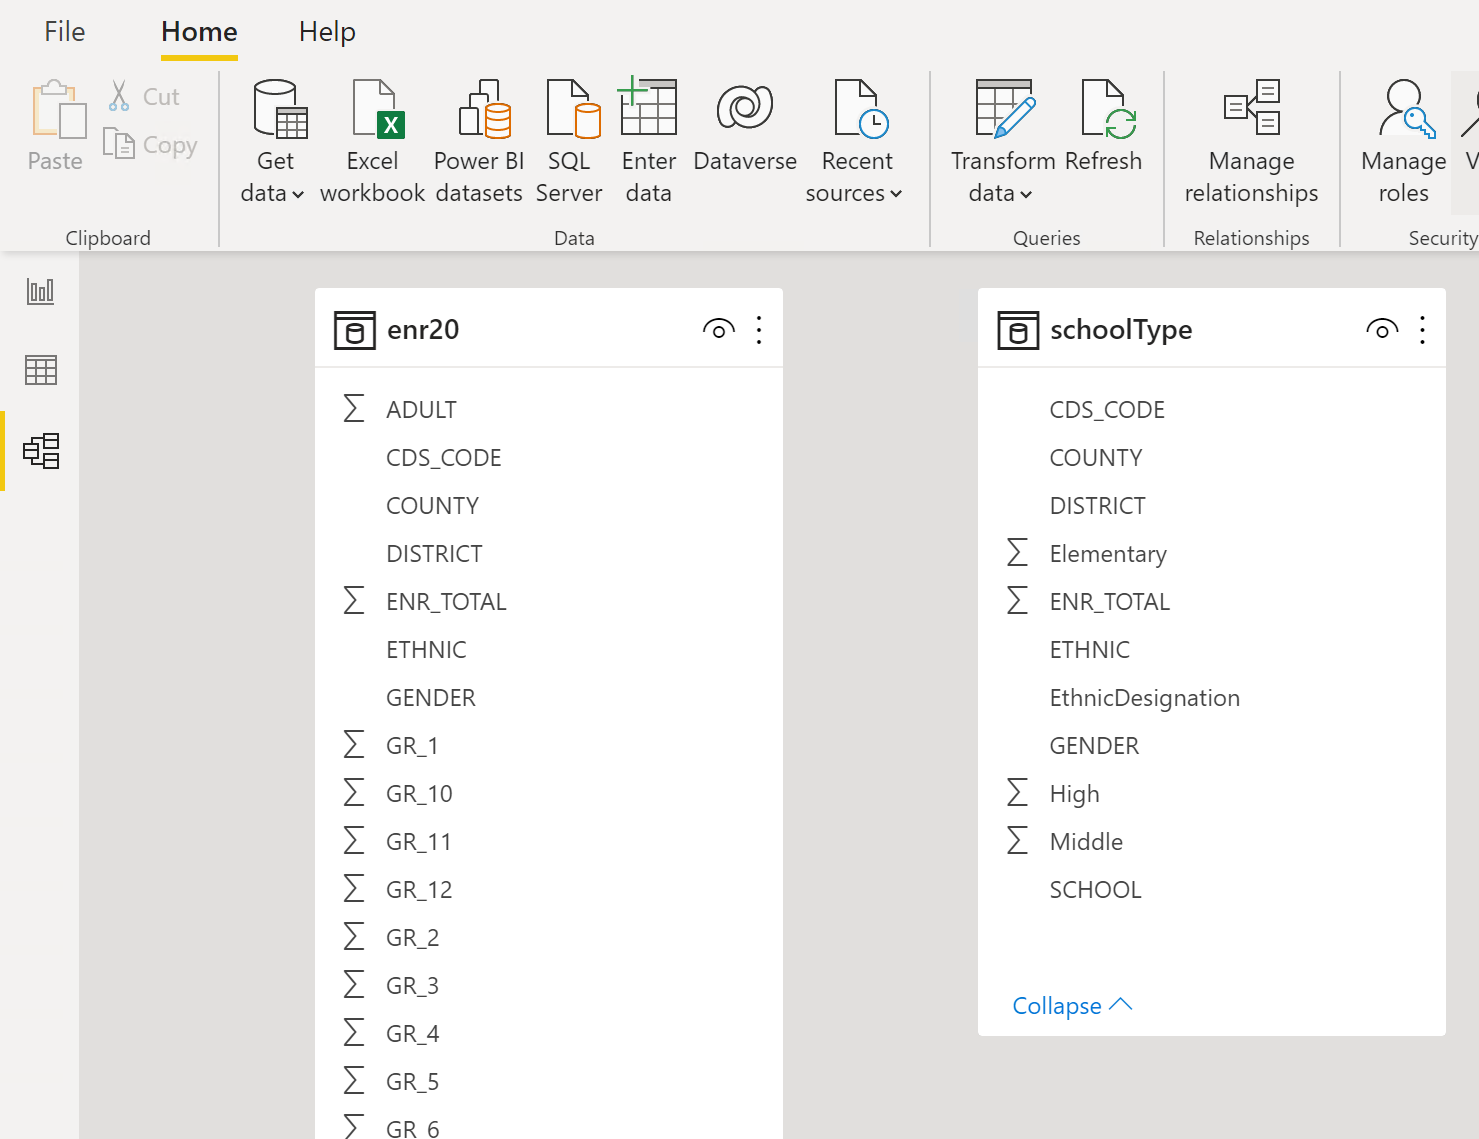
After you clicked on Close & Apply go to the Model tab. You should have 2 tables that look like this. Representing the two queries in the Transform Data
Lets go get some more data on the California Counties from the web to add to the model
-
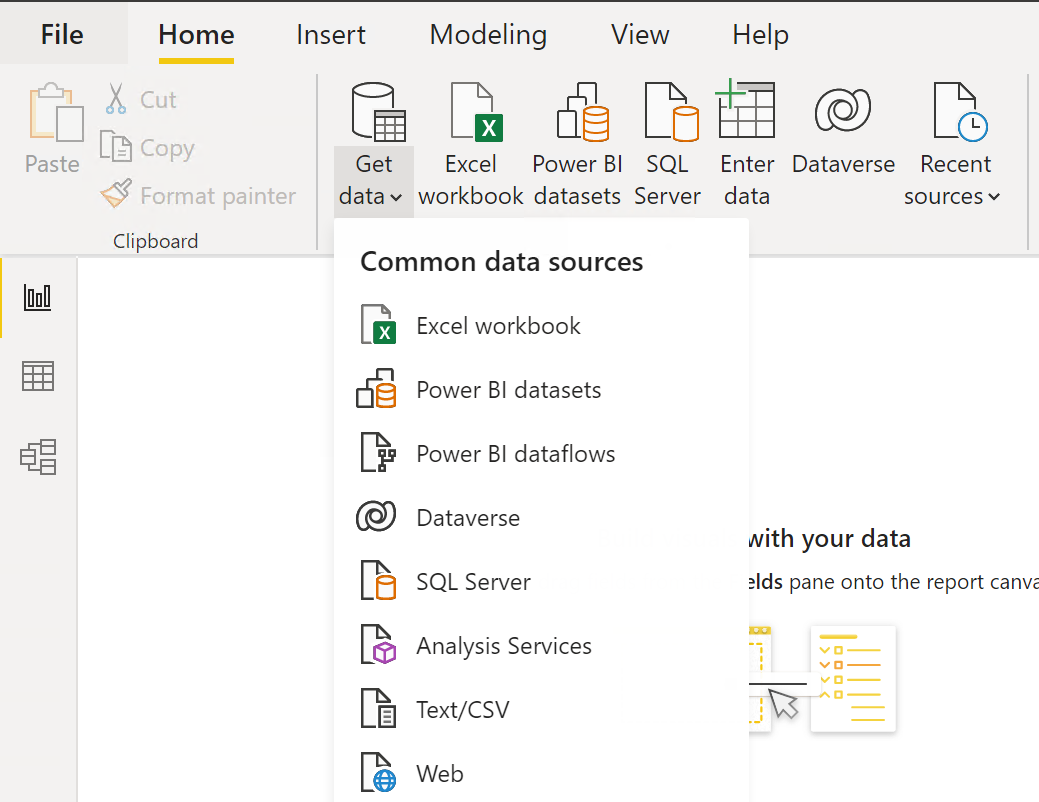
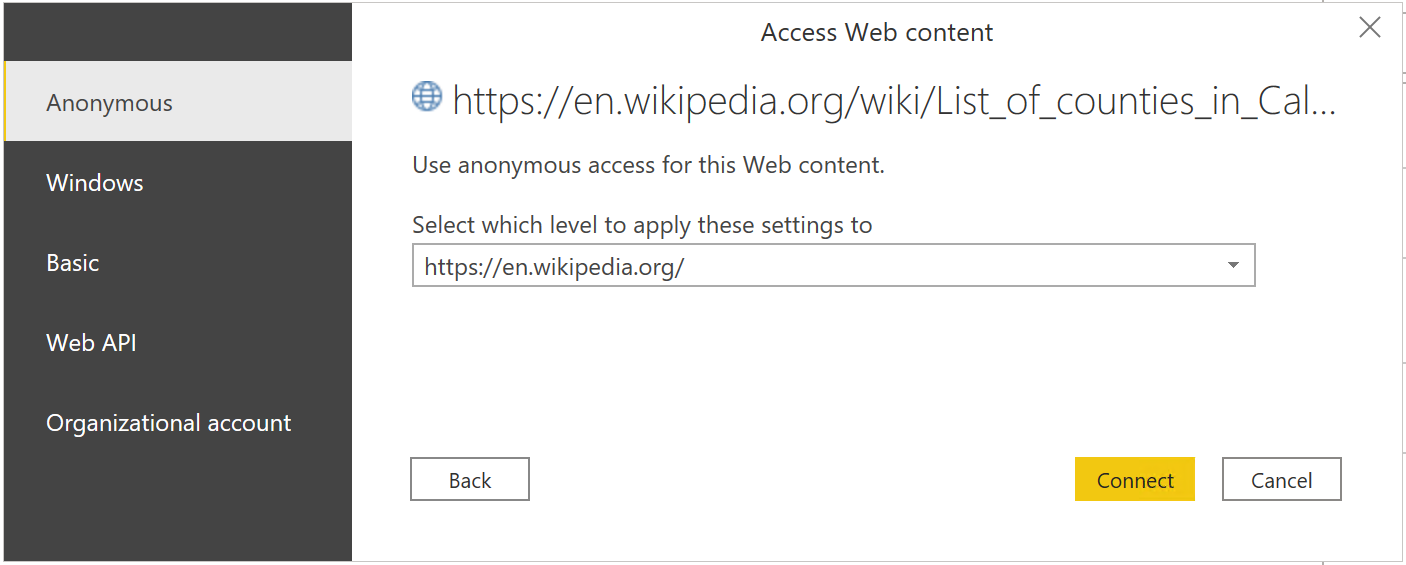
Get Data from Wikipedia
https://en.wikipedia.org/wiki/List_of_counties_in_California-
Click on Anonymous and click on
Connect -
Click on Table 2 and then Click
Transform Data -
Rename the Table 2 query to
Countyand remove theChanged TypeApplied Step ({"FIPS code[5]", Int64.Type},changed it to Integer but it should be text because it has leading zeros) -
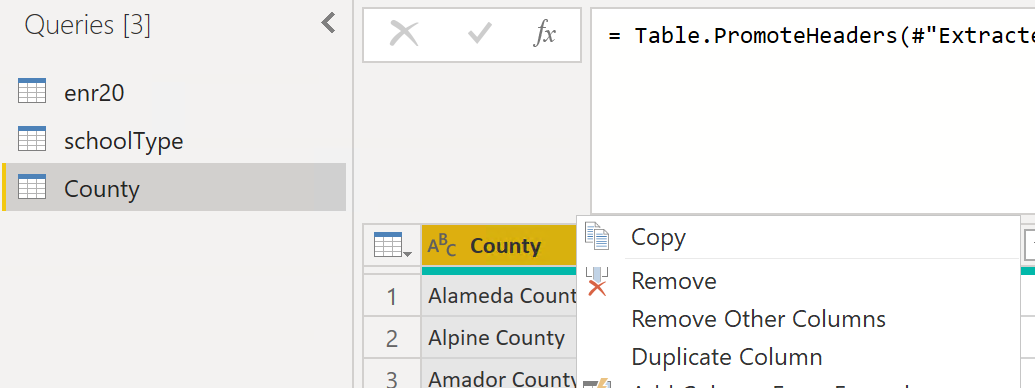
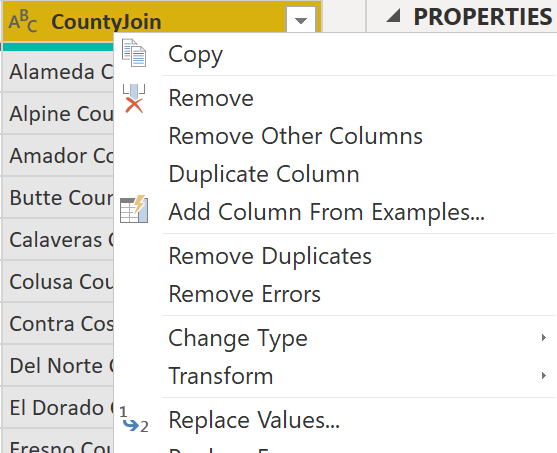
Select the County column, right click and select Duplicate Column
-
Rename the new column
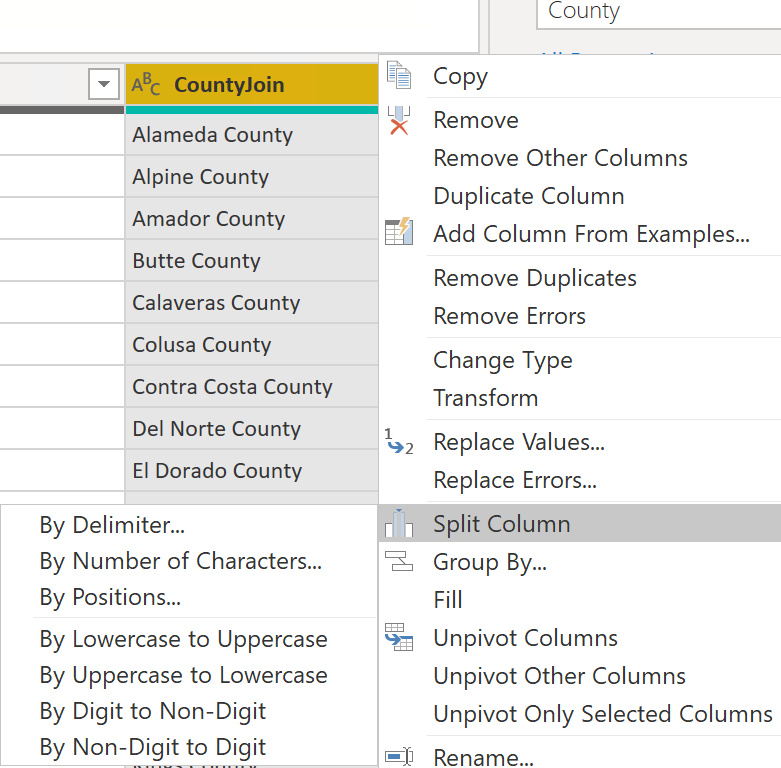
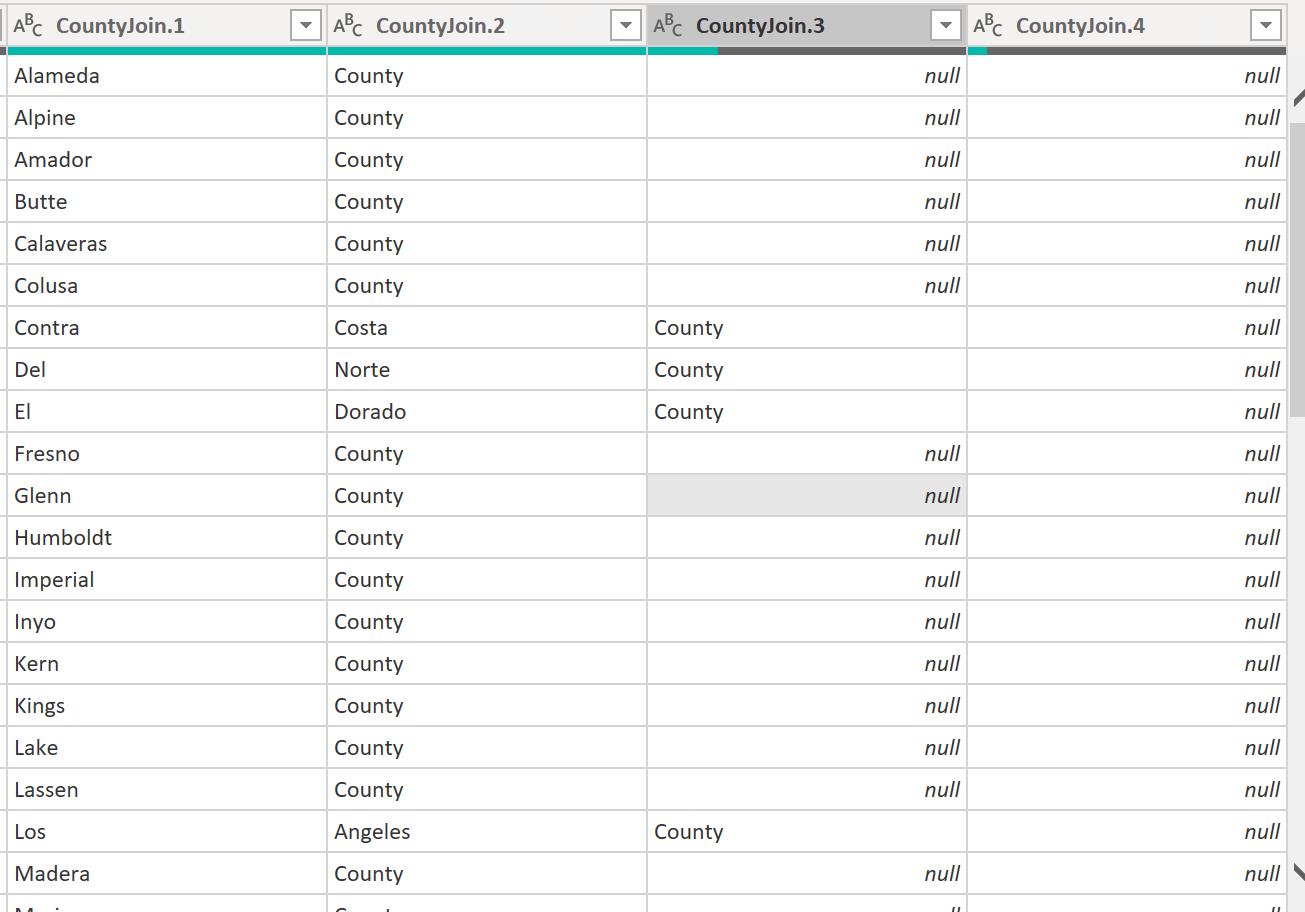
CountyJoinand right click and delect Split Column > By Delimiter -
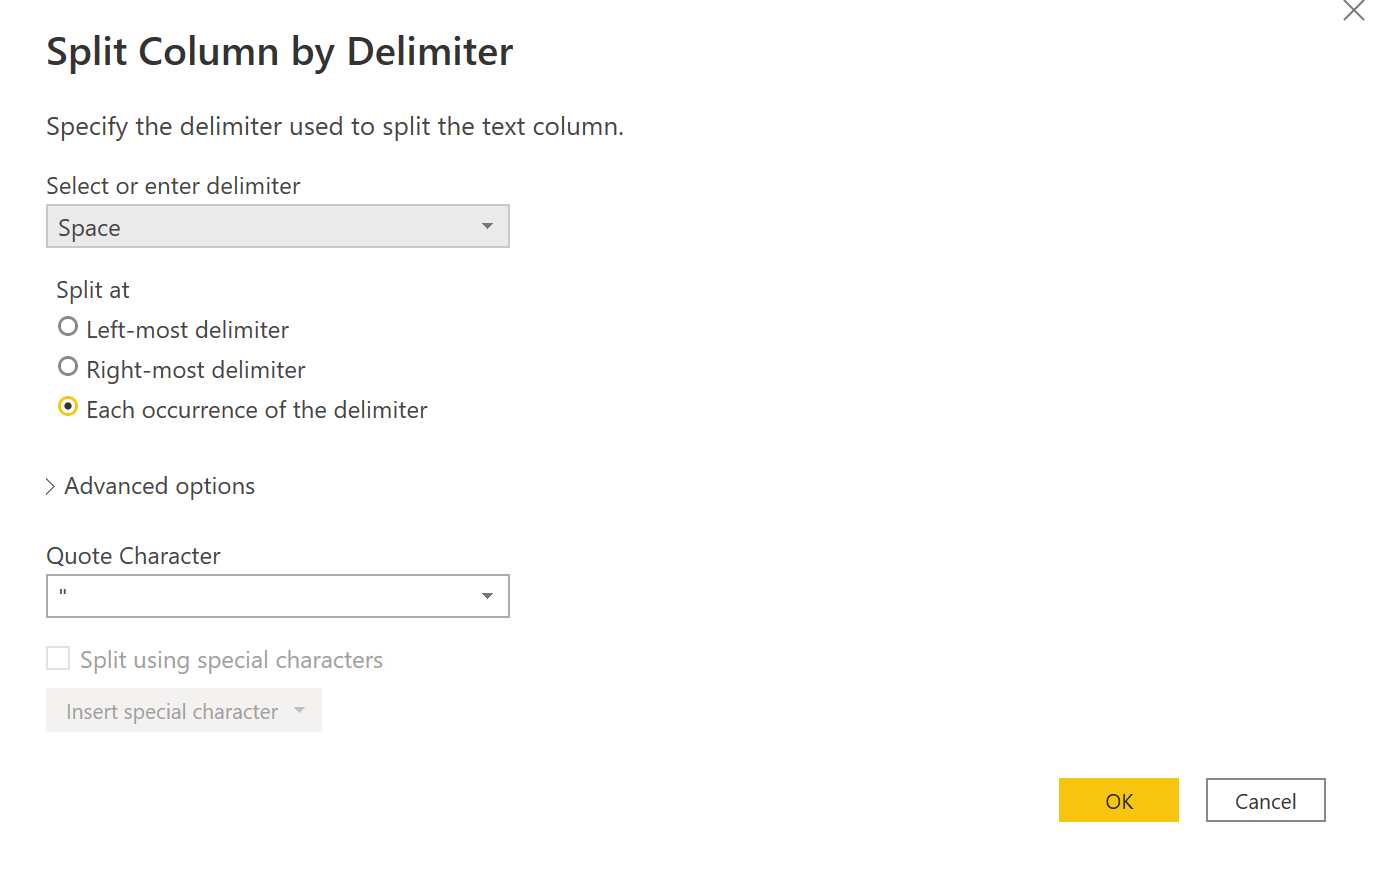
Go with
Spaceand Each occurence of the delimiter and click OK -
Notice that you got a bad split for the two word county names
-
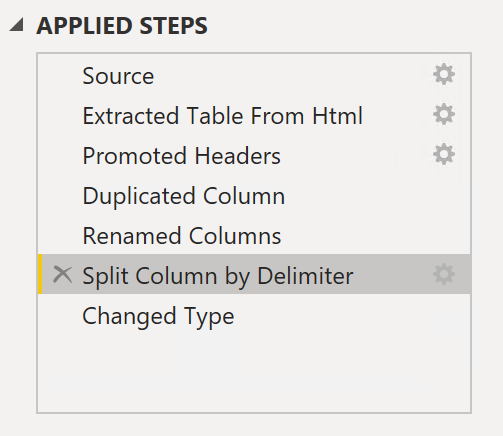
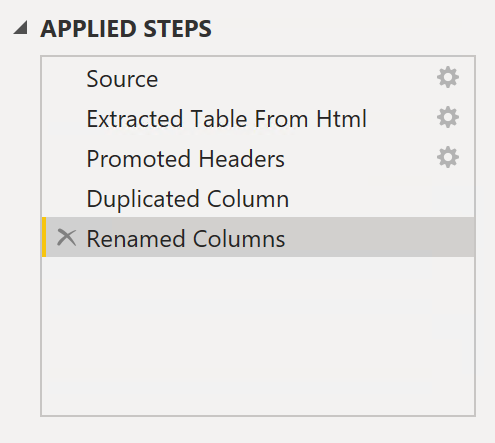
Delete the last to steps of the Applied Steps (Change Type and Split Column By Delimiter)
-
Lets use Replace Values instead
-
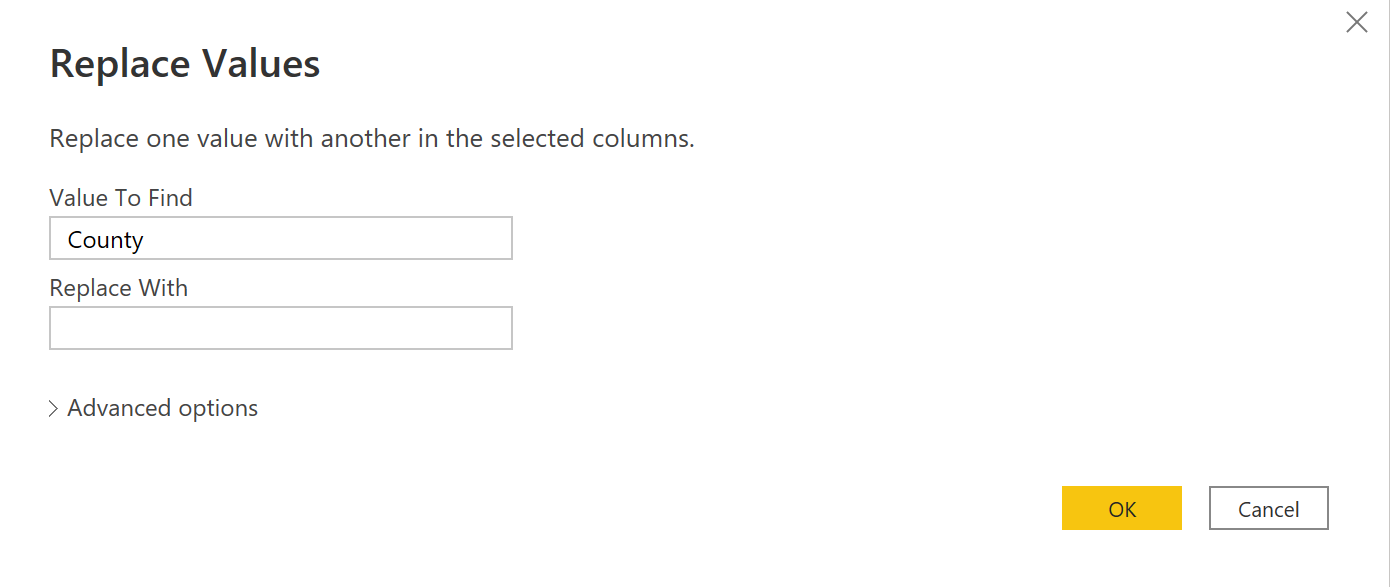
Enter a space followed by County in the Value to Find box and leave the Replace with box empty. Click OK
-
Couple last transformations. Change the type of Population column to Whole Number and remove the Map column
-
Click Close & Apply
-
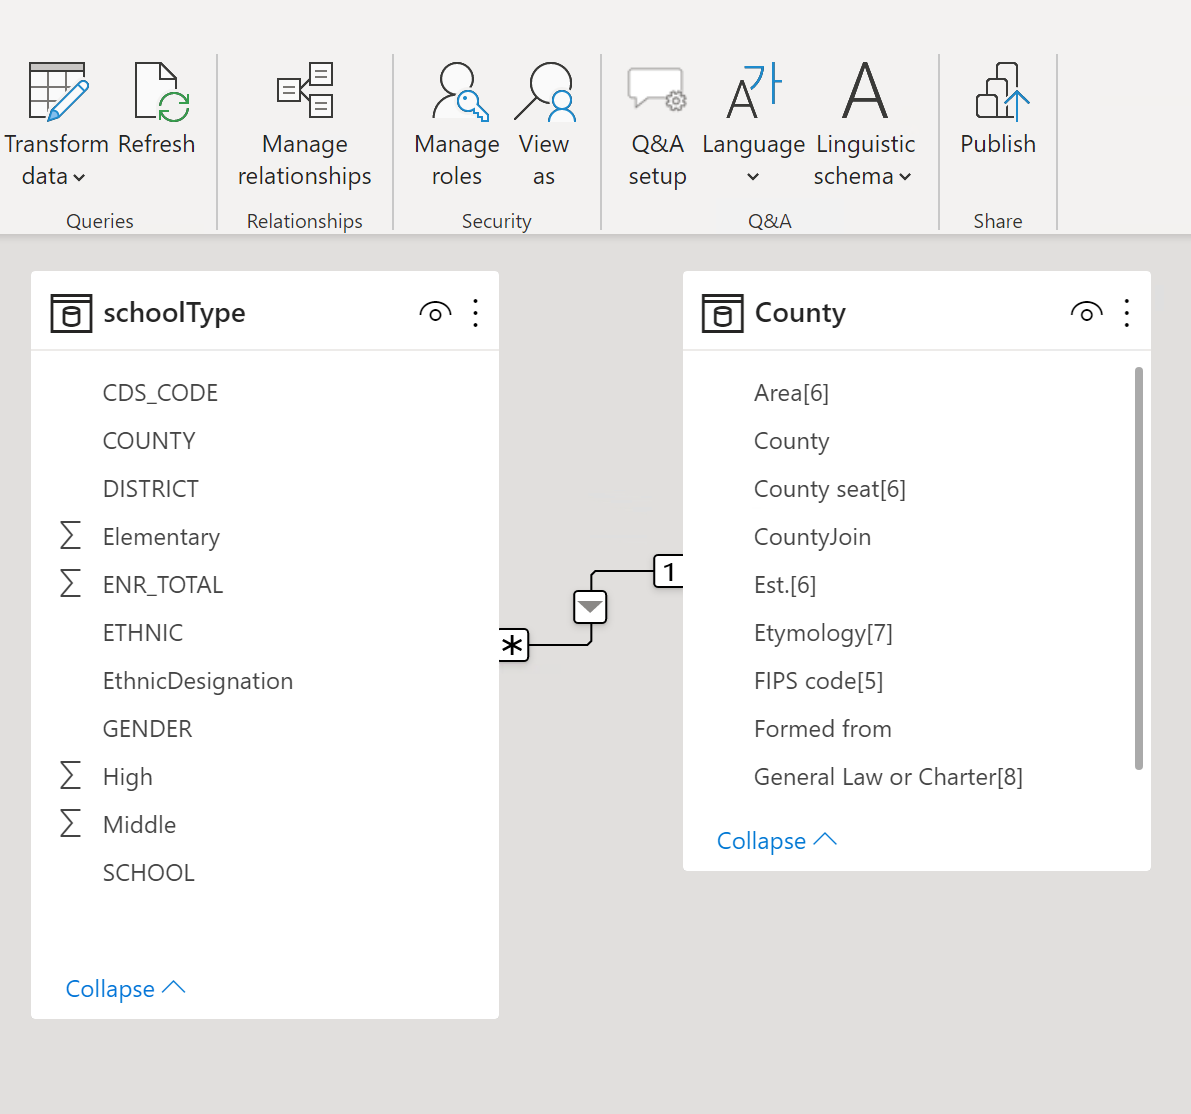
Go to the Model tab and drag CountyJoin in the County table on to COUNTY in the schoolType table to create a many to 1 join
-
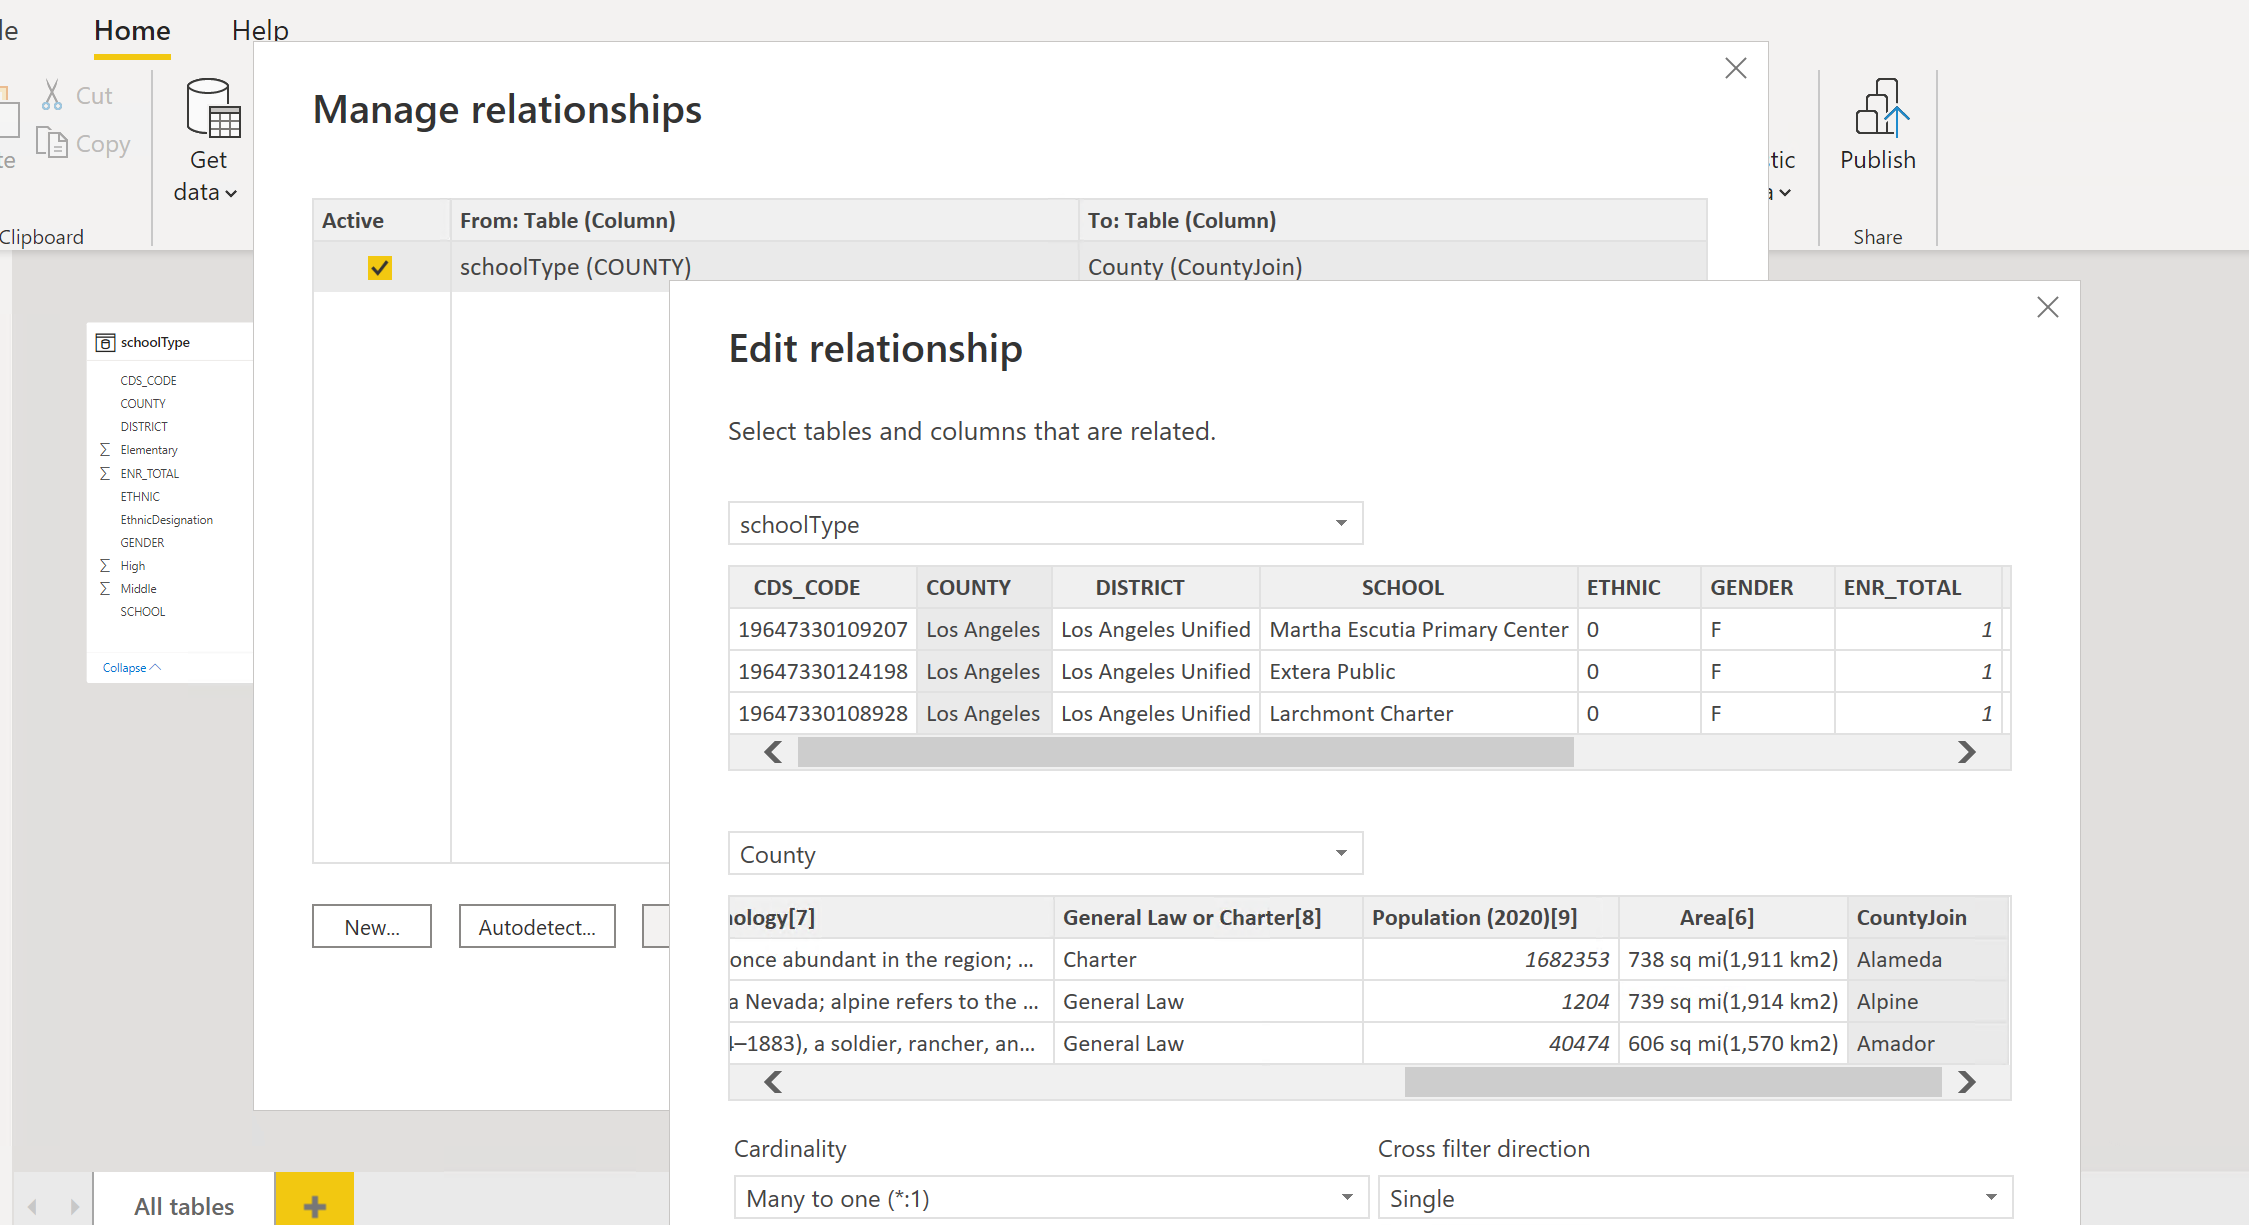
You can also create and edit the join in Manage relationships
-
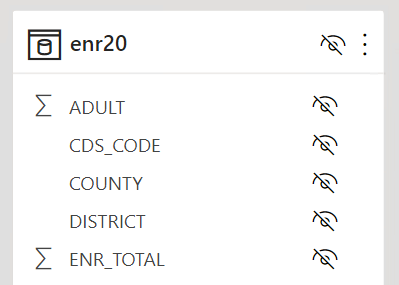
Hide the the enr20 table by clicking eye icon in the top right corner of the table
-
You are now ready to create some reports and visualizations
-
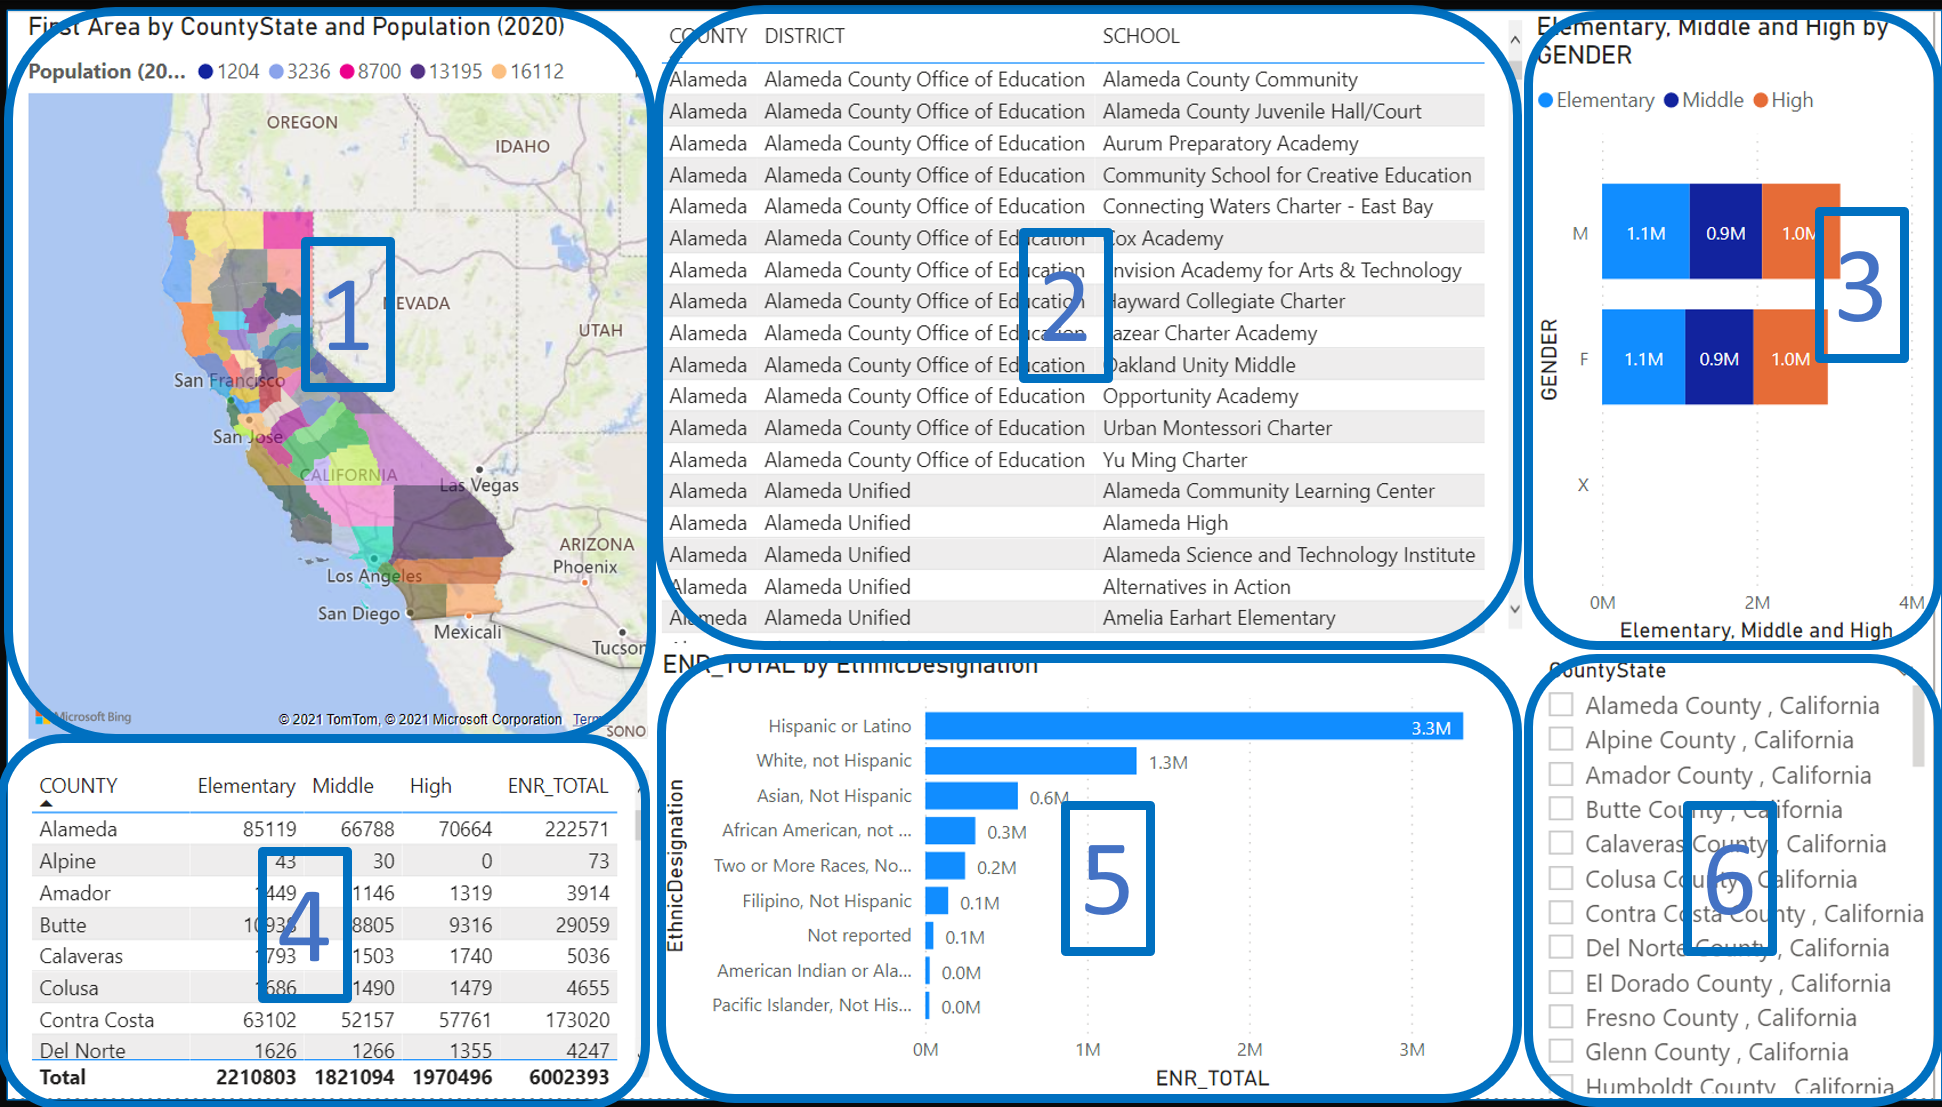
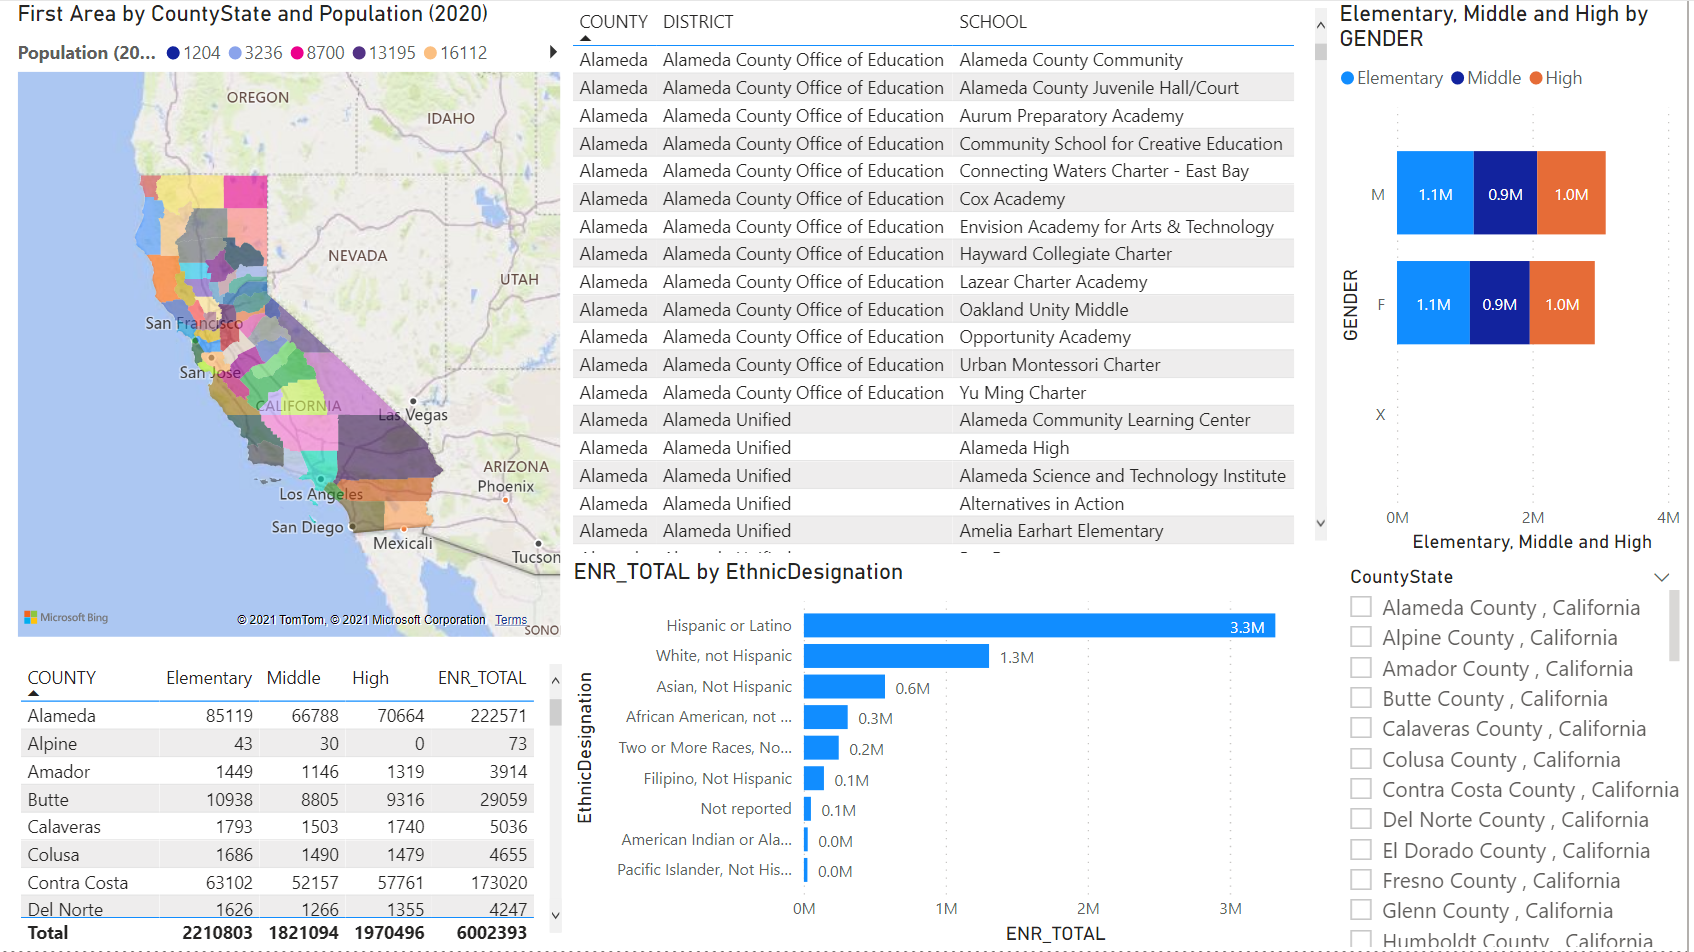
Now I would like you to build a report that looks like this
To create the report lets divide it into 6 sections
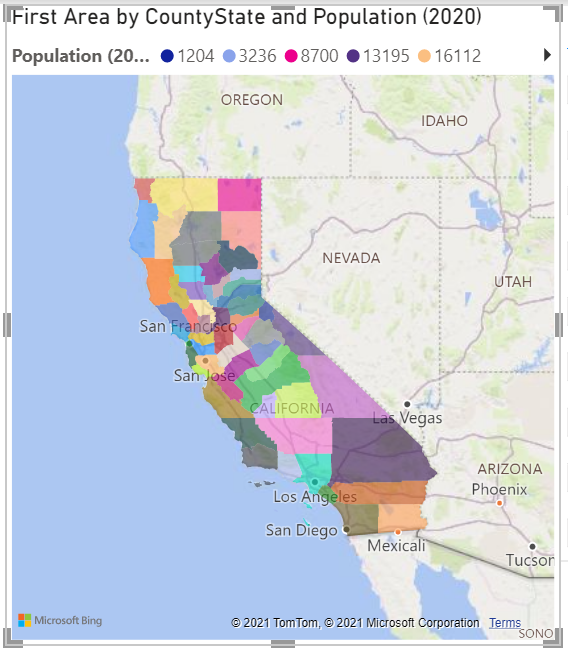
Section 1 looks like this:
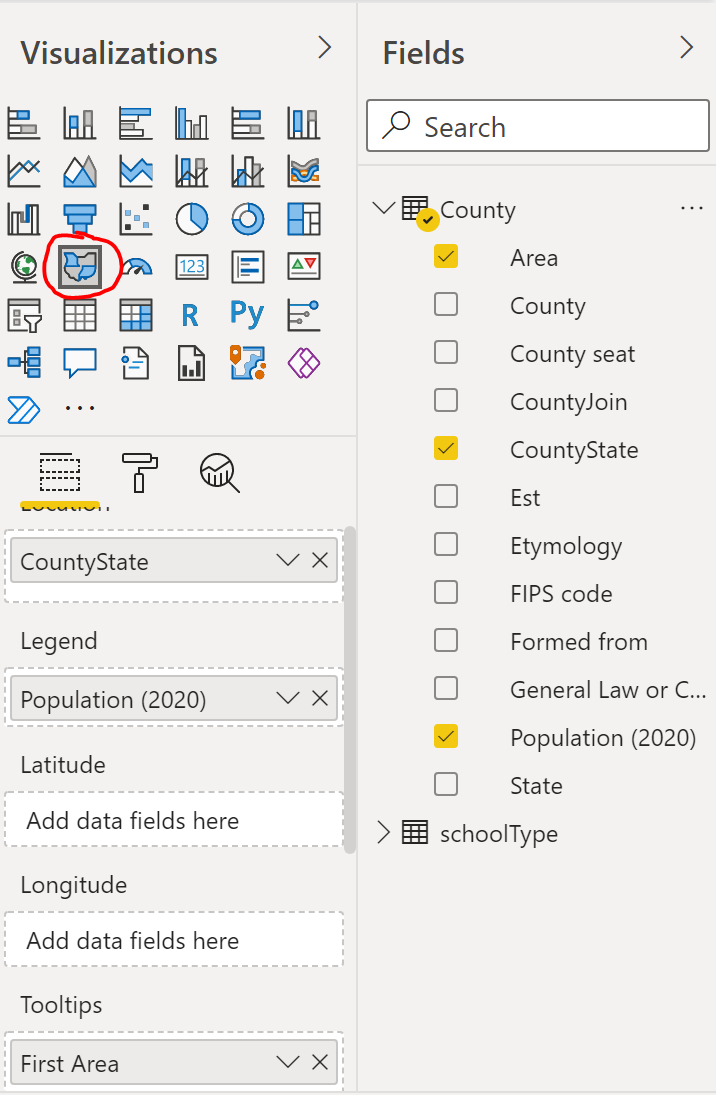
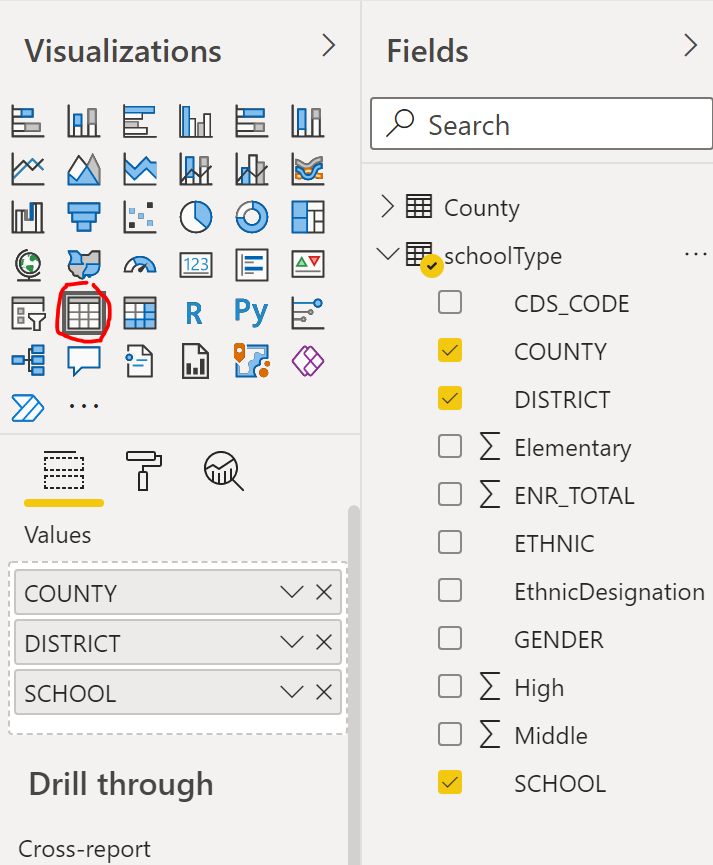
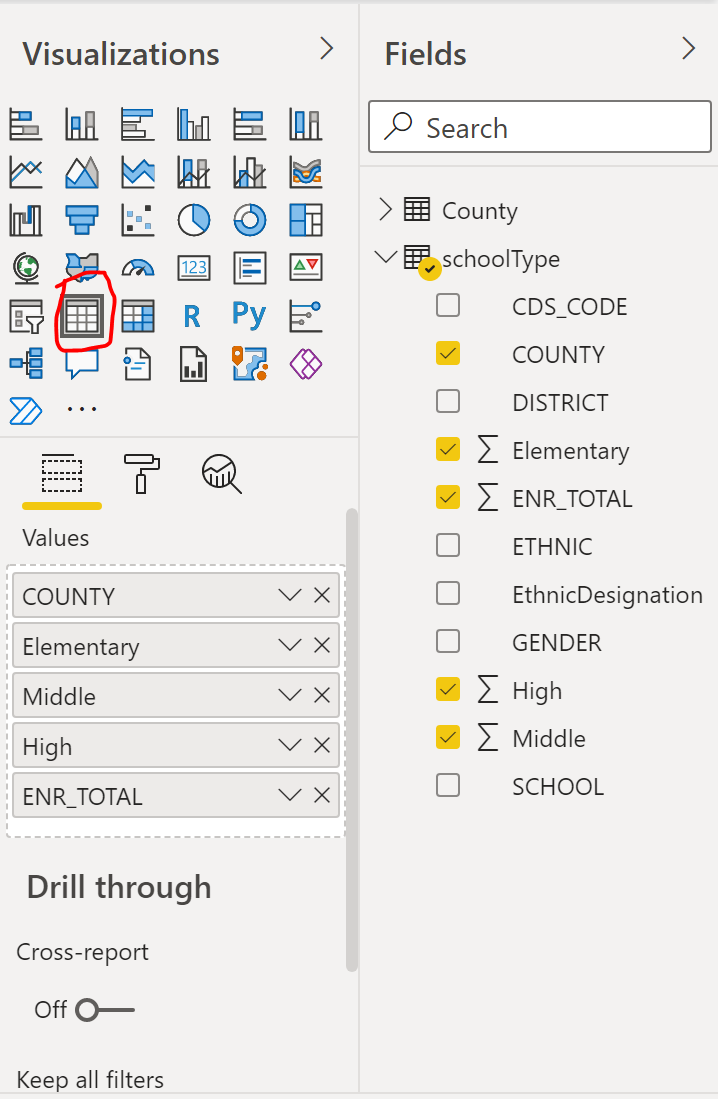
and uses the following visualizations and fields:
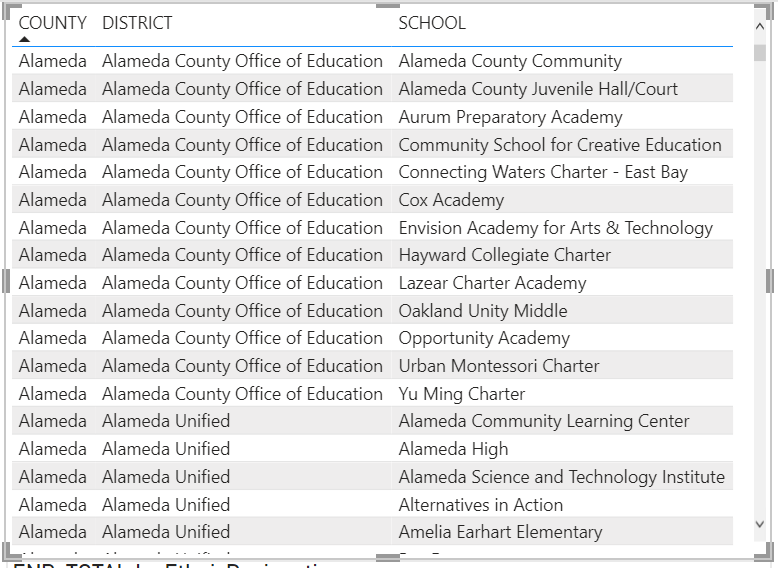
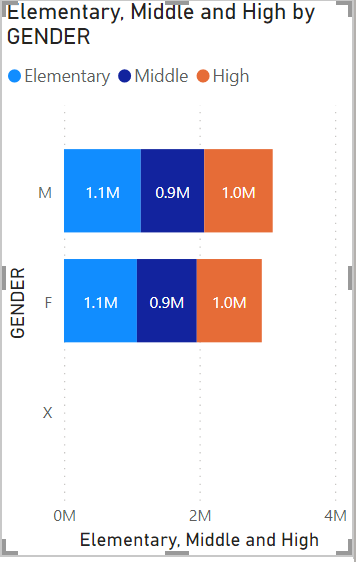
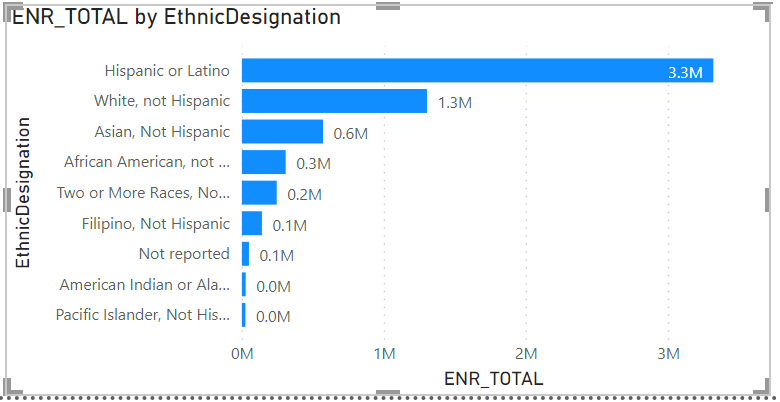
Section 2 looks like this:
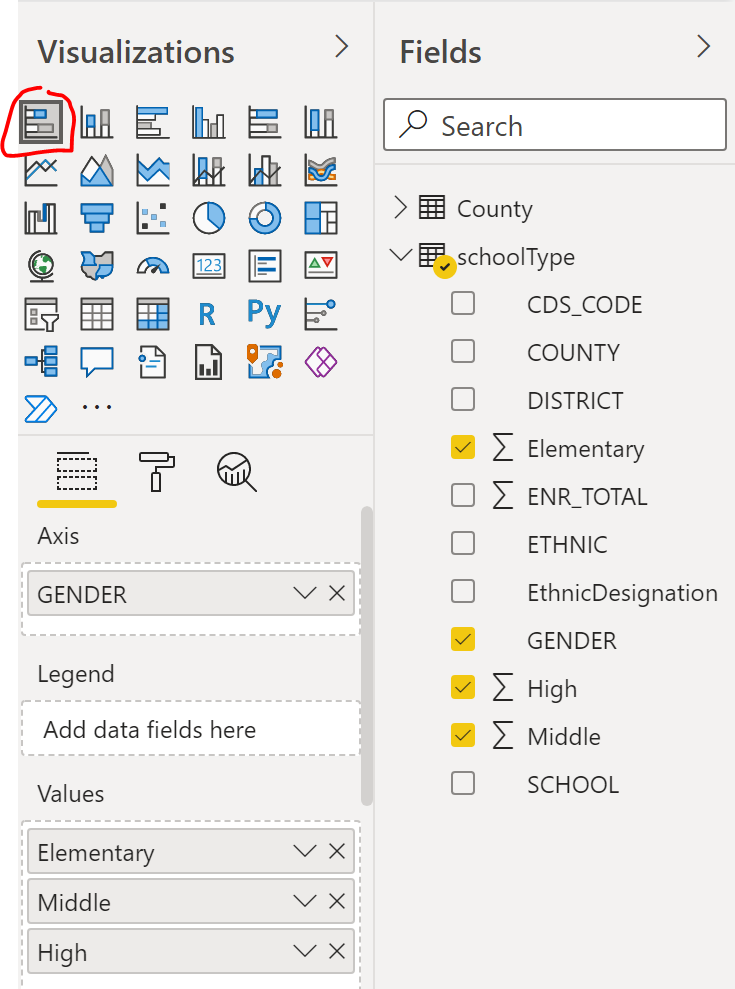
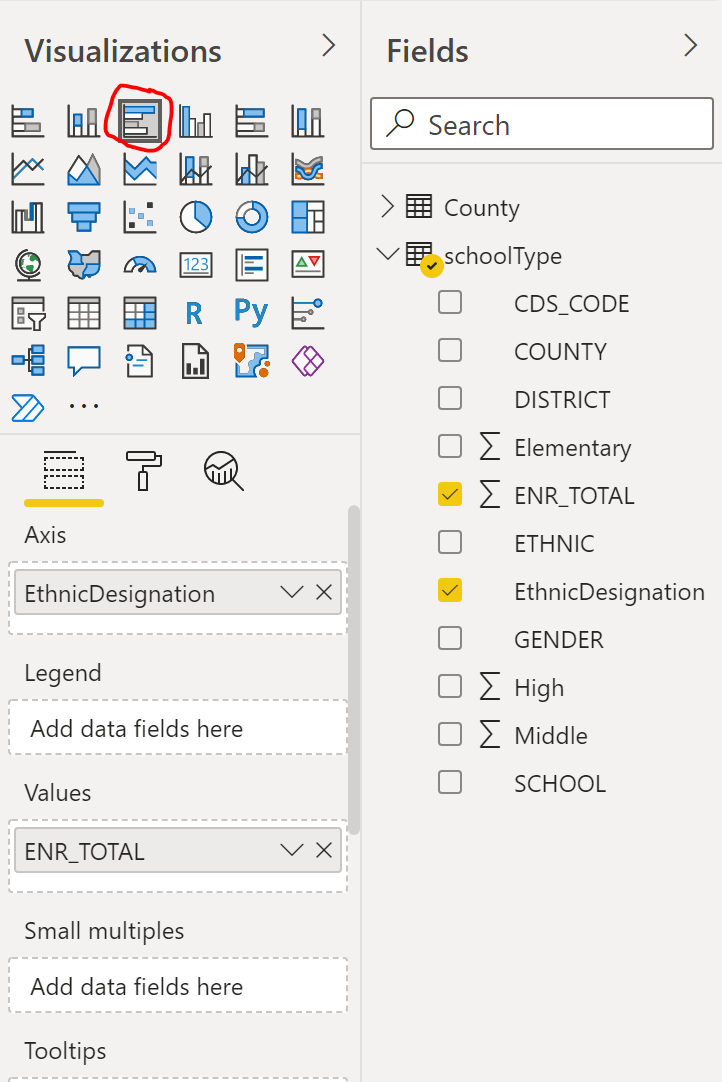
and uses the following visualizations and fields:
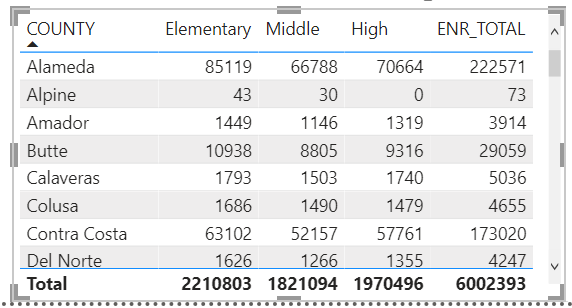
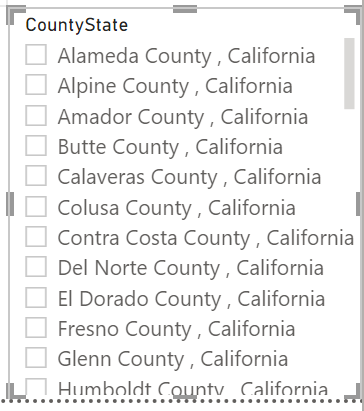
Section 3 looks like this:
and uses the following visualizations and fields:
Section 4 looks like this:
and uses the following visualizations and fields:
Section 5 looks like this:
and uses the following visualizations and fields:
Section 6 looks like this:
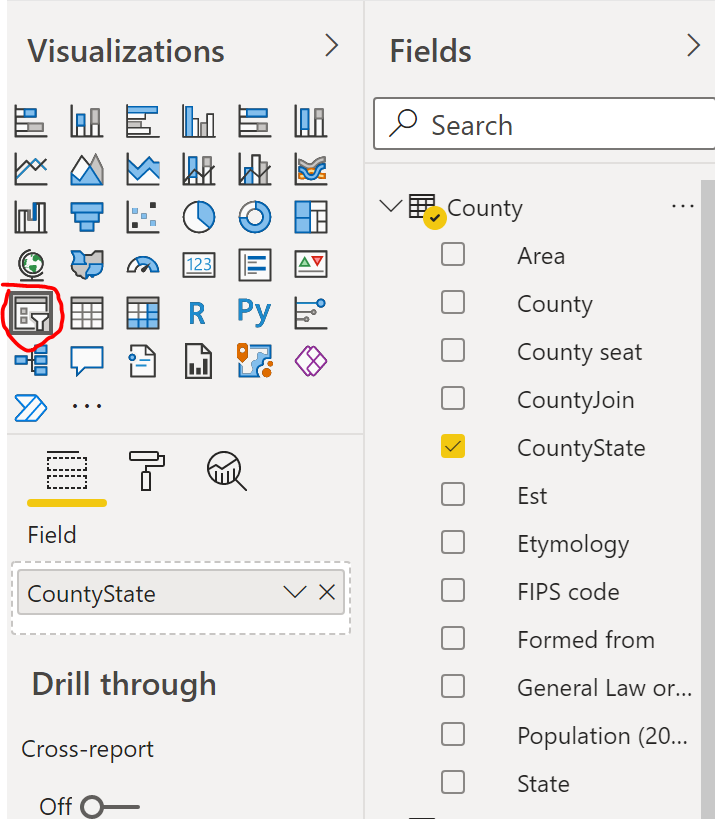
and uses the following visualizations and fields:
After some formatting fixes it should look something like this:
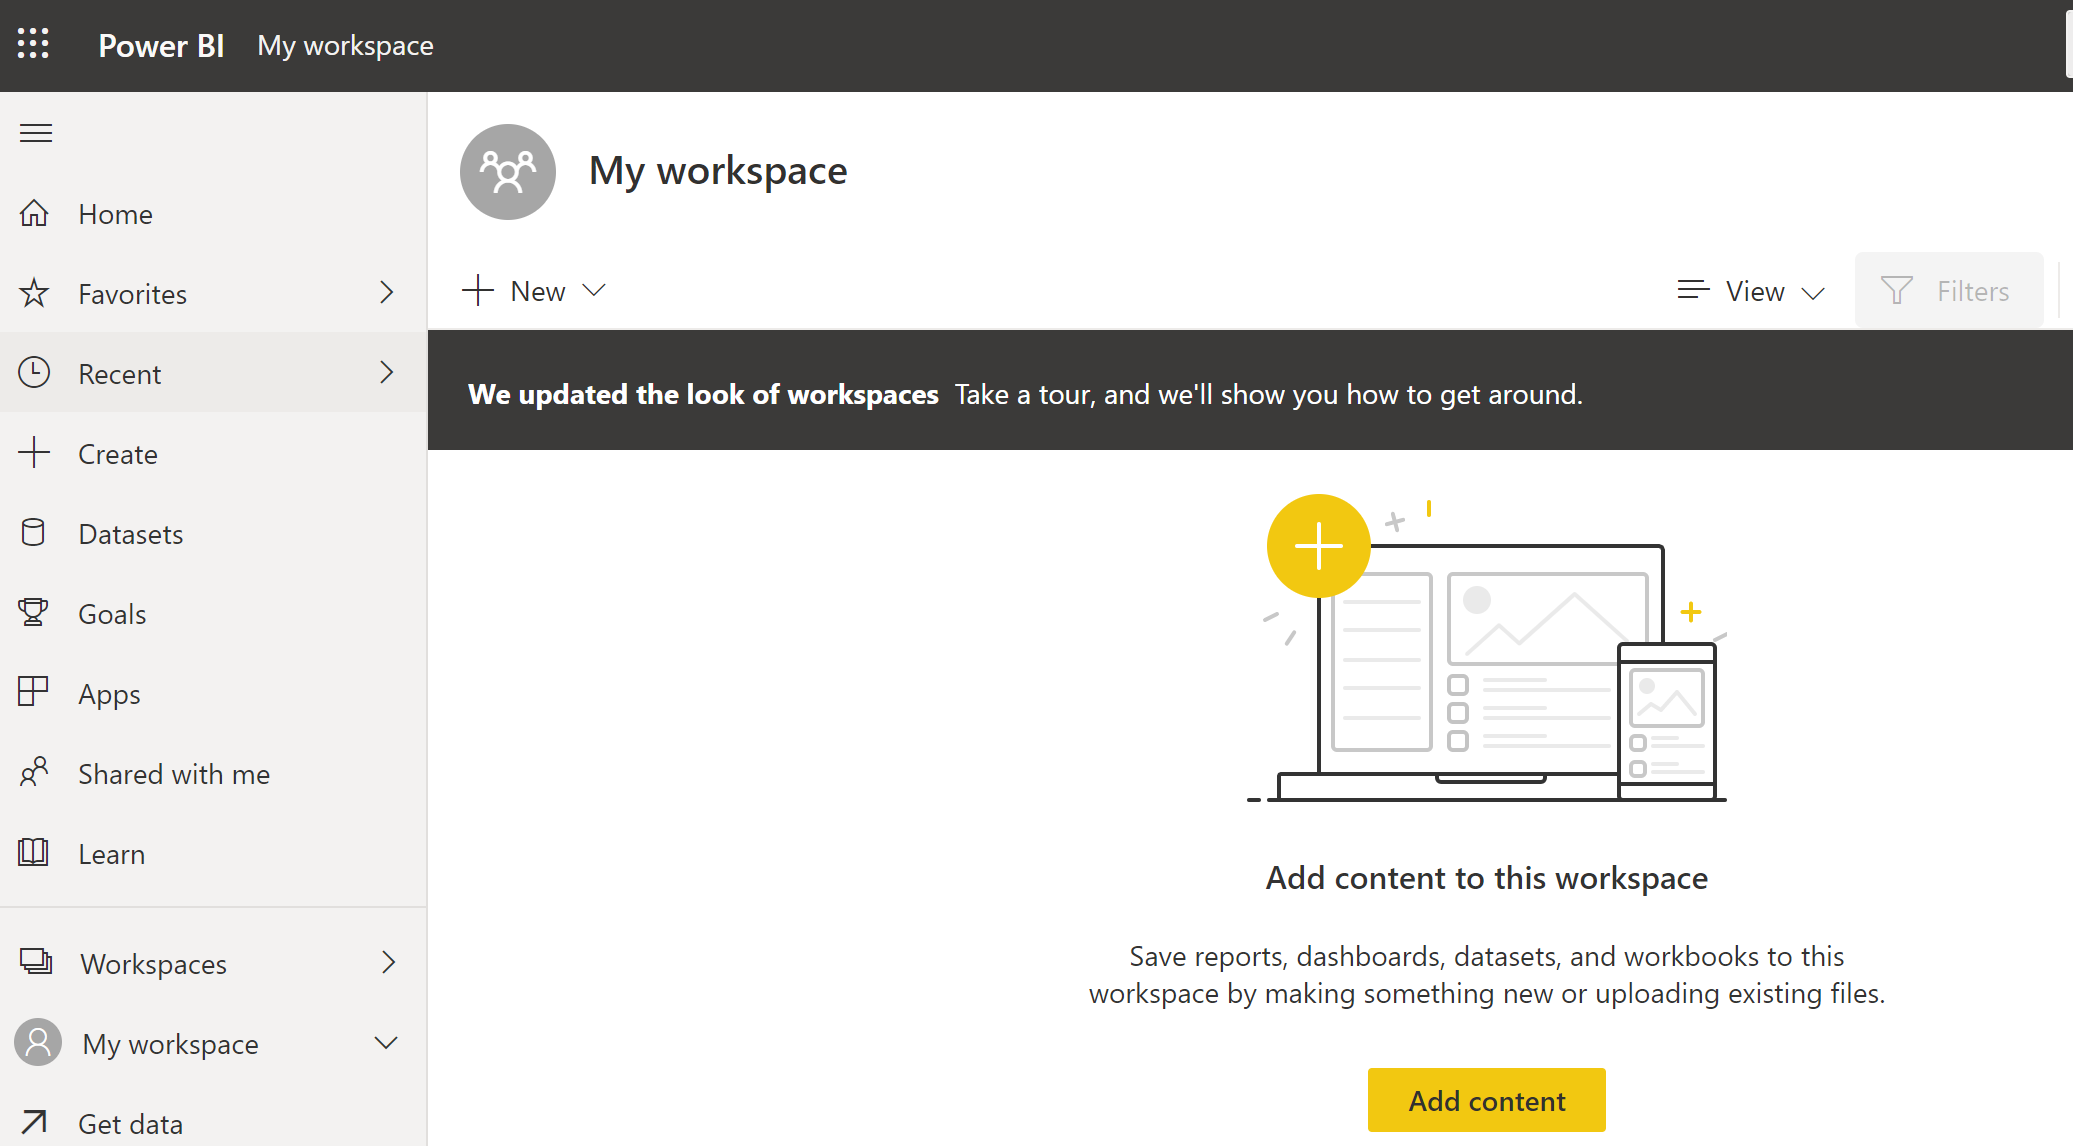
Save the Report and click on Publish, chose My workspace, and click Select
Login to powerbi.microsoft.com
Login to powerbi.microsoft.com with your userid and password and open your report

