This is a sample visualisation using the department for transport road traffic API.
The following software is a pre-requisite for building and deploying this web application.
- Node.js - JavaScript runtime
A step by step series of examples that tell you how to get a development env running
Install the dependencies
npm installStart the application
npm startThe application is set up to use gh-pages npm module to deploy the built application to a GitHub pages branch.
npm run build
npm run deploy- React JS - The web framework used
- Mapbox GL - The web map framework
- Chart JS - The charting framework
See Road Traffic (the URL is case sensitive).
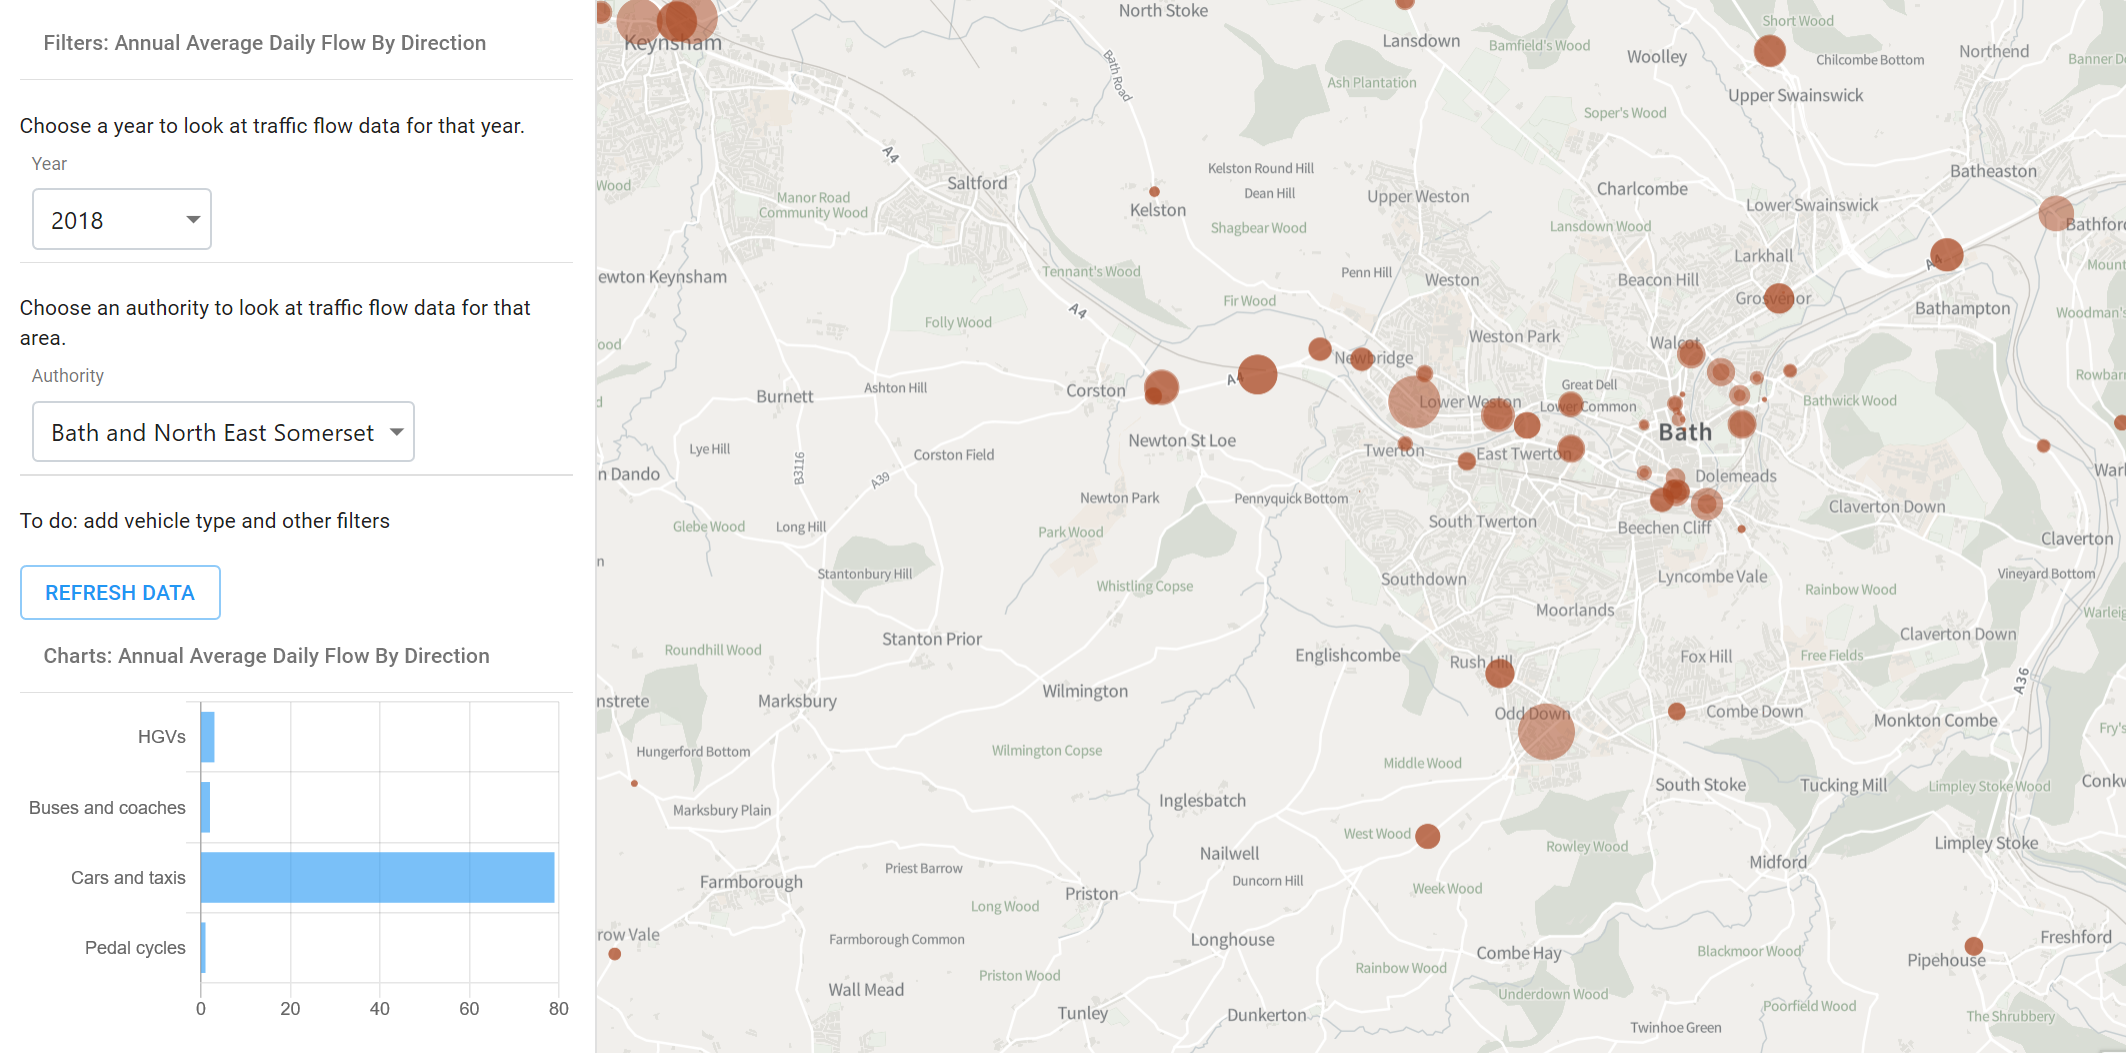
- Choose a year and an authority to view data for.
- Click 'Refresh Data'. After a moment the map will pan to the relevant authority area. Circles on the map will display the traffic count points, sized relative to the count of all vehicle average traffic counts.
- A graph should also appear in the sidebar, showing the relative amounts of 4 traffic types.
- On changing the two options (year and authority) and selecting refresh data the view should update.
- The map circles can also be selected to show a popup of information about the individual count point.
- Dave Rowe - Initial work - DaveBathnes
See also the list of contributors who participated in this project.
This project is licensed under the MIT License - see the LICENSE.md file for details
- Department for transport data sources.