Reserved PORT 23300 - 23399
Grafana Default Password: abcd-1234
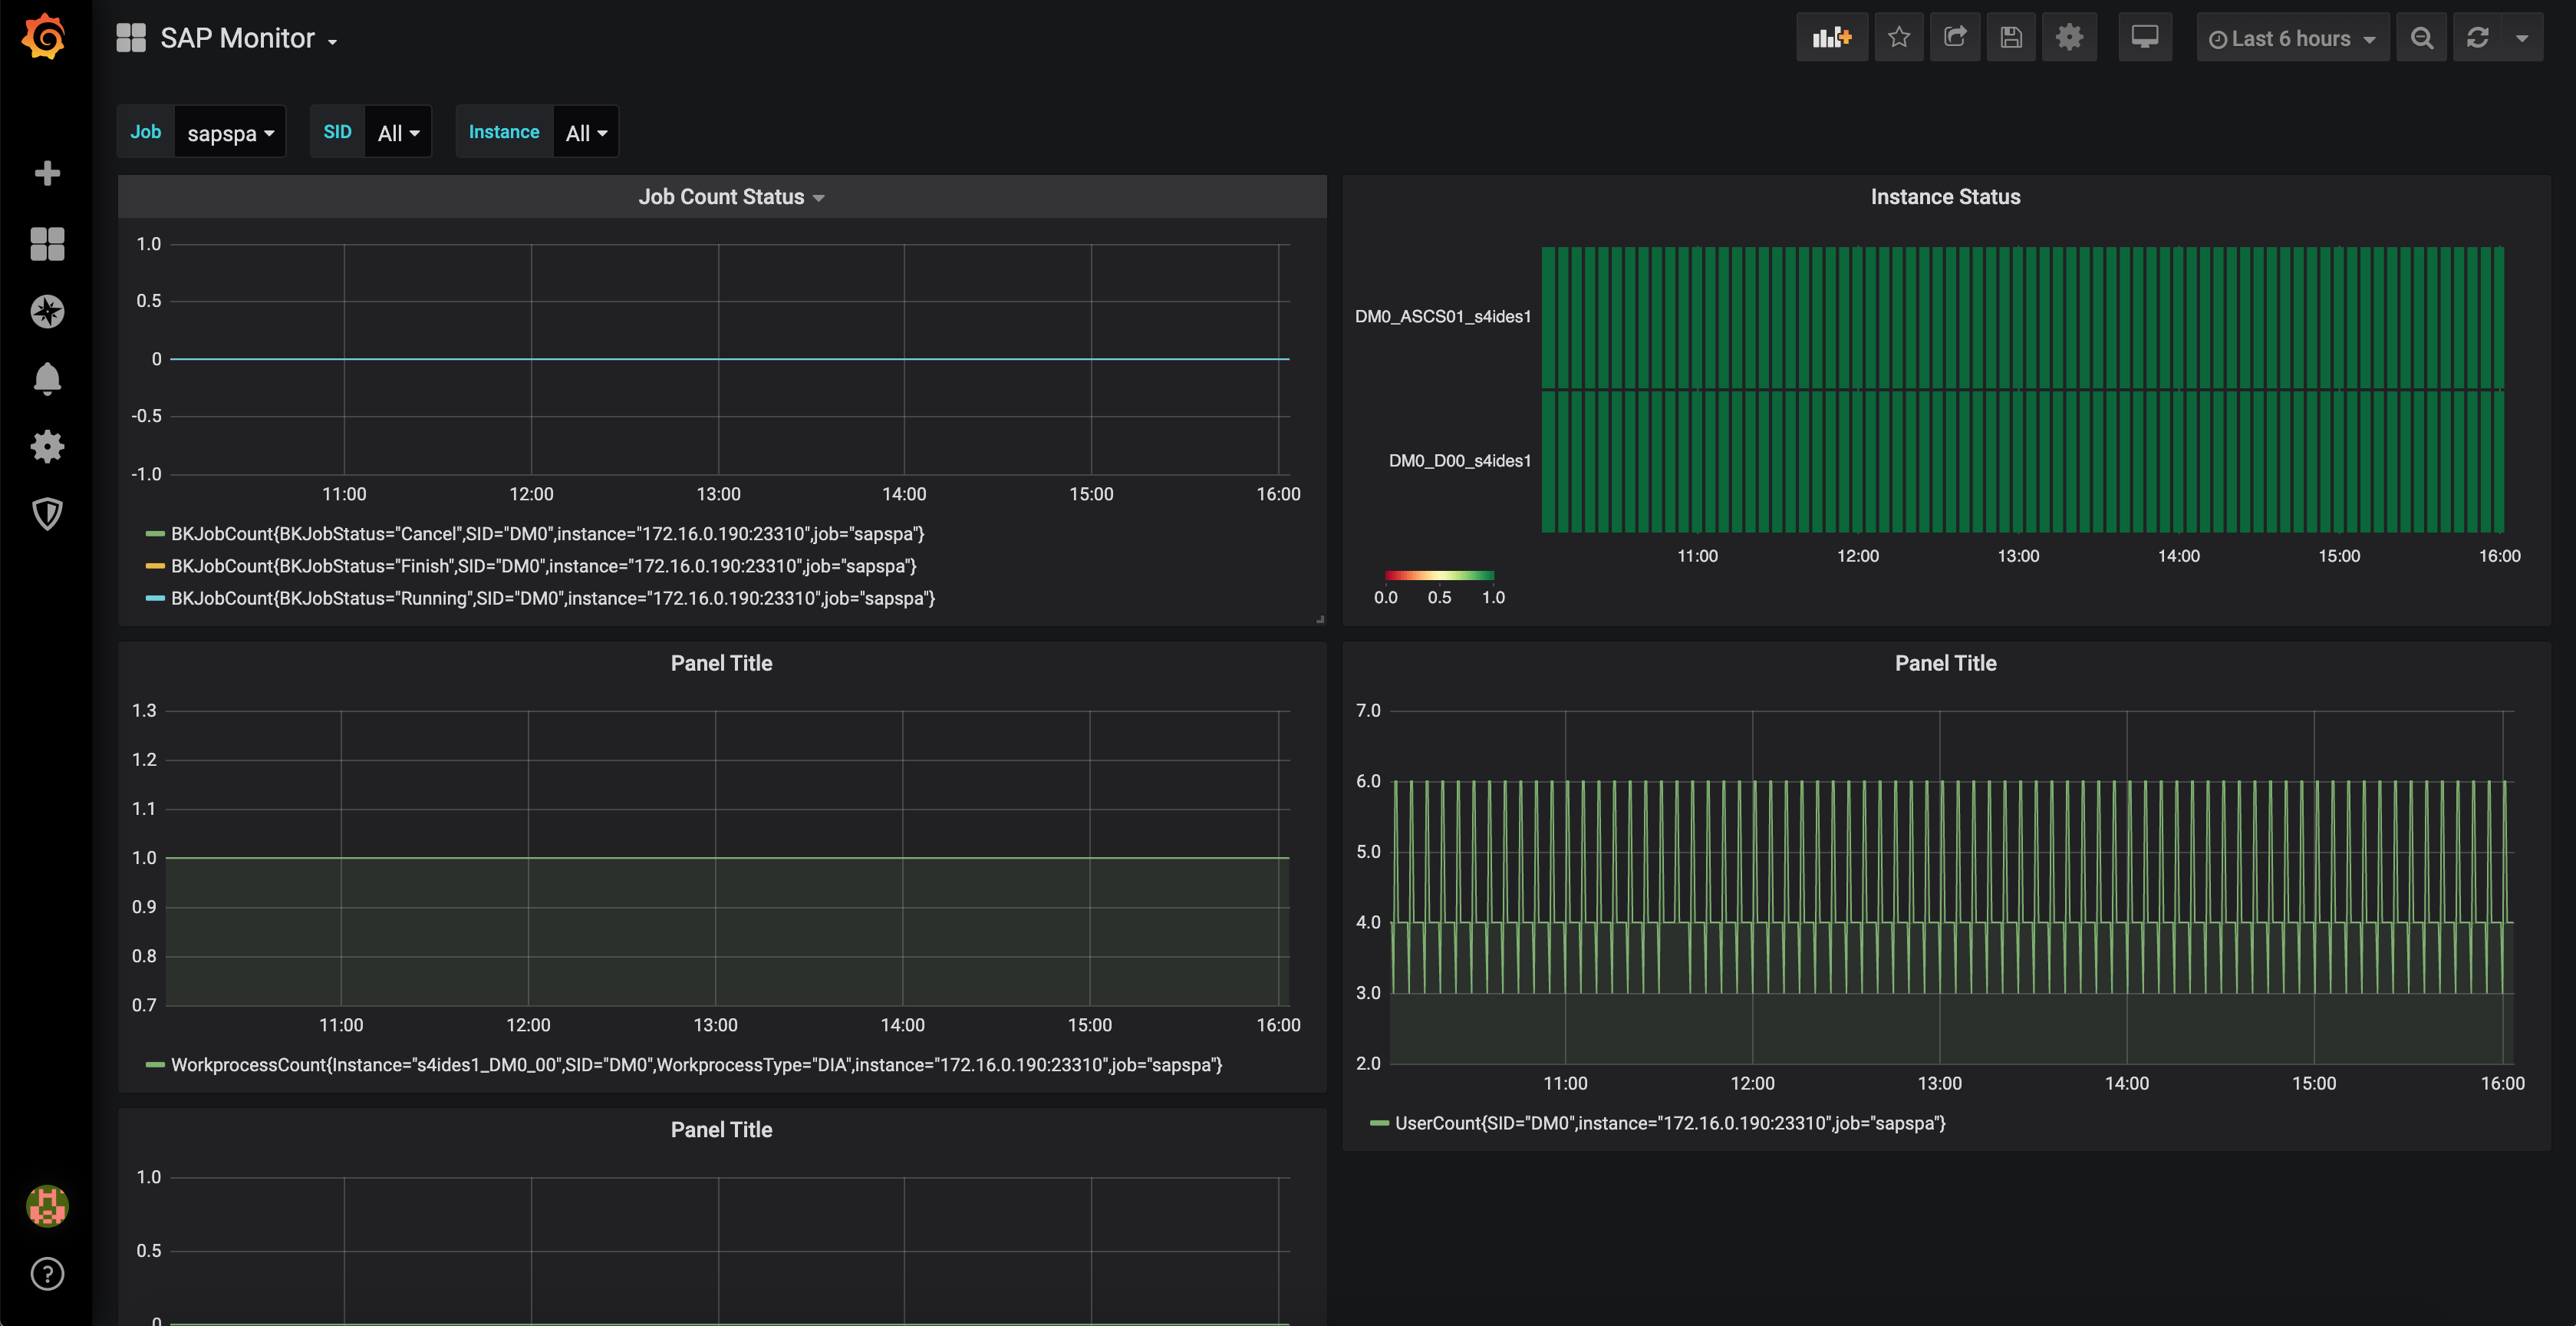
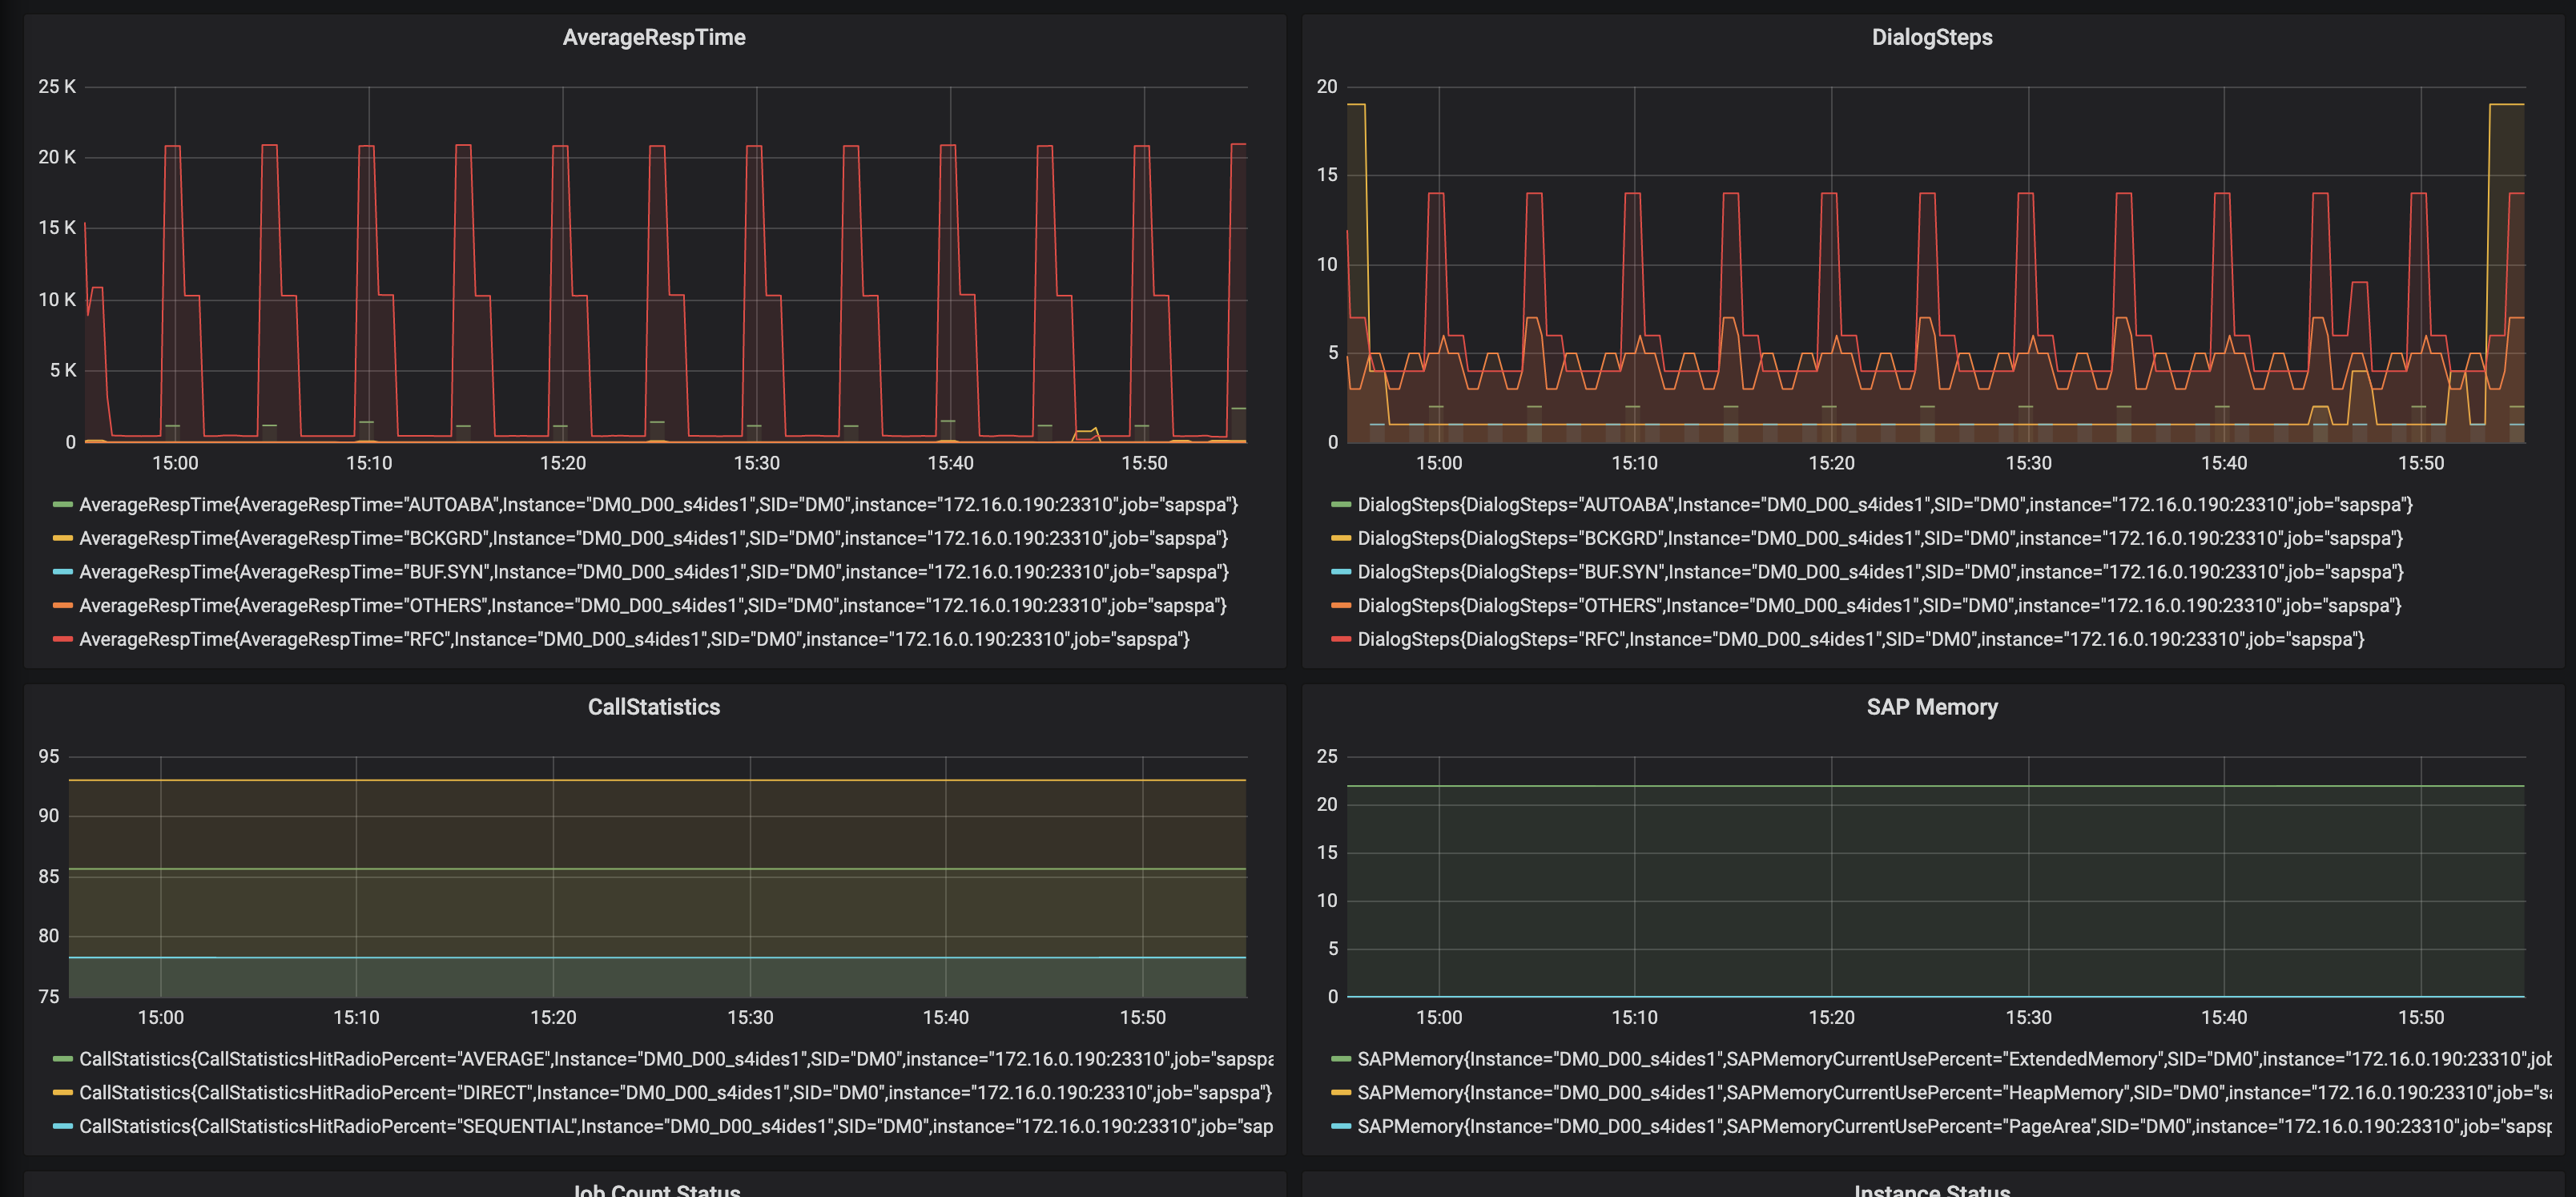
SAP Monitor
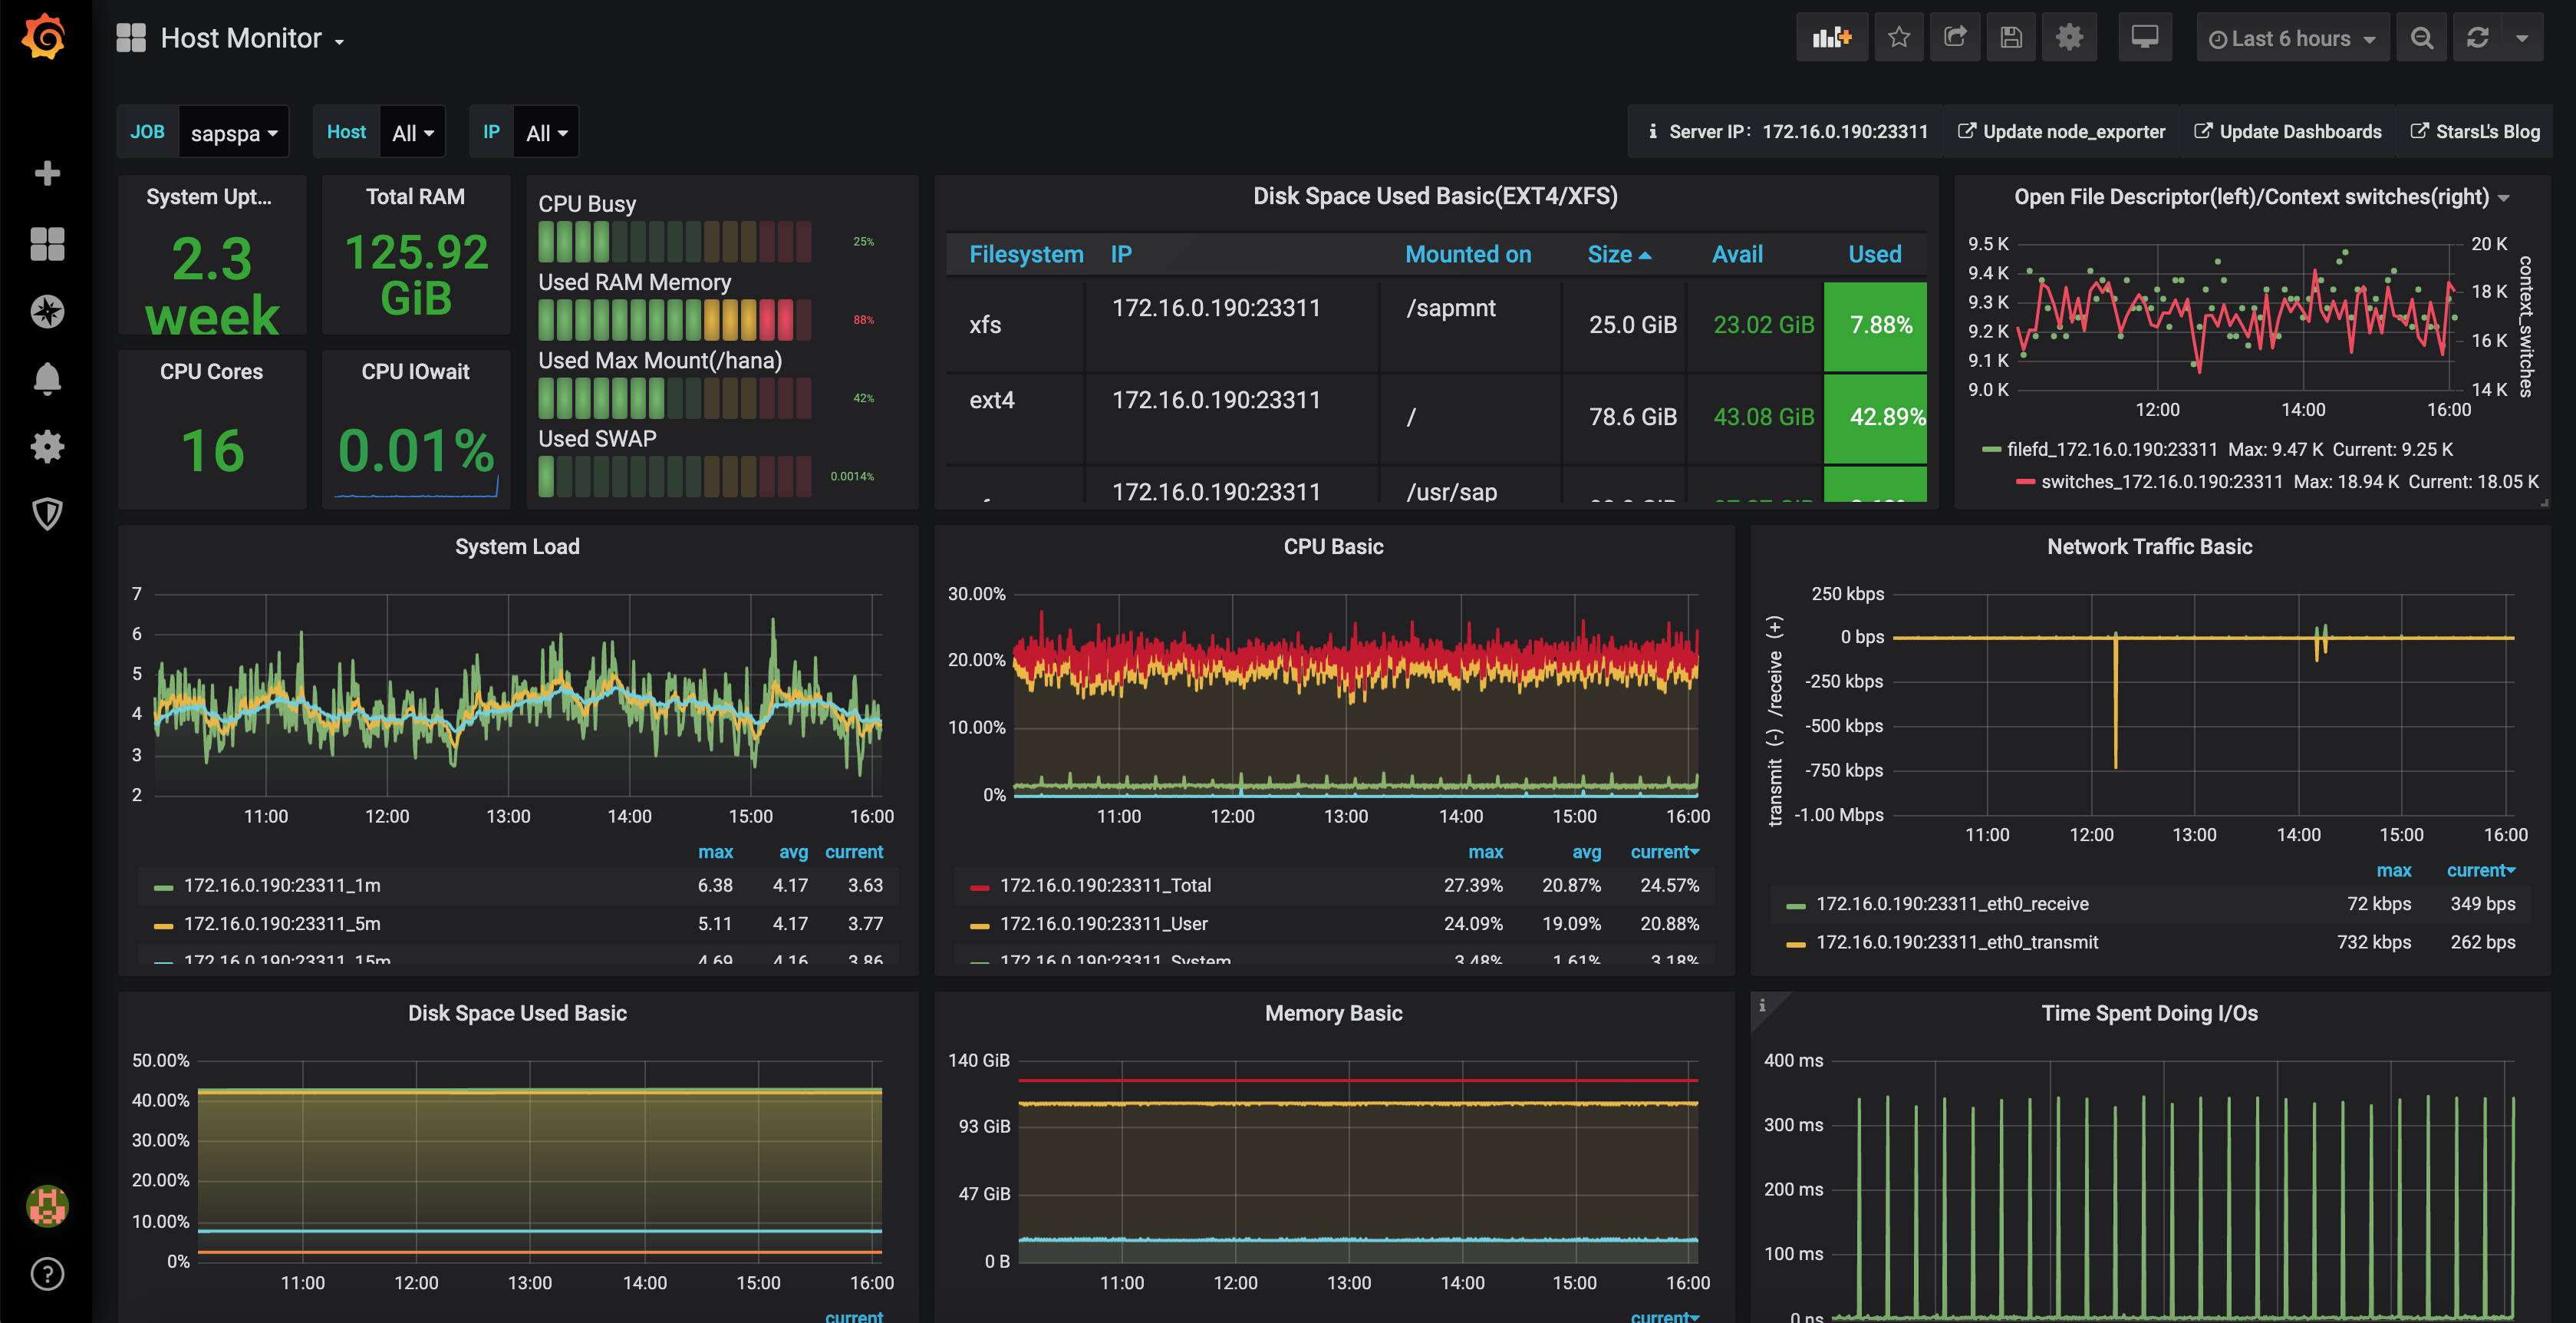
 Host Monitor
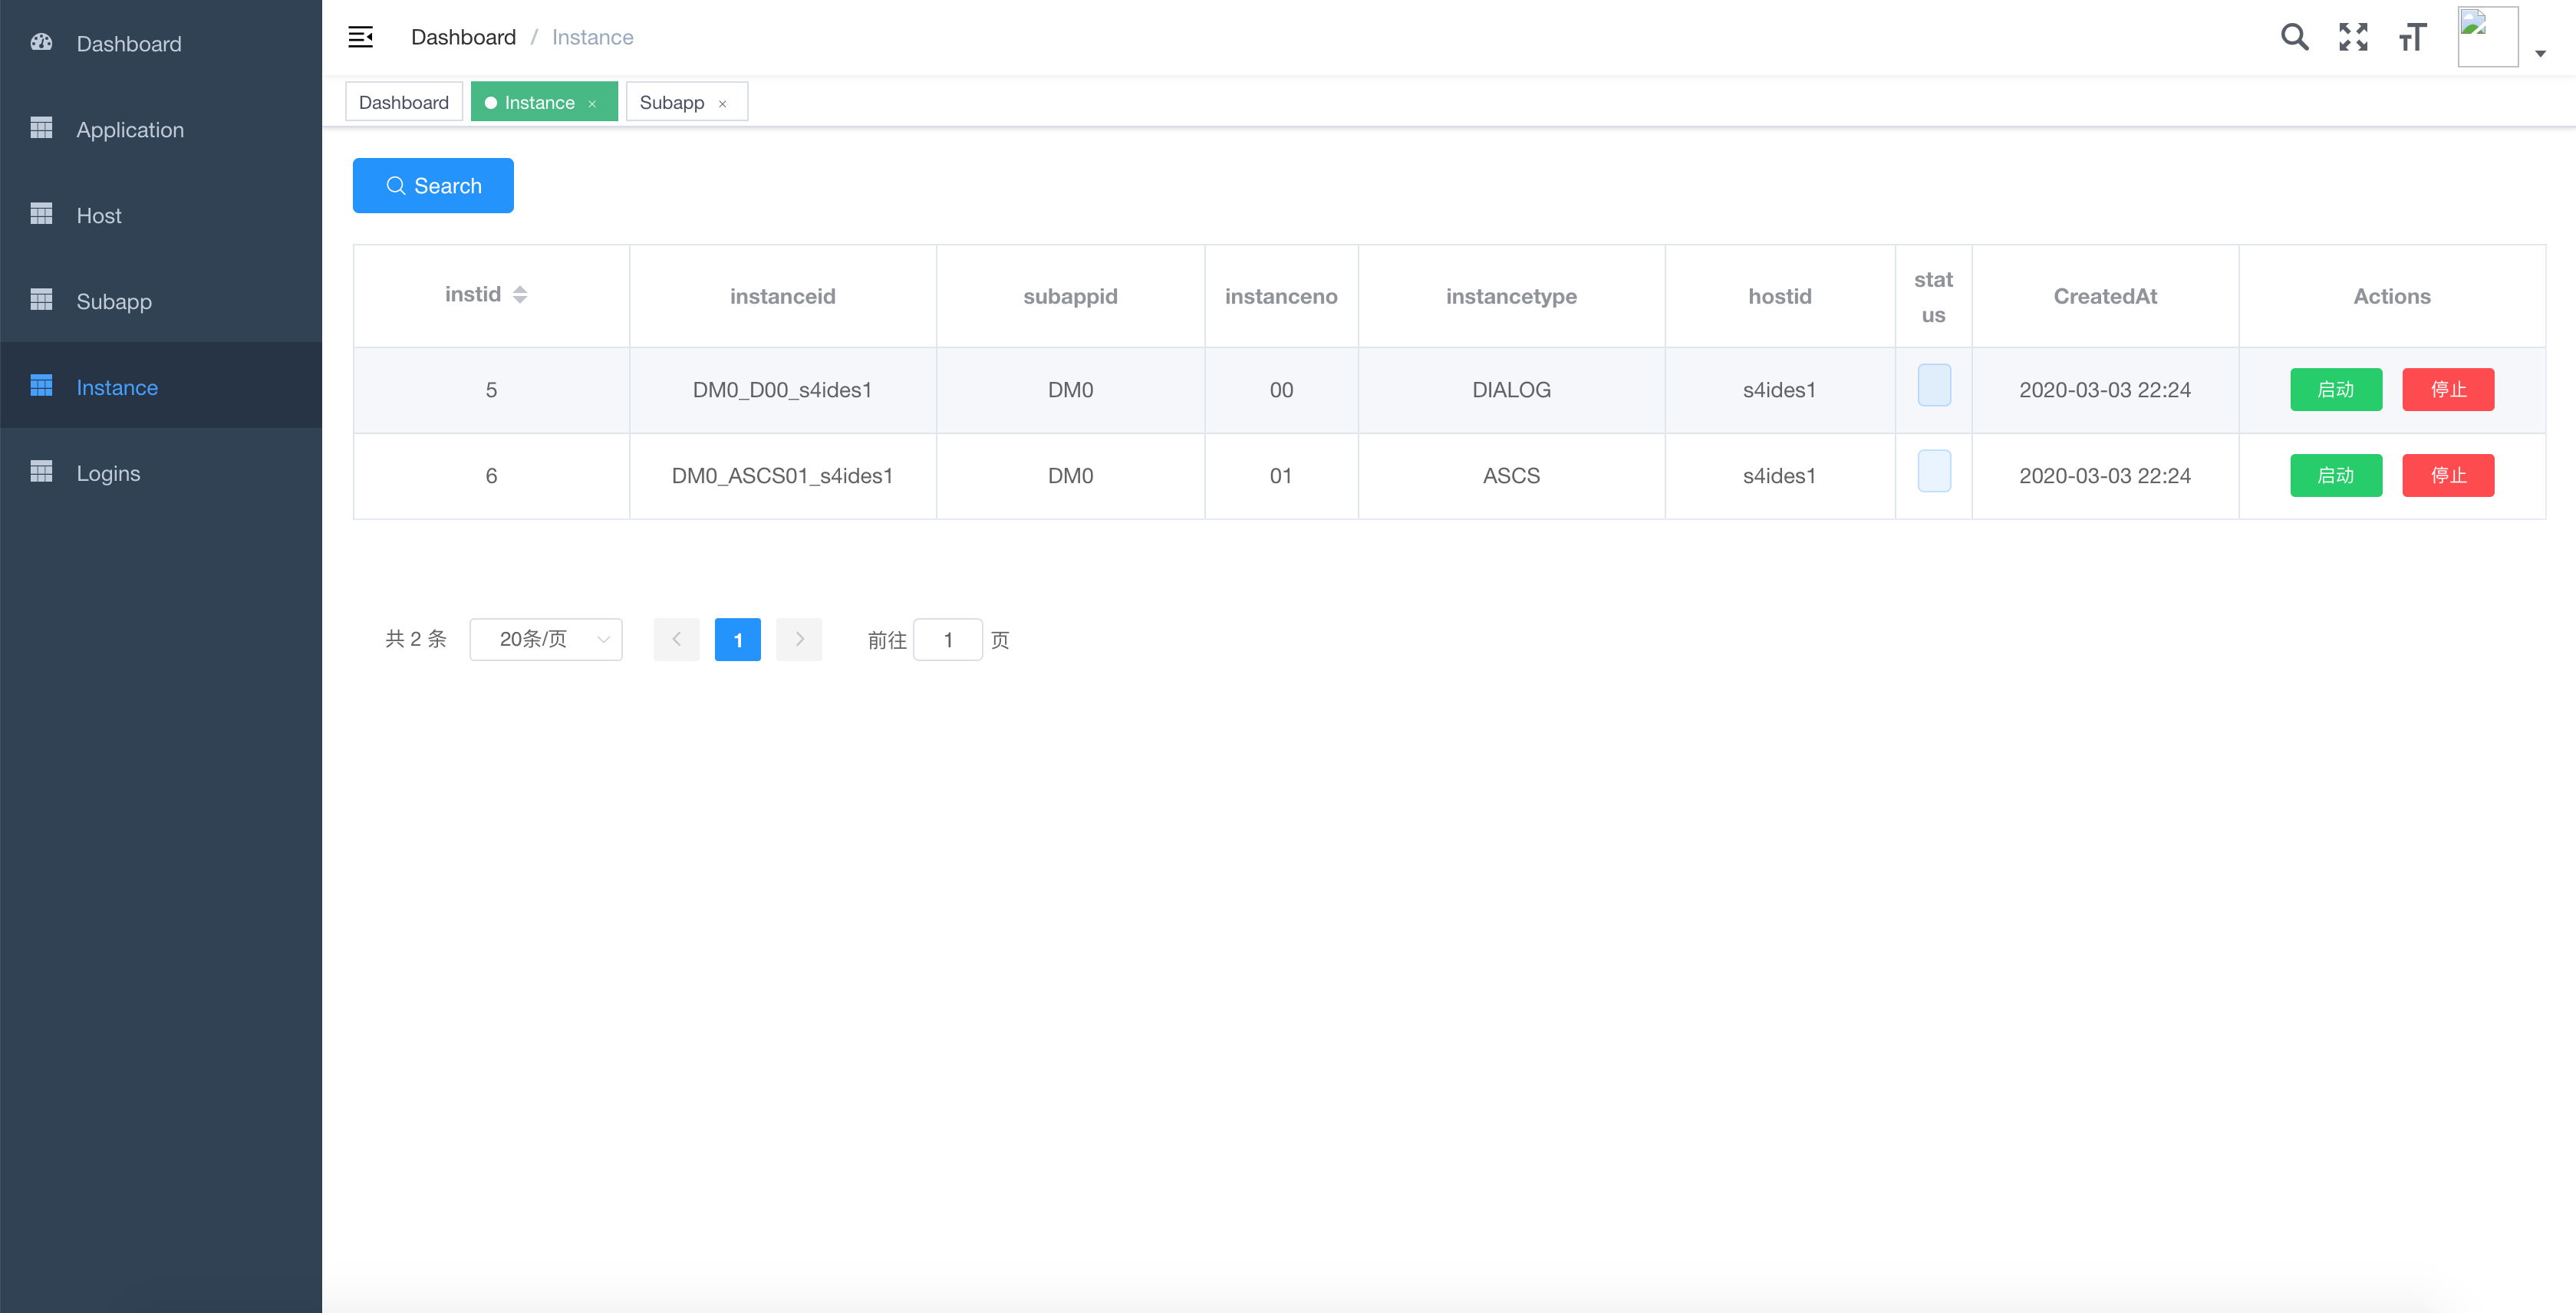
 Dashboard
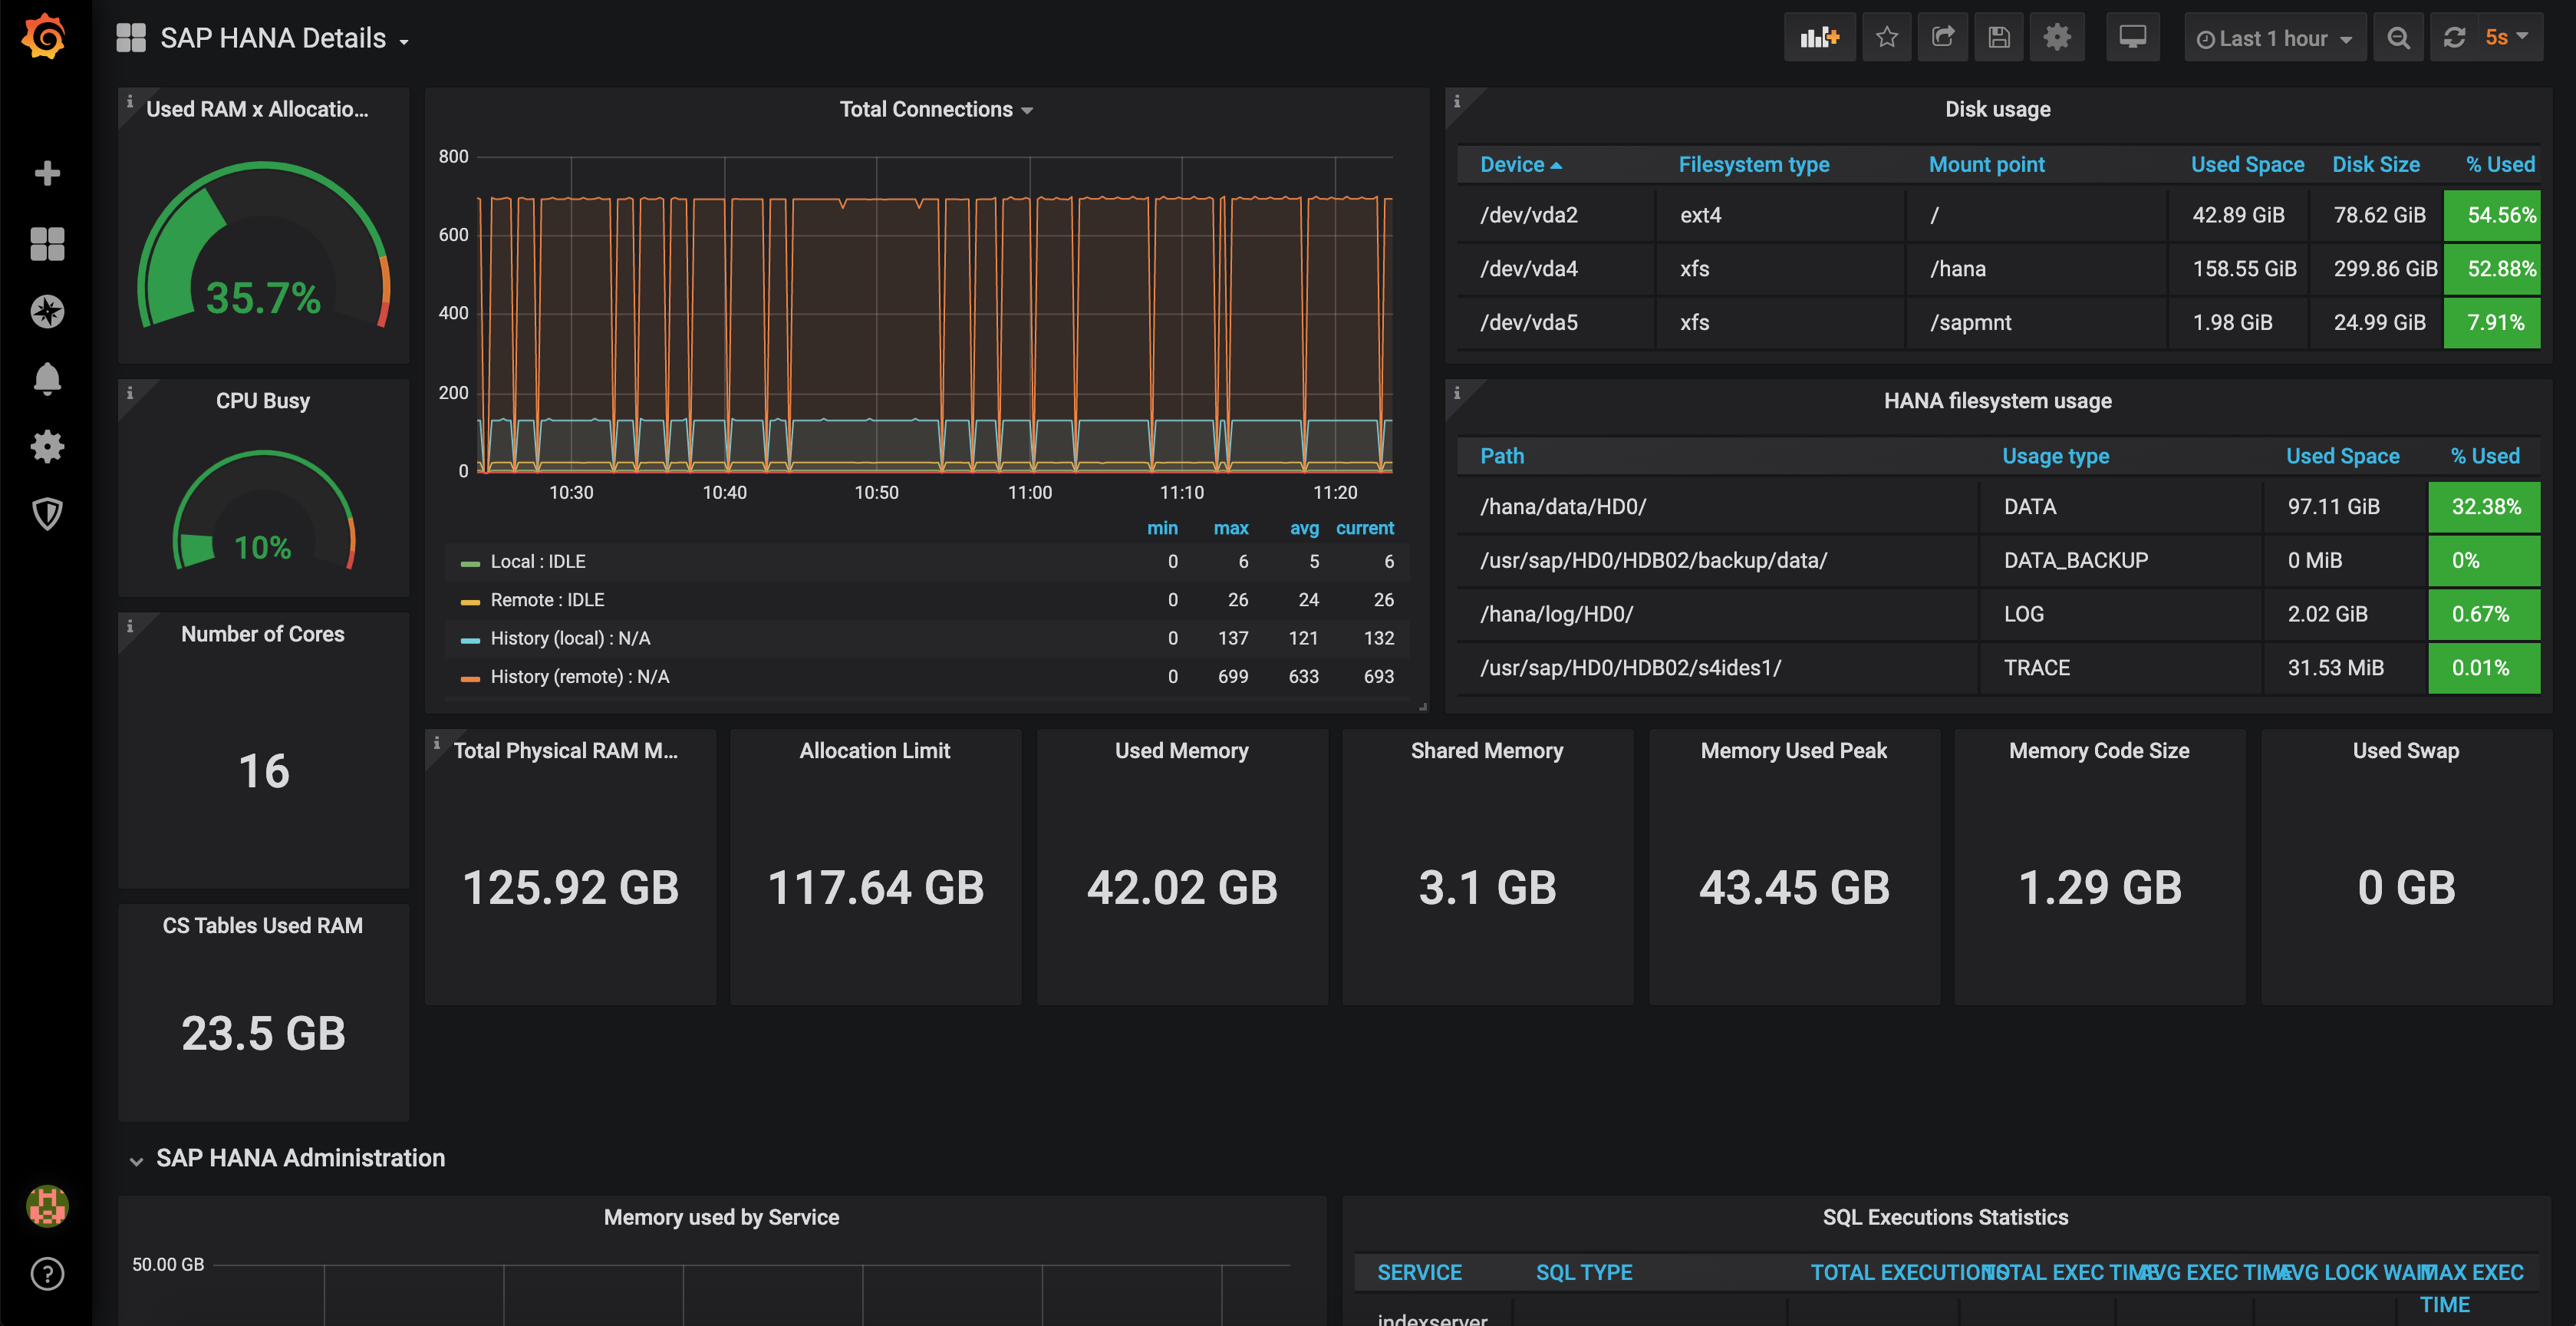
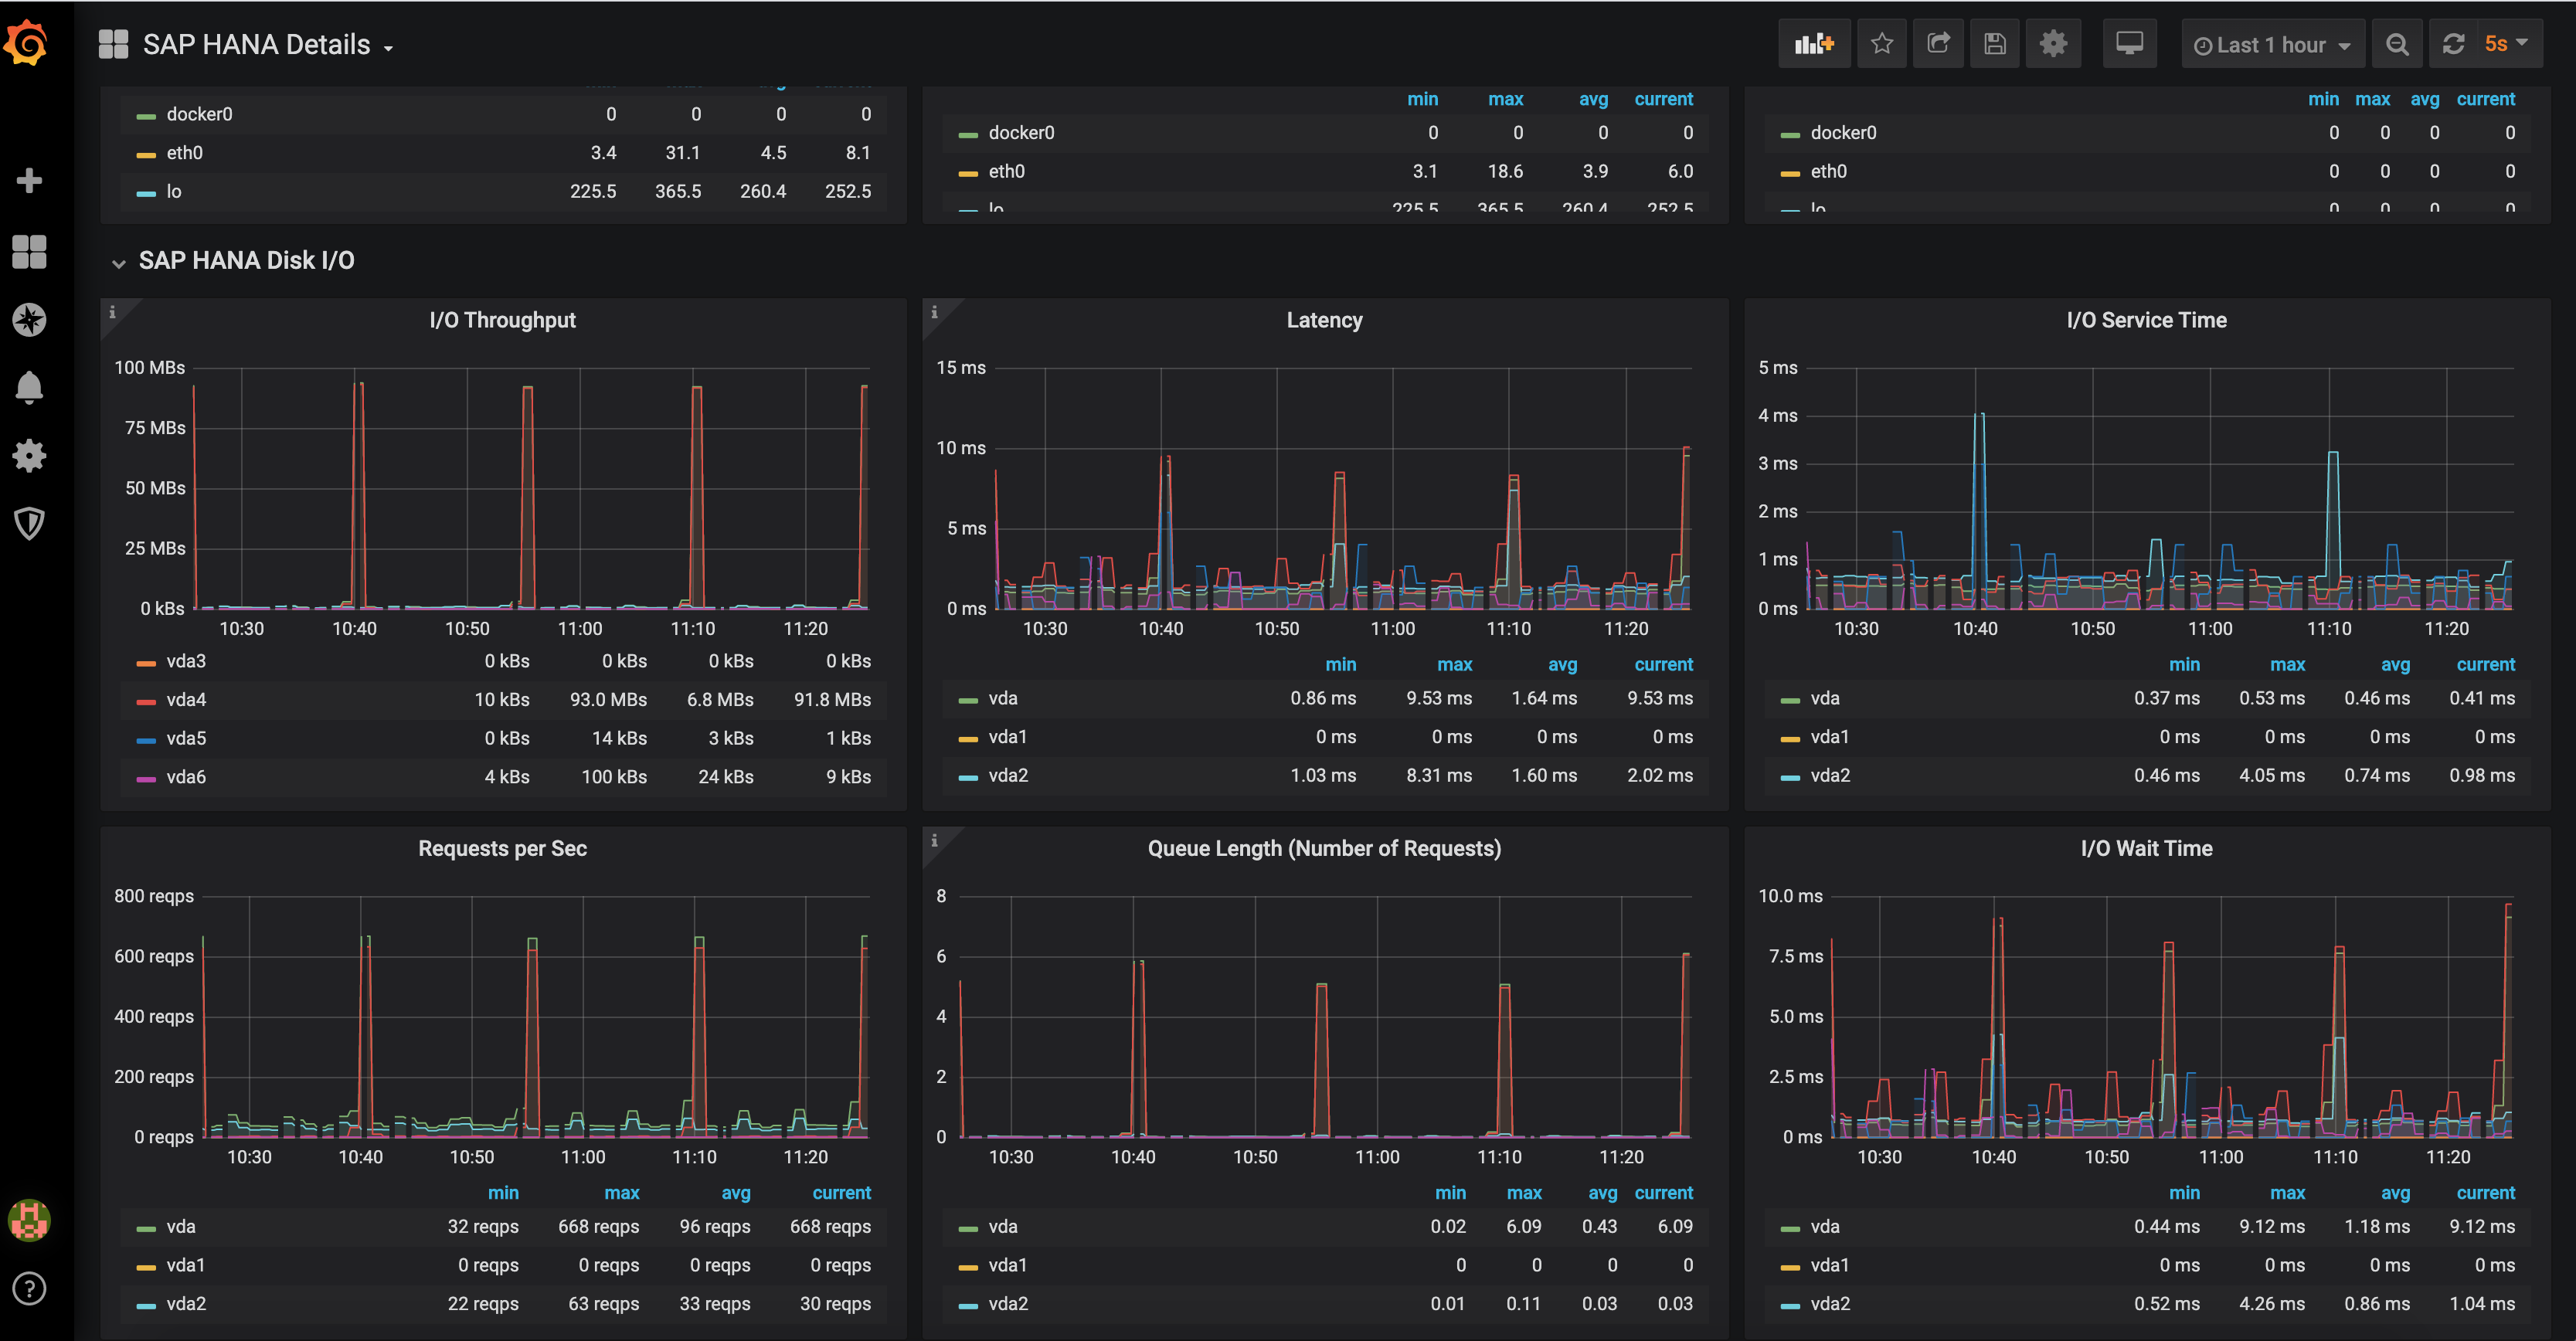
 HANA Monitor
assume you have a master machine which will run SAPSPA master app and IP address is {MASTER_IP}
wget https://github.com/redbearder/sapspa/archive/latest.tar.gz
tar zxvf latest.tar.gz
- With Script
cd sapspa/script
bash start_master.sh --master=MASTER_IP
- With Docker
cd sapspa/docker-compose
docker-compose -f docker-compose-master.yml up -d
- With Script
cd sapspa/script
bash start_agent.sh --master=MASTER_IP
- With Docker
cd sapspa/docker-compose
sed -i "s?192.168.50.210?MASTER_IP?g" docker-compose-agent.yml
docker-compose -f docker-compose-agent.yml up -d
- With Script
cd sapspa/script
bash start_hana_monitor_agent.sh --master=MASTER_IP
# download exporter and unpack
wget https://github.com/iamseth/oracledb_exporter/releases/download/0.2.9/oracledb_exporter.0.2.9-ora18.5.linux-amd64.tar.gz
# export Oracle location:
export DATA_SOURCE_NAME=system/password@oracle-sid
# or using a complete url:
export DATA_SOURCE_NAME=user/password@//myhost:1521/service
# Then run the exporter
/path/to/binary/oracledb_exporter -l log.level error -l web.listen-address 23313
- Reference: https://github.com/iamseth/oracledb_exporter
- Dashboard http://MASTER_IP:23380/
- Grafana http://MASTER_IP:23330/
- Kibana http://MASTER_IP:23356/
- Prometheus http://MASTER_IP:23390/
- Consul http://MASTER_IP:23345/
- backend app list
- backend subapp list
- backend host list
- backend instance list and relation redirect
- admin and backend basic auth
- 23381 port support /api /mapi
- 23380 port support /admin
- single instance start/stop control
- app all instance start/stop control by sequence
- instance move
- instance copy
- instance auto fix rules panel
- common readtable rfc function , port 23310
- usercount status data
- workprocess status
- background job status V_OP
- dump status
- instance status
- transport status
- rfc resource status
- Consul, port 8300: 23340, 8302: 23342, 8301: 23341, 8600: 23346, 8500: 23345
- node_exporter, port 23311
- hana_exporter, port 23312
- oracle_exporter, port 23313
- single instance start/stop control
- app all instance start/stop control by sequence
- status api
- instance move
- instance copy
- auto fix atom operation
- kill os process
- pull st03 workload monitor data to prometheus
- pull st03 workload monitor data to es
- pull st02 workload monitor data to prometheus
- pull st02 workload monitor data to es
- pull db02 workload monitor data to prometheus
- pull db02 workload monitor data to es
- TBD: stad
- es, port 23392, 23393
- kibana, port 23356
- filebeat and live reload
- prometheus, port 23390
- usercount list and user type dist
- workprocess list and type
- background job status
- dump status SNAP
- instance status
- st03 status
- db02 status
- hana status
- oracle status
- transport status
- rfc resource status
- os monitor
- mysql monitor
- es monitor
- grafana, port 23330
- alert
- master
- agent
- agent
- master
- hana_monitor
- todo...
maybe some code here
Thanks to:
- hanadb_exporter - HANA Prometheus Exporter.
- oracledb_exporter - Prometheus Oracle database exporter.