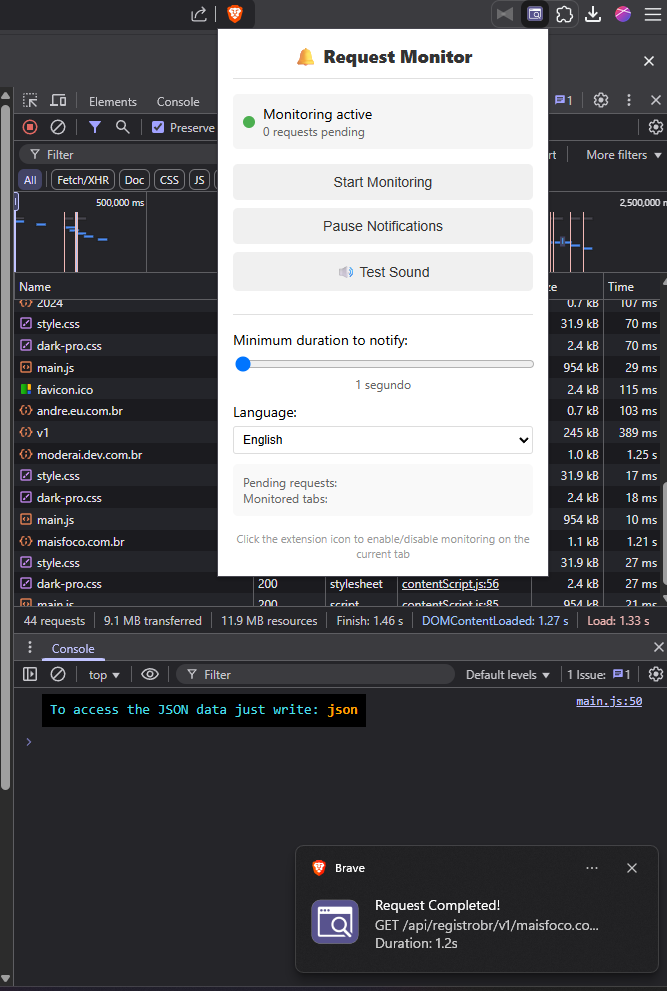
A Chrome extension that monitors HTTP requests in DevTools and provides audio notifications when long-running requests complete.
- Real-time Request Monitoring: Tracks HTTP requests using Chrome's debugger API
- Audio Notifications: Plays sound alerts when requests take longer than a specified duration
- Visual Notifications: Shows browser notifications with request details
- Configurable Duration: Set minimum request duration (1-30 seconds) to trigger notifications
- Tab Management: Monitor multiple tabs independently
- Request Filtering: Automatically ignores static resources (CSS, JS, images, etc.)
- Clean Interface: Simple popup interface for easy control
- Download or clone this repository
- Open Chrome and navigate to
chrome://extensions/ - Enable "Developer mode" in the top right corner
- Click "Load unpacked" and select the extension folder
- The Request Monitor icon will appear in your toolbar
- Start Monitoring: Click the extension icon or use the popup to start monitoring the current tab
- Configure Duration: Use the slider in the popup to set the minimum request duration (default: 3 seconds)
- Test Audio: Click "Test Sound" to verify audio notifications are working
- Pause/Resume: Toggle notifications globally without stopping monitoring
- Status Indicator: Green dot = active monitoring, Red dot = notifications paused
- Pending Requests: Shows current number of ongoing requests
- Monitored Tabs: Displays how many tabs are being monitored
- Duration Slider: Adjust the minimum time threshold for notifications
- Default Icon: No monitoring active on current tab
- Active Icon: Monitoring enabled on current tab
- Debugger API: Uses Chrome's debugger API to attach to tabs and monitor network events
- Request Tracking: Captures
Network.requestWillBeSentandNetwork.responseReceivedevents - Duration Calculation: Measures time between request start and completion
- Smart Filtering: Ignores static resources to focus on API calls and dynamic content
- Audio Feedback: Generates audio notifications using Web Audio API
RequestMonitor/
├── manifest.json          # Extension configuration
├── background.js          # Main monitoring logic (service worker)
├── content.js            # Audio playback functionality
├── popup.html            # Extension popup interface
├── popup.js              # Popup functionality and controls
├── debug.js              # Debug utilities and request interception
├── icon16.png            # Extension icon (16x16)
├── icon48.png            # Extension icon (48x48)
├── icon128.png           # Extension icon (128x128)
└── README.md             # This file
activeTab: Access to the currently active tabdebugger: Attach debugger to monitor network requestsnotifications: Show browser notificationsstorage: Save user preferencestabs: Manage multiple tab monitoring<all_urls>: Monitor requests on any website
- Chrome (Manifest V3)
- Chromium-based browsers
- Requires Chrome 88+ for full functionality
- Uses Web Audio API for cross-platform audio generation
- Fallback to HTML5 Audio API if Web Audio is unavailable
- No external audio files required
- Minimum Duration: 3 seconds
- Audio Enabled: Yes
- Notifications Enabled: Yes
- Static Resource Filtering: Enabled
The extension automatically ignores requests for:
- JavaScript files (
.js) - CSS files (
.css) - Images (
.png,.jpg,.jpeg,.gif,.ico,.svg) - Fonts (
.woff,.woff2)
- Clone the repository
- No build process required - load directly as unpacked extension
- Make changes to source files
- Reload extension in
chrome://extensions/
The debug.js file provides additional debugging capabilities:
- Request interception logging
- Audio system testing
- Web Audio API compatibility checks
- Check browser audio permissions
- Ensure tab is not muted
- Try the "Test Sound" button in the popup
- Check if Web Audio API is supported
- Refresh the target webpage
- Check if debugger is already attached by another tool
- Verify extension permissions are granted
- Try reloading the extension
- Reduce the number of monitored tabs
- Check if monitoring very high-traffic websites
- Consider increasing the minimum duration threshold
- No Data Collection: The extension does not collect or transmit any user data
- Local Processing: All monitoring happens locally in your browser
- No External Servers: No communication with external services
- Minimal Permissions: Only requests necessary permissions for functionality
Contributions are welcome! Please feel free to submit issues, feature requests, or pull requests.
- Follow existing code style
- Test thoroughly across different websites
- Ensure compatibility with Manifest V3
- Document any new features
This project is open source. Feel free to use, modify, and distribute according to your needs.
- Initial release
- Basic request monitoring
- Audio notifications
- Configurable duration threshold
- Multi-tab support
- Static resource filtering
Note: This extension requires debugger permissions to monitor network requests. This is necessary for the core functionality and is used only for monitoring HTTP requests on tabs you explicitly enable monitoring for.
