The project contains sample reports in which you can learn how to customize the XRCrossTab control. Run the project, in the application window select the desired example, and click the Design button to show the report.
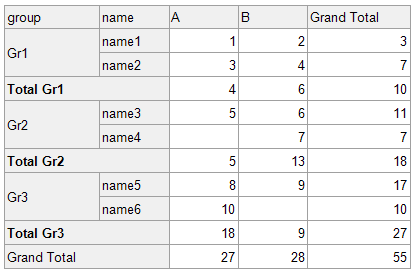
The Crosstab control has the name data field in rows, the store data field in columns, the value data field in data area. The name rows are grouped by the group data field.
The original report preview is shown below:
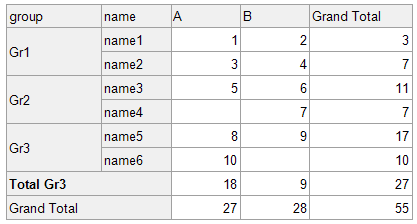
The report in this example hides the totals for the Gr1 and Gr2 group field values, so only the Gr3 total remains.
Implementation:
Select the row header cell for the Totals row. The cell's coordinates are [0, 2], the name is crossTabHeaderCell3, and the cell displays the 'Total[group]' text in the Report Designer. Invoke the Expression Editor and assign the following expression to the RowVisible property:
[group] == 'Gr3'"
The resulting report preview is shown in the follolwing image:
The Crosstab control has the name data field in rows, the store data field in columns, the value data field in data area. The name rows are grouped by the group data field.
The original report preview is shown below:
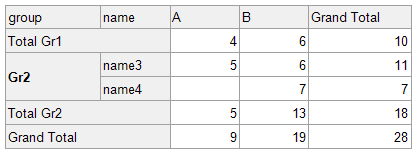
The report in this example hides the records in the Gr1 group. The Gr1 group total remains, the records and totals for other groups remain as well.
Implementation:
Select the row header cell in the row bound to the [group] field. The cell coordinates are [0, 1], the cell name is crossTabHeaderCell2, and the cell displays the [group] text in the Report Designer.
Invoke the Expression Editor and assign the following expression to the RowVisible property:
[group] != 'Gr1'
Note that a cell located in a nested group can access a data field bound to the parent (outer) group, but cannot access a data field bound to the child (inner) group. This means that this expression would work when assigned to the adjacent row header at the left with coordinates [1,1], which displays the [name] text in the Report Designer. However, this is impractical, because the number of calculations increases several times.
The resulting report preview is shown in the following image:
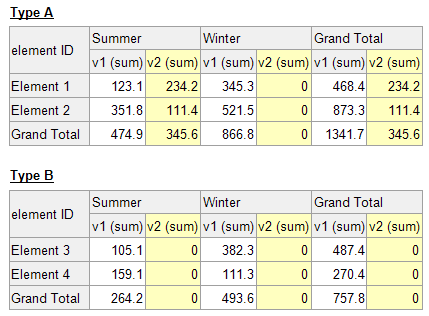
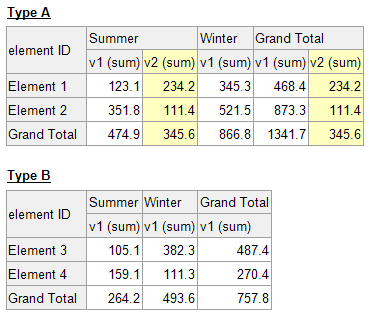
The Crosstab control has the elementID data field in rows, the season data field in columns, the value1 and value2 data fields in the data area. The value2 field is 0 (zero) for several records whose elementType field is Type A, and is missing for the records whose elementType field is Type B.
An empty column/row can appear in the following situations:
- Type A. Certain column/row items have no values for a particular field when the control displays several data fields.
- Type B. Column/row values are null (a 0 (zero) may be displayed, but there is no value).
Depending on the location of the data fields, horizontally or vertically, an empty column or an empty row may appear.
The original report preview is shown below:
The report in this example hides a column/row if it has no non-zero values (missing, equal to null, or equal to 0).
Implementation:
Select the Total cell for the column bound to the [value2] field. The cell coordinates are [2, 3]; the cell name is crossTabTotalCell4.
Invoke the Expression Editor and assign the following expression to the ColumnVisible property:
[value2] > 0
Assign the same expression to the ColumnVisible property of the crossTabTotalCell6 with coordinates [4,3] to hide the corresponding totals.
The resulting report preview is shown in the following image:
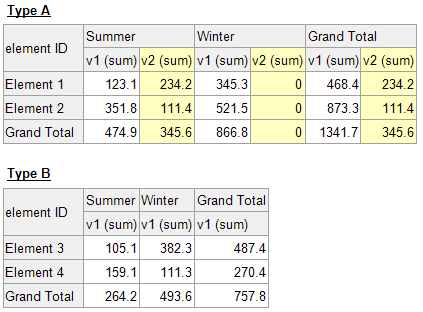
The Crosstab control has the elementID data field in rows, the season data field in columns, the value1 and value2 data fields in the data area. The value2 field is 0 (zero) for several records whose elementType field is Type A, and is missing for the records whose elementType field is Type B.
An empty column/row can appear in the following situations:
- Type A. Certain column/row items have no values for a particular field when the control displays several data fields.
- Type B. Column/row values are null (a 0 (zero) may be displayed, but there is no value).
The original report preview is shown below:
The report in this example hides the column/row if it has no values (or values equal to null), but displays the column/row if it has any values, including 0 (zero).
Implementation:
-
Create a
cfValue2calculated field with the following expression:[value2] -
Drag the newly created calculated field from the Field List window and drop it onto the CrossTab control's data area.
-
Select the cell bound to the
cfValue2field and change the SummaryType to Count. -
Select the Total cell for the column bound to the
[value2]field. The cell coordinates are [2, 3]; the cell name is crossTabTotalCell4. Invoke the Expression Editor and assign the following expression to the ColumnVisible property:[cfValue2] > 0 -
Select the Total cell for another column bound to the
[value2]field. The cell coordinates are [5, 3]; the cell name is crossTabTotalCell6. Invoke the Expression Editor and assign the following expression to the ColumnVisible property:[cfValue2] > 0 -
Hide all columns and rows bound to the
cfValue2calculated field. For this, set the ColumnVisible property to false for cells [3,3] and [6,3] in the data area.
The resulting report preview is shown in the following image:
(you will be redirected to DevExpress.com to submit your response)


