Danfo.js is a javascript package that provides fast, flexible, and expressive data structures designed to make working with "relational" or "labeled" data both easy and intuitive. It is heavily inspired by Pandas library, and provides a similar API. This means that users familiar with Pandas, can easily pick up danfo.js.
- Danfo.js is fast and supports Tensorflow.js tensors out of the box. This means you can convert Danfo data structure to Tensors.
- Easy handling of missing-data (represented as
NaN) in floating point as well as non-floating point data - Size mutability: columns can be inserted/deleted from DataFrame
- Automatic and explicit alignment: objects can
be explicitly aligned to a set of labels, or the user can simply
ignore the labels and let
Series,DataFrame, etc. automatically align the data for you in computations - Powerful, flexible groupby functionality to perform split-apply-combine operations on data sets, for both aggregating and transforming data
- Make it easy to convert Arrays, JSONs, List or Objects, Tensors and differently-indexed data structures into DataFrame objects
- Intelligent label-based slicing, fancy indexing, and querying of large data sets
- Intuitive merging and joining data sets
- Robust IO tools for loading data from flat-files (CSV, Json, Excel).
- Powerful, flexible and intutive API for plotting DataFrames and Series interactively.
- Timeseries-specific functionality: date range generation and date and time properties.
- Robust data preprocessing functions like OneHotEncoders, LabelEncoders, and scalers like StandardScaler and MinMaxScaler are supported on DataFrame and Series
To use Danfo.js via script tags, copy and paste the CDN below to the body of your HTML file
<script src="https://cdn.jsdelivr.net/npm/danfojs@0.3.4/lib/bundle.min.js"></script> See all available versions here
See the example below in Code Sandbox
<!DOCTYPE html>
<html lang="en">
<head>
    <meta charset="UTF-8">
    <meta name="viewport" content="width=device-width, initial-scale=1.0">
    <script src="https://cdn.plot.ly/plotly-2.2.0.min.js"></script>
    <script src="https://cdn.jsdelivr.net/npm/danfojs@0.3.4/lib/bundle.min.js"></script>

    <title>Document</title>
</head>

<body>

    <div id="div1"></div>
    <div id="div2"></div>
    <div id="div3"></div>

    <script>

        dfd.read_csv("https://raw.githubusercontent.com/plotly/datasets/master/finance-charts-apple.csv")
            .then(df => {

                df['AAPL.Open'].plot("div1").box() //makes a box plot

                df.plot("div2").table() //display csv as table

                new_df = df.set_index({ column: "Date" }) //resets the index to Date column
                new_df.plot("div3").line({ columns: ["AAPL.Open", "AAPL.High"] })  //makes a timeseries plot

            }).catch(err => {
                console.log(err);
            })

    </script>

</body>

</html>
Output in Browser:
Danfo.js is hosted on NPM, and can installed via package managers like npm and yarn
npm install danfojs-nodeconst dfd = require("danfojs-node")
const file_url = "https://web.stanford.edu/class/archive/cs/cs109/cs109.1166/stuff/titanic.csv"
dfd.read_csv(file_url)
.then(df => {
//prints the first five columns
df.head().print()
// Calculate descriptive statistics for all numerical columns
df.describe().print()
//prints the shape of the data
console.log(df.shape);
//prints all column names
console.log(df.columns);
// //prints the inferred dtypes of each column
df.ctypes.print()
//selecting a column by subsetting
df['Name'].print()
//drop columns by names
cols_2_remove = ['Age', 'Pclass']
df_drop = df.drop({ columns: cols_2_remove, axis: 1 })
df_drop.print()
//select columns by dtypes
let str_cols = df_drop.select_dtypes(["string"])
let num_cols = df_drop.select_dtypes(["int32", "float32"])
str_cols.print()
num_cols.print()
//add new column to Dataframe
let new_vals = df['Fare'].round(1)
df_drop.addColumn({ column: "fare_round", values: new_vals, inplace: true })
df_drop.print()
df_drop['fare_round'].round(2).print(5)
//prints the number of occurence each value in the column
df_drop['Survived'].value_counts().print()
//print the last ten elementa of a DataFrame
df_drop.tail(10).print()
//prints the number of missing values in a DataFrame
df_drop.isna().sum().print()
}).catch(err => {
console.log(err);
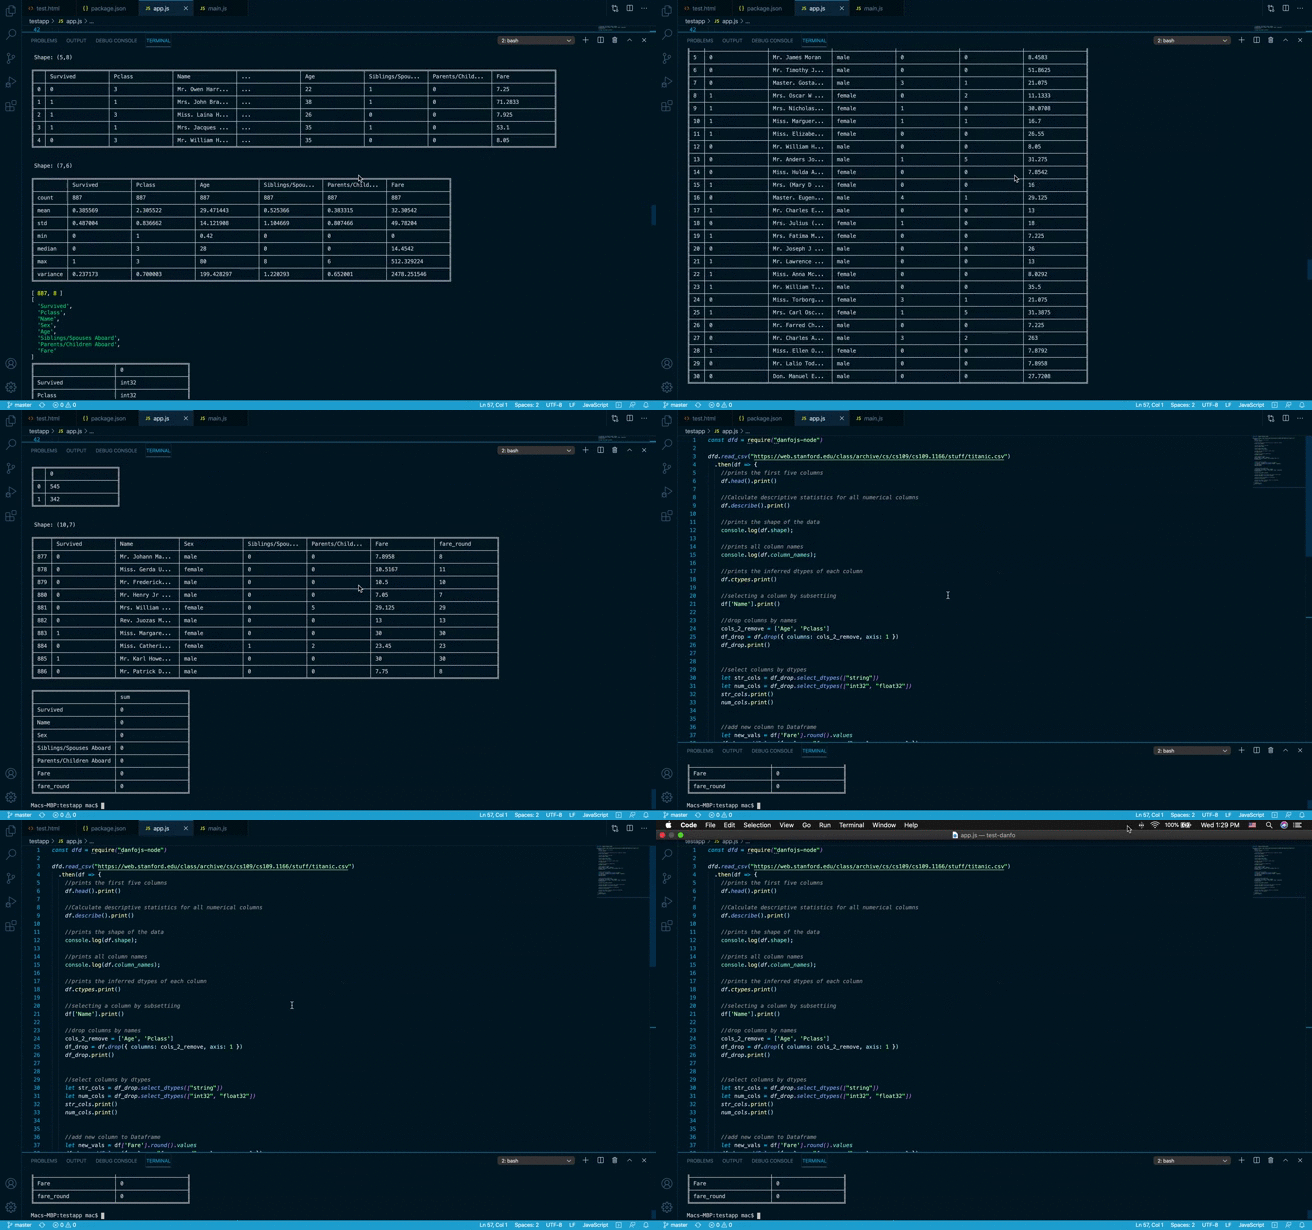
})Output in Node Console:
If you want to use Danfo in frontend frameworks like React/Vue, read this guide
- You can use Danfo.js on Dnotebooks playground here
- VsCode nodejs notebook extension now supports Danfo.js. See guide here
The official documentation can be found here
We recently published a book titled "Building Data Driven Applications with Danfo.js". Read more about it here
Development discussions take place here.
All contributions, bug reports, bug fixes, documentation improvements, enhancements, and ideas are welcome. A detailed overview on how to contribute can be found in the contributing guide.


