The Slurm Cluster Admin Stats (SCAS) dashboard has been developed to analyze the usage statistics of Slurm based HPC clusters.
It provides various statistics, their visualizations, and insights to the HPC stakeholders and cluster users.
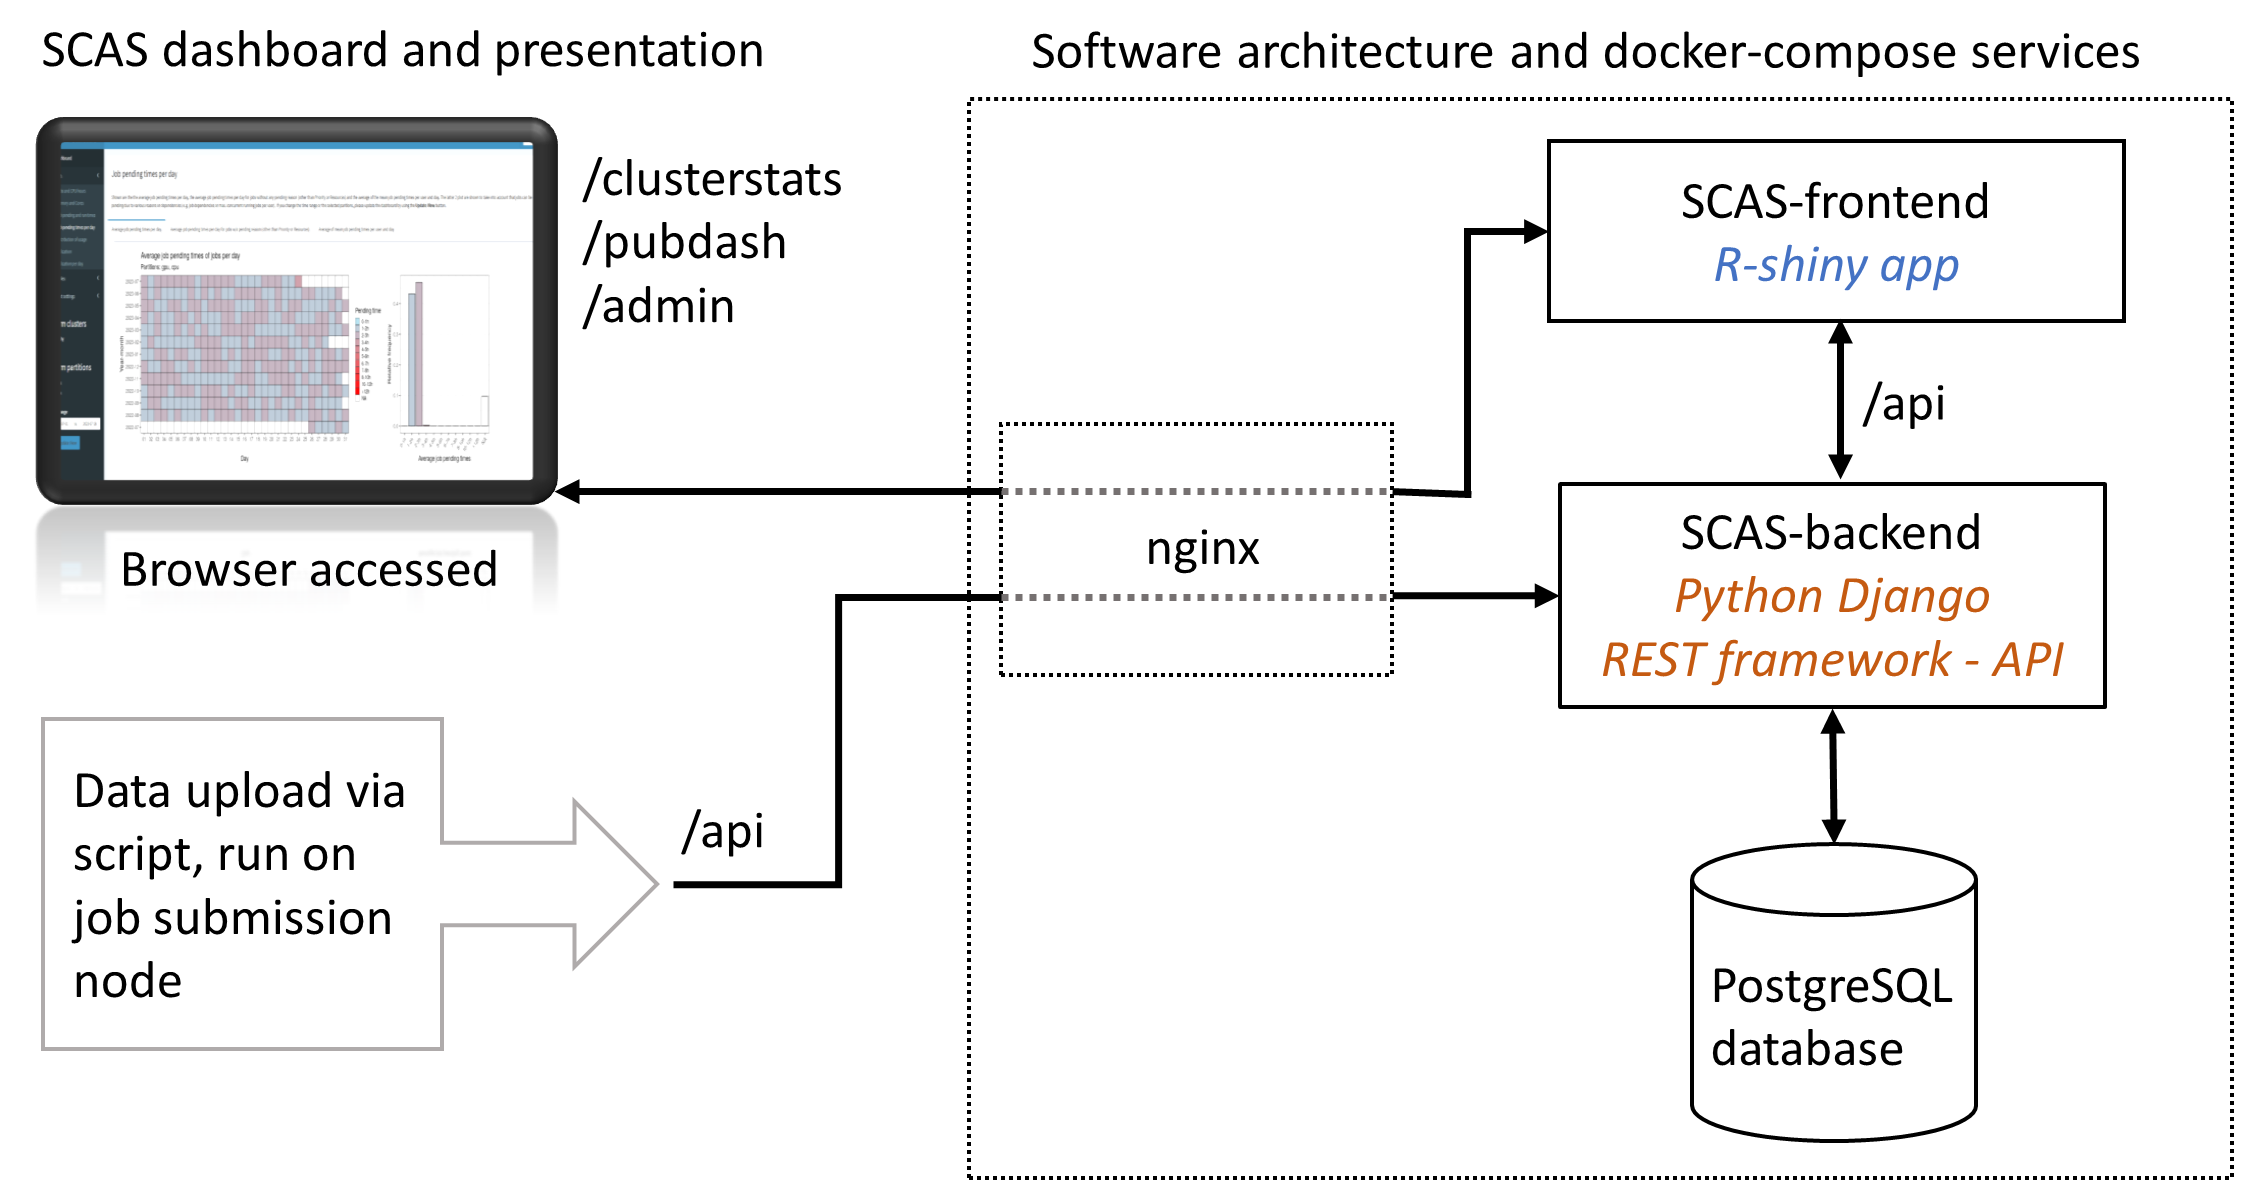
The software architecture is shown in Figue 1 below.
Figure 1: The dashboard and the presentation are accessed by the user through a web browser. New data can be uploaded to the SCAS dashboard by executing a script that regularly fetches the latest data from a job submission node. On the server side the architecture is organized into separate components (shown in dashed box): nginx (reverse proxy), SCAS-frontend, SCAS-backend and PostgresSQL database. A docker-compose implementation of the services is provided.
- Dashboad and presentation of cluster statistics
- User Admin and Login function for dashboard
- Data indexing and therefore low memory footprint and responsive frontend
- Support for multiple clusters
- Docker-compose based setup provided
For the selected date frame, the visualizations comprise:
- Number of Jobs, CPU and GPU hours per month
- Memory and cores requested by the users, displayed as contingency graphs
- Average job pending and runtimes per month and per day
- Distribution of CPU hours used vs. the percentage of users
- Utilization of the cluster in total and of individual nodes per month and day, summaries of utilization per CPU/GPU or memory type of the nodes per month
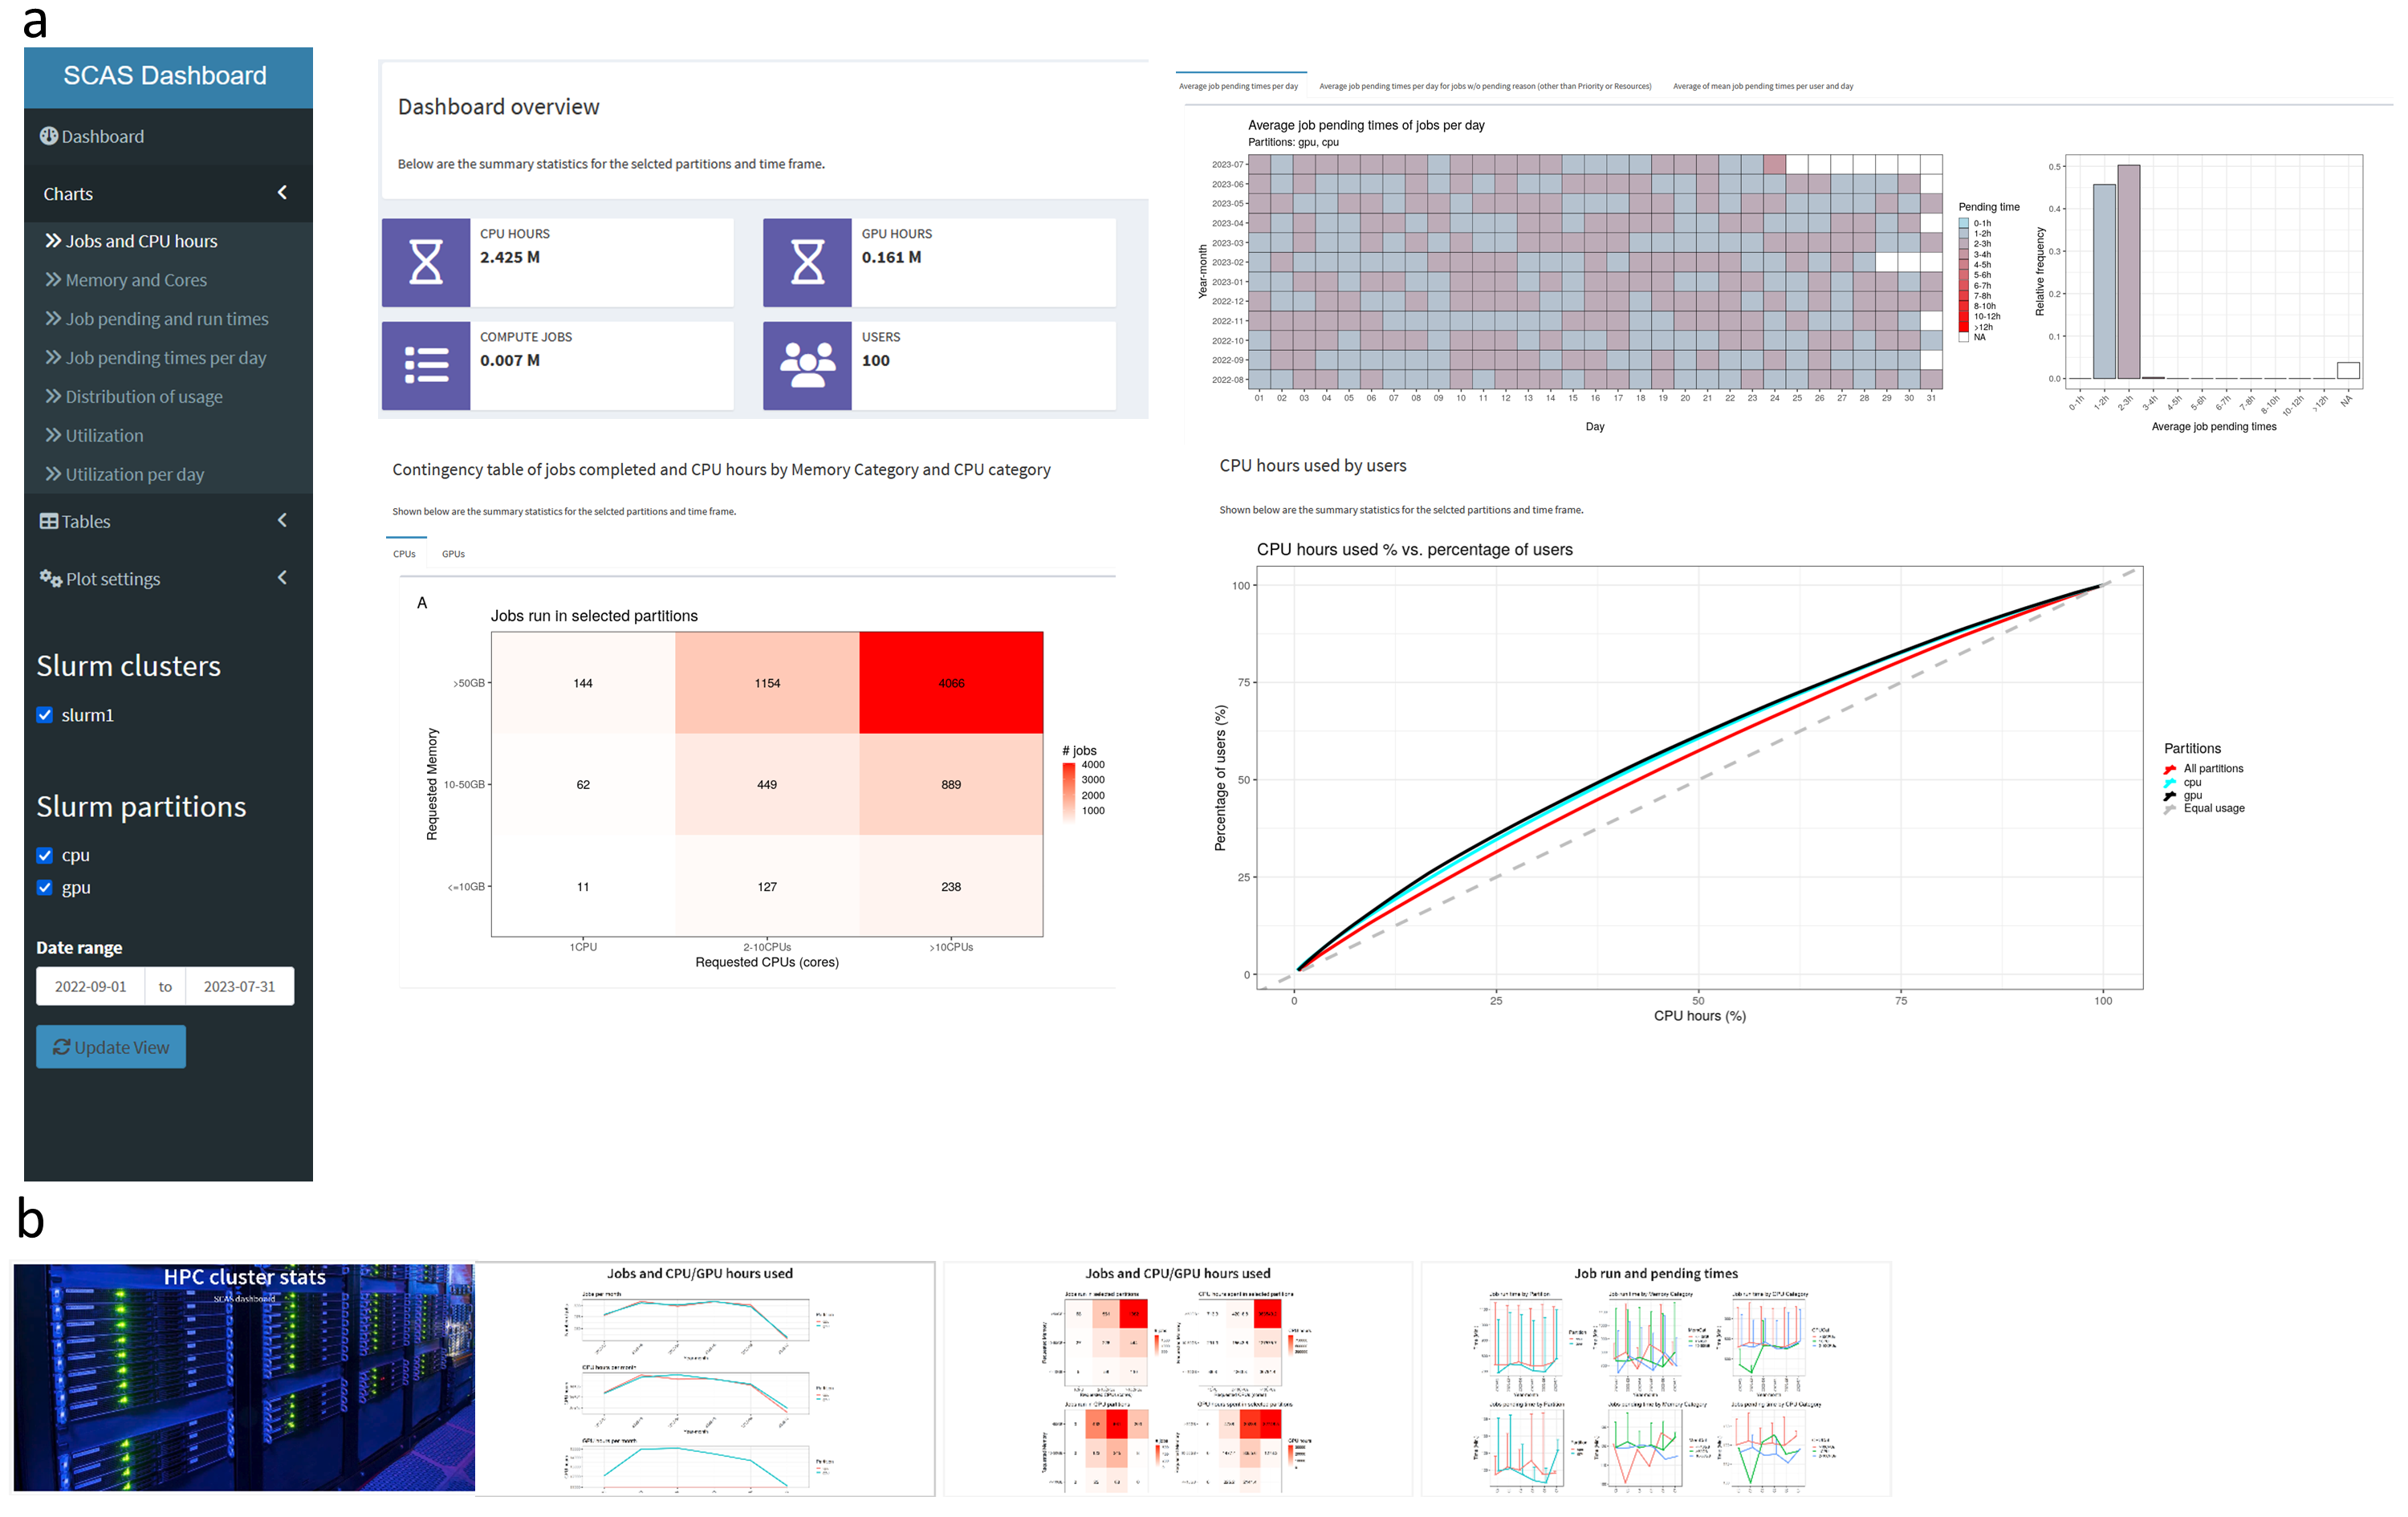
For presentation of the key figures to the cluster users, a presentation that can be run in the browser in carousel mode can be generated (see Figure 2b).

Figure 2: a. User interface of SCAS Dashboard with the navigation and select menu on the left side, statistics and graphics are displayed in the center panel (here shown are some example visualizations). b. Presentation slides that can be automatically generated to display key statistics and graphs on a screen.
Install Docker and docker-compose
Clone the repository and change to the docker directory.
Note that depending on the docker-compose installation the syntax of the commands is diferent. For the standalone docker-compose installation the command docker compose is docker-compose.
For example type docker-compose up -d when using compose standalone, instead of docker compose up -d.
Per default a self signed certificate is generated.
To use your own certificate, set SELF_SIGNED_SSL: false in docker-compose.yml for the service scas-nginx.
Bind mount your certicicate (certificate+key in one file) to /etc/dashboard.pem for the service scas-nginx.
Build images an run docker-compose to start the containers (nginx, frontend, backend, postgres):
To build: docker compose build
Run in detached mode: docker compose up -d
Forced rebuild of images: docker compose build --no-cache
Note: If you are using a MacBook with Apple Silicon Arm processors you will need to explicity tell
Docker to use the x86 versions of the containers by adding the command
export DOCKER_DEFAULT_PLATFORM=linux/amd64 before you run any docker compose commands.
This setup is intended for testing and will load the test data.
cd docker
docker exec scas-backend /usr/src/backend/init.sh
docker exec scas-backend python3 manage.py loaddata /scripts/testdata.json
This creates the superuser admin with password admin.
The default test data was generated from 2022-07 to 2023-08-23
See ./scripts/Readme.md for further info how to generate test data.
If tested locally on a laptop, the dashboard is available from: https://localhost/clusterstats/
The admin area is available from: https://localhost/admin/
The presentation mode is available from: https://localhost/pubdash/
Go to https://yourserver.edu/admin/ and login with the superuser account (user+password: admin), then go to Jobs, select 1 job and then select "Delete all jobs, Nodes, and YMDdata" from the dropdown.
Alternative, you can also delete the postgres container and volume:
Warning: This deletes the database volume and the database container, check beforehand the names of your container and volume with docker ps -a and docker volume ls.
docker compose stop
docker rm scas-postgres
docker volume rm docker_pgdatascas
Important note: If you use this instance in production, change the password of the admin user in https://yourserver.edu/admin/auth/user/.
Database settings can be changed in the file docker/dashboard.env
cd docker
docker exec scas-backend /usr/src/backend/init.sh
Create a superuser (and password) with:
docker compose run scas-backend python3 manage.py createsuperuser
Go to https://yourserver.edu/admin/ and login with the superuser account that you created, then go to Users to create new users (e.g. a user that is used to upload new data from a submission node).
The app is accessible from https://yourserver.edu/clusterstats/. Login with a user created in the admin interface (or with the superuser).
The app can create a Quarto presentation that can be run in carousel mode on a screen. It can be accessed from https://yourserver.edu/pubdash, fullscreen mode is possible with key f and carousel mode is activated by the play button.
Settings for the public dashboard are available from the Settings in https://yourserver.edu/admin/
Per default, the data is generated for the past 6 month, image height is set to 1000px, the page reloads after 12 hours to update the data and plots. The presentation is available without login.
From the scripts folder, the script SlurmDashboard_send_data.py is available to add new data to the app.
The requirements can be installed with pip install -r requirements.txt
On a cluster login node where the sacct and sinfo commands are available, the following command will send the data from 2021-01-01 to 2021-06-30 to the Dashboard application.
To authenticate, create a file name login.conf (see example file) with username and password.
This user has to be created using the admin interface.
./SlurmDashboard_send_data.py --apiurl https://yourserver.edu/ --clusterid slurm1 --datestart 2021-01-01 --dateend 2021-06-30
Please note to use a --clusterid NAME to assign the jobs to a certain cluster.
For the initial import of the data, there is a limit for sacct export, 6 month periods should work well depending on the number of jobs that were run.
For regular inputs (e.g. by running as a cron job), the script can be used without --datestart and --dateend and will per default export -7 days to today (which will export jobs that ended on the day before today).
See --help for further options.
If you want to exclude certain partitions from the dashboard, go to https://yourserver.edu/admin/ --> ExcludePartition
The backend API documentation is available from https://yourserver.edu/docs/ (application needs to be running) and from https://bioinformatics-munich.github.io/scas_dashboard_api_documentation.
Thank you for your interest and time contributing to this project.
Note that all contributions must be complied with the CODE OF CONDUCT.
Contributions are welcome and greatly appreciated! To contribute, please follow the following guidelines:
- Check that the issue has not already been reported on the issue tracker.
- Submit an issue on the issue tracker using the corresponding form.
- Check that the feature request has not already been reported on the issue tracker.
- Submit a feature request on the issue tracker using the corresponding form.
Any contributions are welcomed. Please see CONTRIBUTIONS.md for the details.
SCAS dashboard is provided under the MIT license. See LICENSE.md file for the full text.
