The OptiSS is a tool to optimize geodetic spatial joining for assigning geographical attributes to social media data developed in the BORDERSPACE project at Digital Geography Lab.
The OptiSS tool has a user friendly local app (see: What does OptiSS do?, How to use OptiSS?, How to set up OptiSS?), but its Python script can be easily used in any workflow (Implementation of OptiSS in your workflow).
In the BORDERSPACE project, we need to assign hierarchical spatial attributes to each geo-located tweet. Mostly, geo-located tweets obtained from Twitter’s API already have geographical information such as administrative unit and country, in addition to exact coordinates. But not all tweets have such information and most importantly, some tweets are not located at land – some are just off the coast or somewhere in an ocean. However, geodetic spatial join requires computational resources and is time consuming and when having +100 million geo-located tweet it is not feasible. Thus, we created OptiSS tool to make computation more efficient and save time.
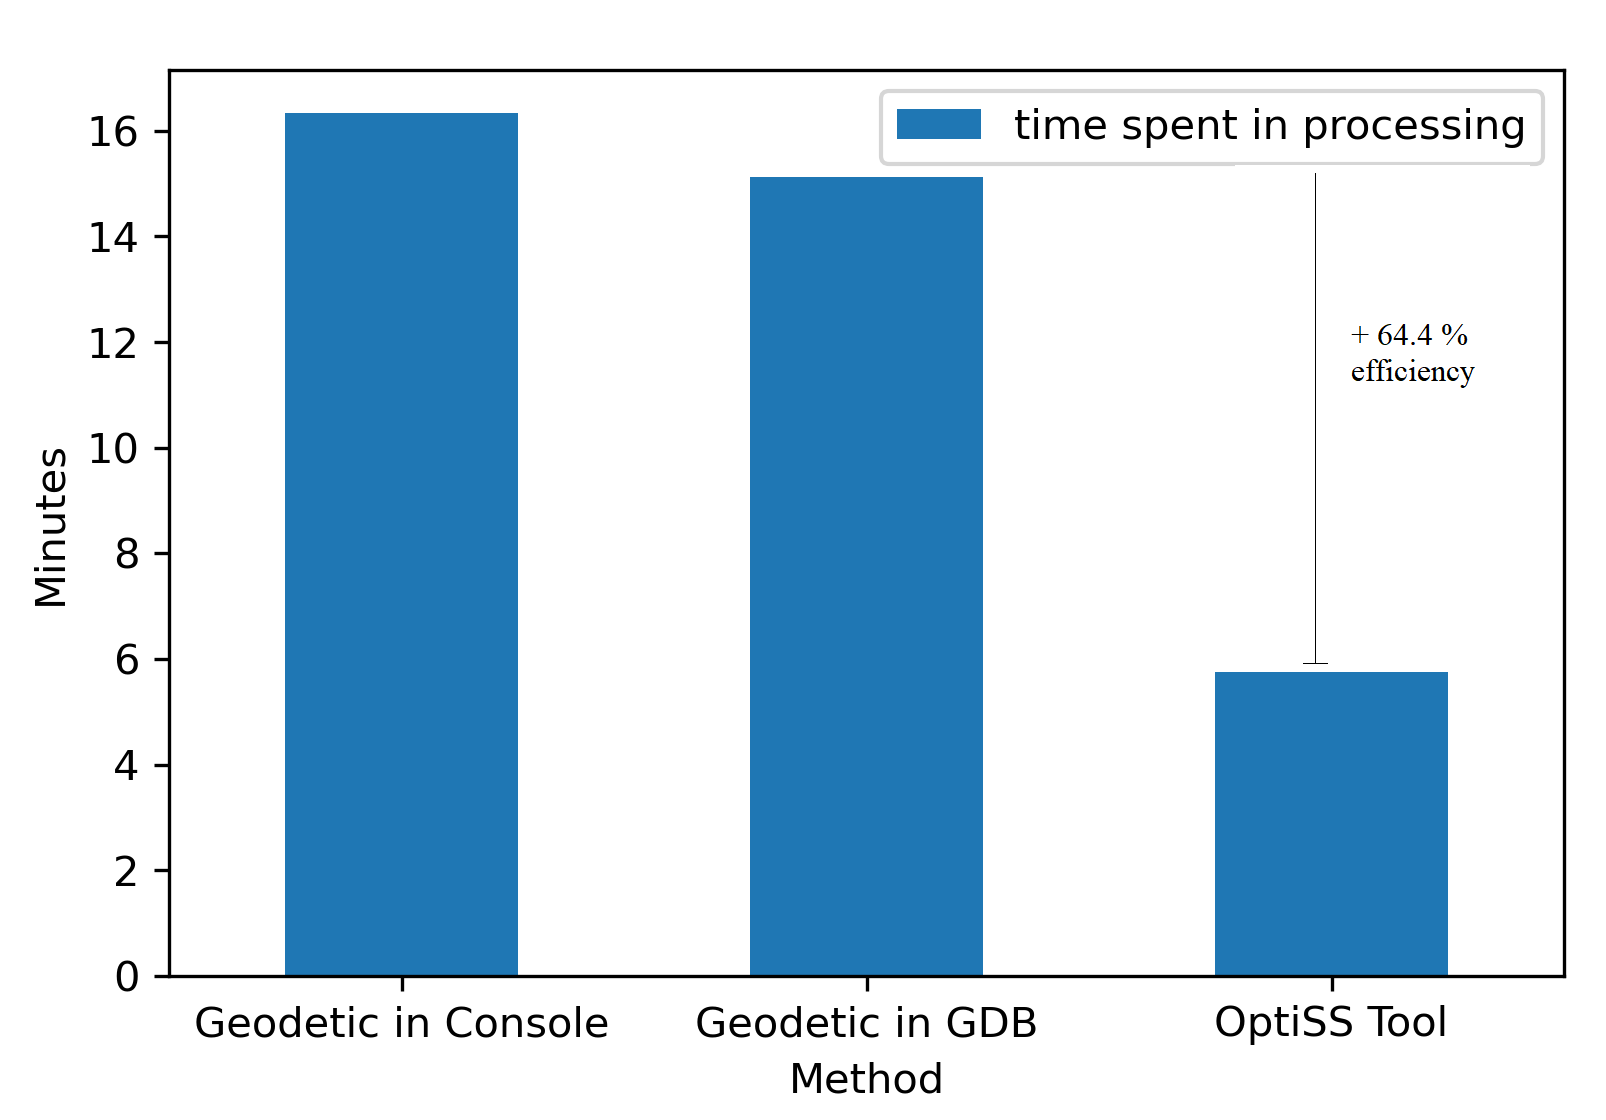
We optimize the computational resources needed for the geodetic spatial join by simply dividing calculations into two different parts: 1) a spatial join of social media posts that are located at land (hereafter Inland posts); and 2) a spatial join of social media posts that are located off the coast (hereafter Outland posts). Finally, it combines both calculations together. This way, OptiSS tool makes geodetic spatial joining faster than in ArcGIS Pro console or in Geodatabase. The tool works for any social media data that has at least geographical coordinates, yet, our example is based on Twitter data. To give an example, we tested the OptiSS tool with a global geo-located tweet dataset including 50244 posts from 500 unique users over 9 years period (see dataset: How to use OptiSS?). The OptiSS tool optimized calculation time over 60% as presented in the figure below:
OptiSS tool usage is explained in this example with a twitter posting history dataset at global level with 50244 posts of 500 unique users over 9 years period. Next, you will see some details about the example and the steps that needs to be followed in OptiSS usage.
You need to save your own files in folders: app_data, and regions_layer. You will find a twitter sample dataset in this repository containing 1000 posts from 4 unique users. But for this example OptiSS used next datasets:
-
twitter posting history.csv dataset at global level with 50244 posts, of 500 unique users, over 9 years posting history, delimited by semicolon. In folder
app_data -
global_regions_fixed_wgs84.shp (Database of Global Administrative Areas - Internal use file). In folder
regions_layer
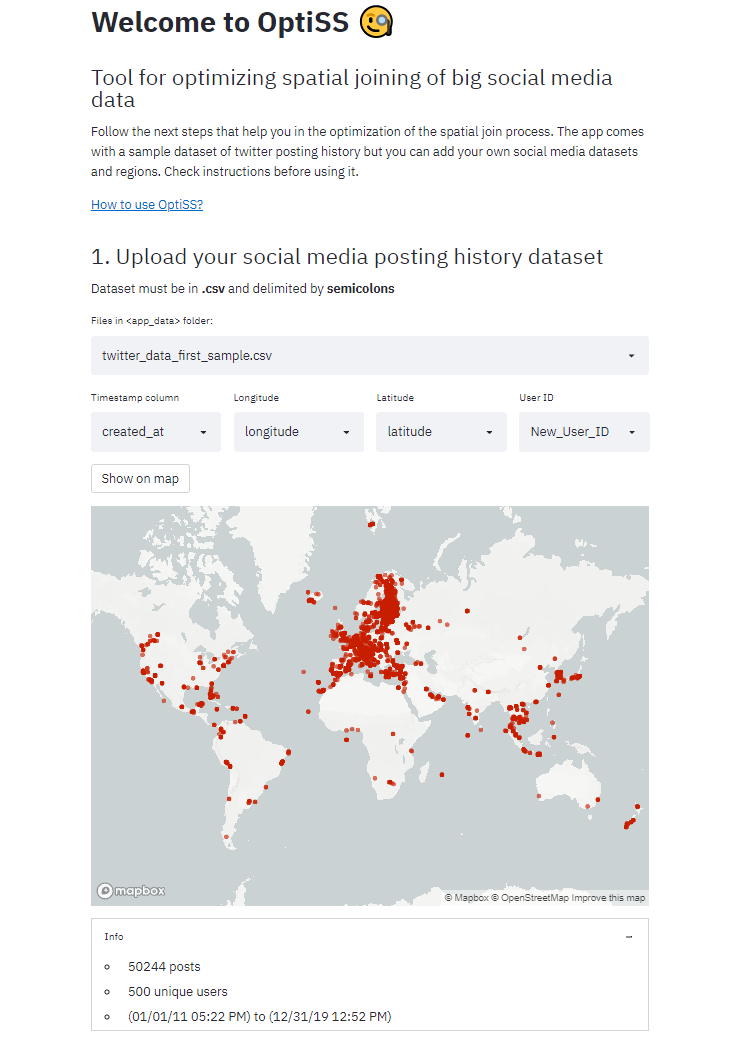
OptiSS starts with a short explanation and includes the link to this section. Then the first part is to upload your social media dataset. You first select your file stored in folder app_data and specify the columns of timestamp, longitude, latitude, and user id. You will notice that data is loaded when the local app ends running process at the right-upper corner. Then you press the button Show on map if prefered. It will look like this:
Then, you select your file stored in folder regions_layer. Be sure you stored in .shp format and in crs WGS 84. It will look like this:
Finally, you have to specify the URL where the Arcpy environment is stored. The recommendation is to do a copy of original environment and paste it from ArcGIS Pro installation folder to the Anaconda environments folder. The instructions can be found in the arcpy_url.txt file in this repository. OptiSS will look like:
Once the process started correctly with Arcpy environment you will notice ballons on the screen. This is a good sign. Finally, the result is an optiss demo data.shp file stored in a new folder called optiss_result. At the moment you open the result you will notice how the social media posts contain the attributes of the region layer including the ones out of the main land. The next image shows some post out of land between Estonia and Finland (left), and the view at EU level with country attribute (right). Click over to see it bigger:
Simply, clone the repository in your computer, open the repo directory in command line, and run streamlit run optiss-app.py
Step by step:
- Open Anaconda prompt (command line)
- Optional. Activate your own environment with all needed libraries if they are not in base environment
- Navigate to your the desired location to save Optiss in local disk. (i.e.
cd C:\Users\bryanval\DGL\Github\) - Clone the repository by typing
https://github.com/DigitalGeographyLab/OptimizedSpatialJoin-tool.git - Navigate to your repository by typing in command line
cd OptimizedSpatialJoin-tool - Run the app by typing
streamlit run optiss-app.py
-
You need to have installed in Python 3 environment:
- streamlit
conda install -c conda-forge streamlit - pandas
- geopandas
- pyproj
- shapely
- descartes
conda install -c conda-forge descartes
- streamlit
-
You need to have ArcGIS pro 2.2 license (i.e. University of Helsinki license). This instructions are included in the arcpy_url.txt file in this repo.
- Find the URL of the Arcpy environment 3.6. Commonly it can be found here:
C:\Program Files\ArcGIS\Pro\bin\Python\envs\arcgispro-py3 - Then, copy the enviroment folder
arcgispro-py3to your local folder of enviroments of Anaconda. Commonly the enviroments are located hereC:\HYapp\Anaconda3\envs\ - Finally, after the copy is done, the final URL is:
C:\HYapp\Anaconda3\envs\arcgispro-py3
- Find the URL of the Arcpy environment 3.6. Commonly it can be found here:
-
Save your social media posting history.csv in folder
app_datadelimited by semicolons- Data must include columns Longitude, Latitude, Timestamp, User_id. You can change names
- Note. Coordinates in WGS 84. Name the columns in example 'lat' or 'latitude' (required for visualization in app)
-
Set up Regions Layer
- Save yor Regions_layer.shp in WGS84 in folder
regions_layer
- Save yor Regions_layer.shp in WGS84 in folder
-
Check the process
- You can supervise the process in the command line. It will start giving messages of the process
-
Re-start a new process
- Recommended to erase entirely the .gdb and the optiss_demo_data.shp generated before starting a new process
If you are more experienced you can implement the optiss algorithm in your workflow independently. In the folder arcpy you will find the script ready to be used manually called manual_optiss.py. You just need to set up the names of the files in the section Parameters.
Then, you activate the enviroment of Arcpy 3.6 (arcgispro-py3) in Anaconda command prompt and set up the directory of the folder arcpy. Finally, run the line python manual_optiss.py
In the folder optiss_result you will find the enriched social media posting history as optiss_demo_data.shp.
You will notice that in the copied local repository in your computer there is a new arcpy_env.gdb that contains temporal files of the process and they are not relevant.
Note! For security there is also a copy of the result in the arcpy_env.gdb
- While ussing the tool. Keep ArcGIS pro console closed or not using your regions file. Otherwise, it will fail the process because of lock (file used by other console)
- If you want to create a new demo dataset with a second social media posting history be sure you have erased first arcpy_env.gdb. The tool do not do replacements. Basically, do all again if posible in a new folder.
- When social media posting history is too big some geometries fail in creation. In that case you need to add a code line to correct geometry. Mentioned code lines are already in the scripts but not activated to make it run faster. If you encounter geometry creation problems be aware to activate this lines by erasing the # simbol.
If you use this script in your research or project, or develop it further, please refer back to us using this:
Vallejo, B & Järv, O (2021) Optiss: A tool to optimize spatial joining of big social media data. DOI: 10.5281/zenodo.5566336


