This repository provides supplementary information for the article Detecting country of residence from social media data: a comparison of methods.
The methodology has been further developed in the BORDERSPACE project at the University of Helsinki. Updated code will be made available via https://github.com/DigitalGeographyLab/
To cite any material in this repository and the related journal article, please use the following citation:
Heikinheimo, V., Järv, O., Tenkanen, H., Hiippala, T., Toivonen, T. (2022). Detecting country of residence from social media data: a comparison of methods. International Journal of Geographical Information Science 36(10): 1931-1952. DOI: 10.1080/13658816.2022.2044484
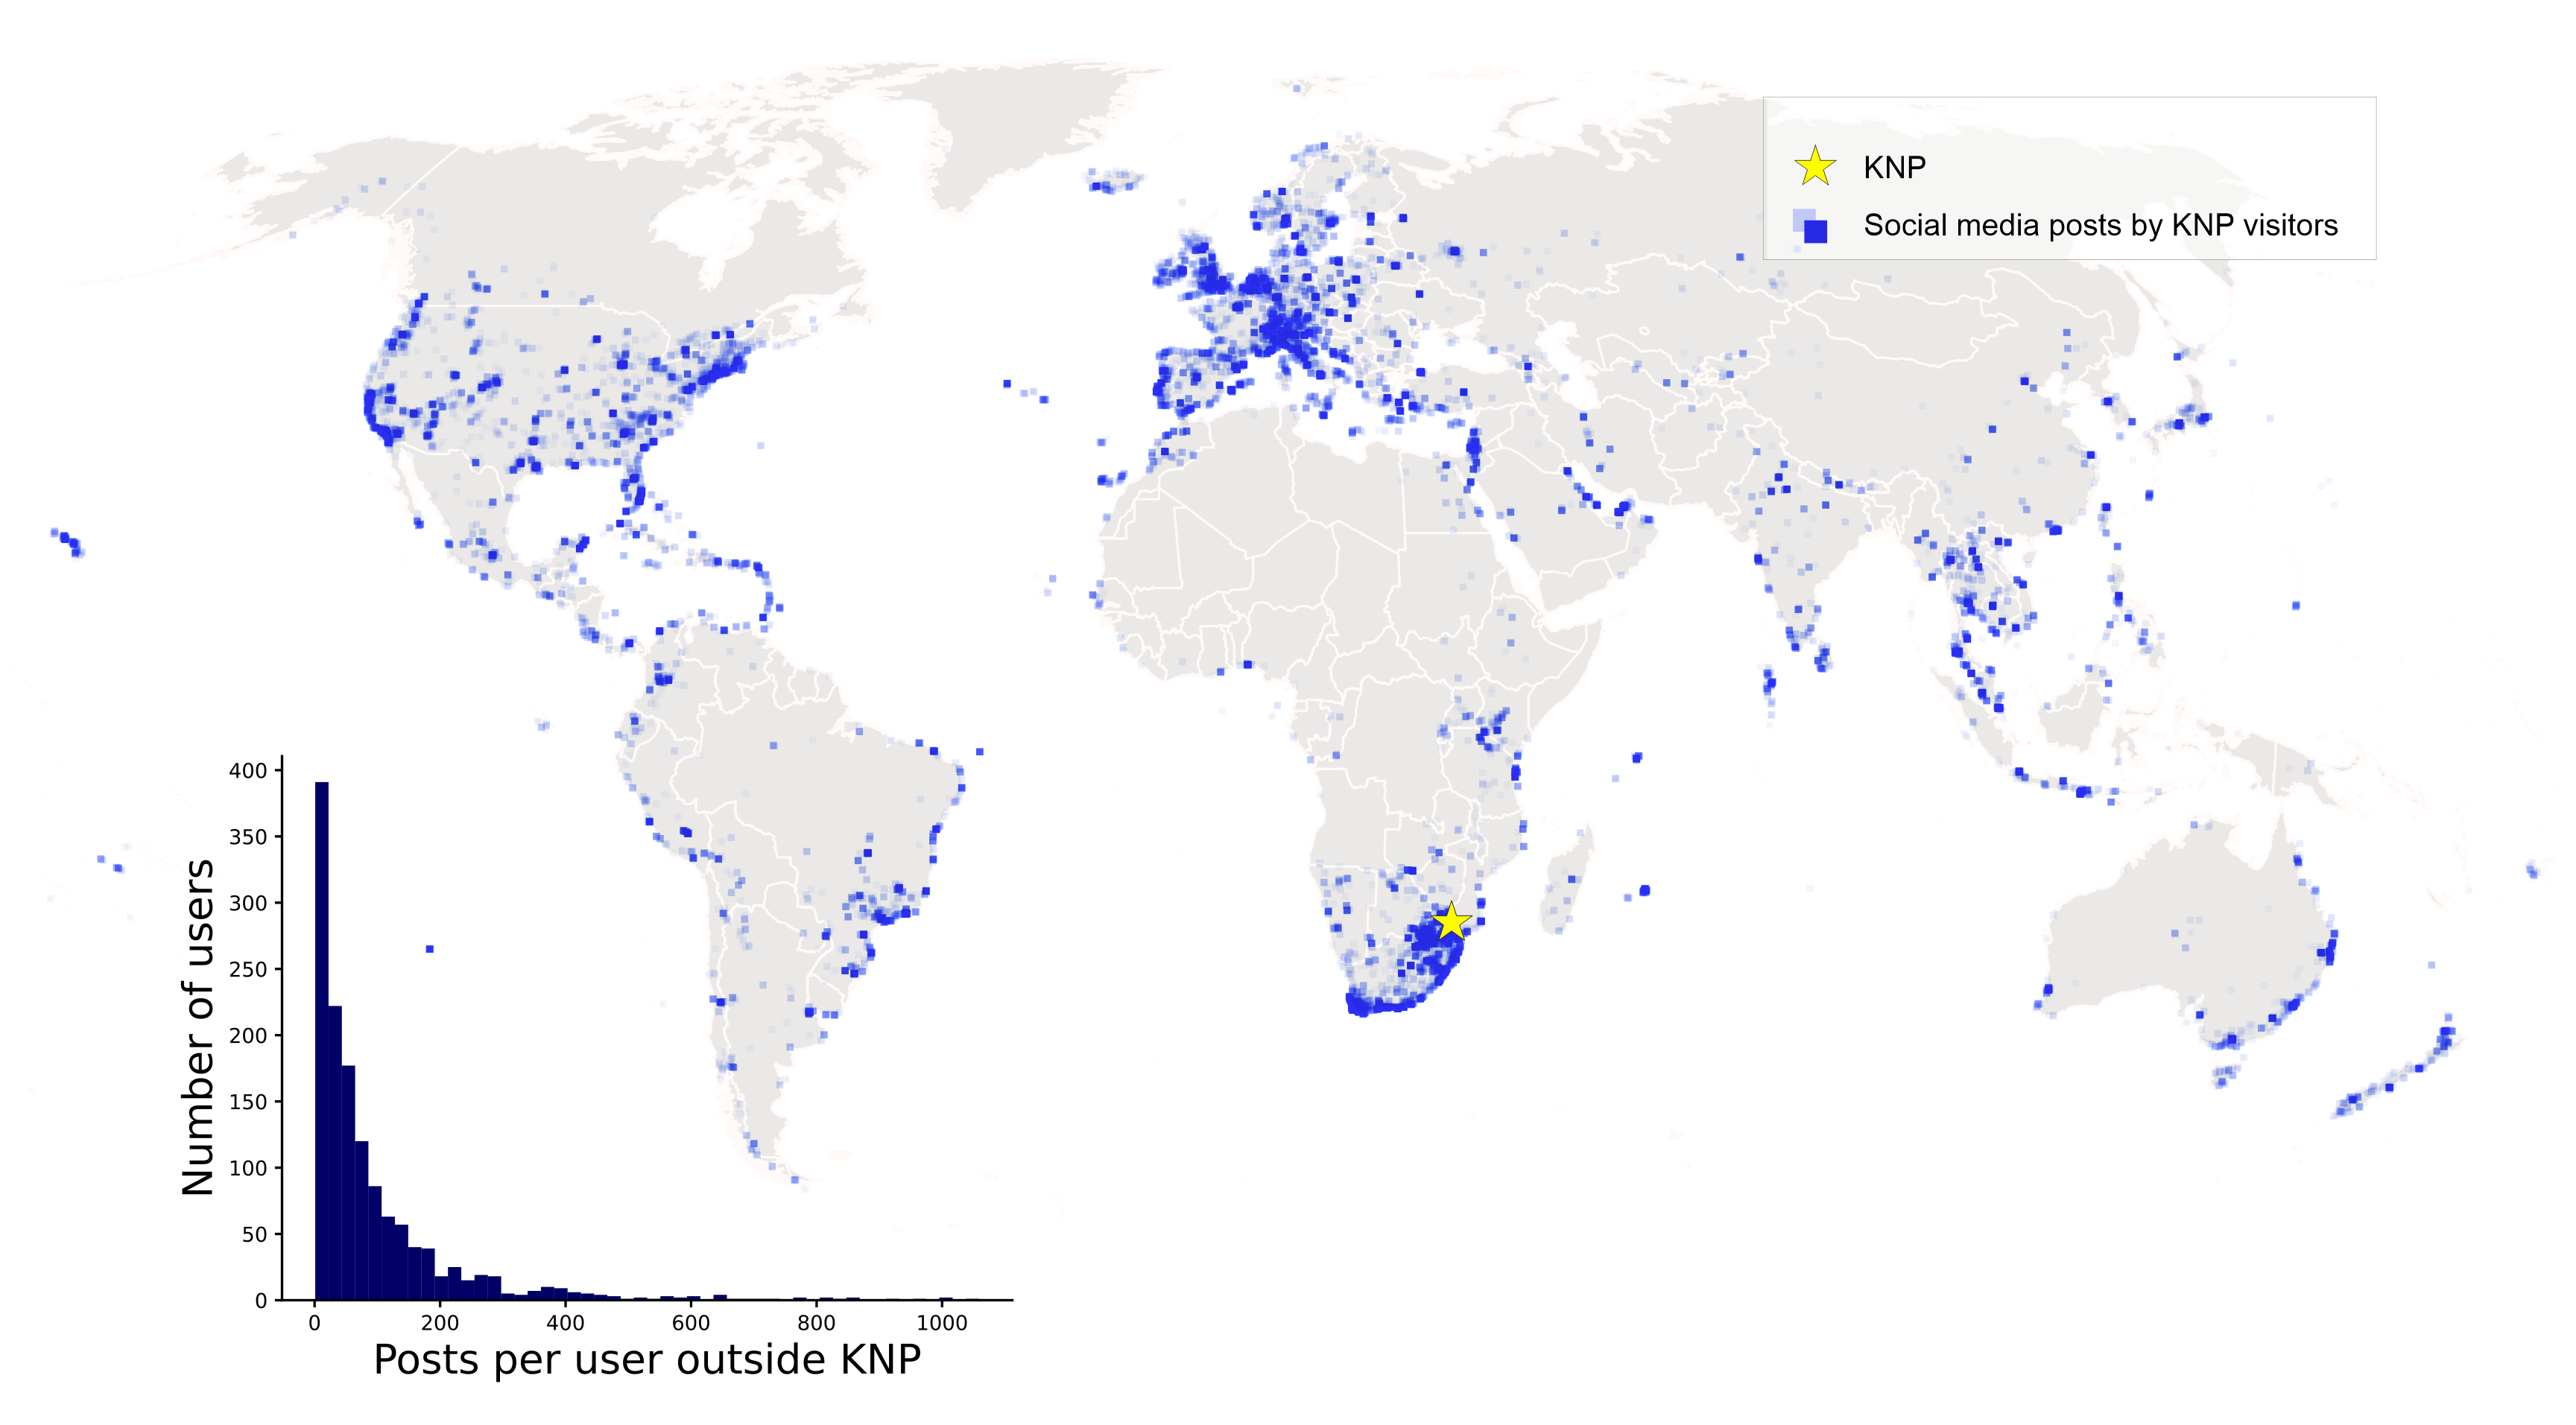
- Global posting history covering years 2010-2016 of social media users who visited Kruger National Park in 2014
- Based on publicly available data collected from the Instagram API in spring 2016
- Each point has information of the related administrative areas (Contintents, subregions & countries)
- This repository contains de-identified mock demo data in demo_data folder. Geotags, timestamps and user identifiers are fake in this layer, but it allows testing the origin detection techniques.
- Global regions -layer
- Based on GADM 2019 (Database of Global Administrative Areas).
- Modified by the authors on the sub-regional level.
- This layer is not included in this repository due to GADM license.
- We welcome interested scholars to contact the authors of the related paper for more details.
 Results in the manuscript are based on data from 1375 users (33 % sample included in the expert assessment)
- BASIC (no hierarchy)
- HIERARCHICAL ( Continent --> Subregion --> Country)
| APPROACH | Measuring technique | Definition of home location | Associated Tool / Script |
|---|---|---|---|
| SIMPLE | number of posts | Country with most posts | |
| SPATIAL | mean center | Country where average centre point is located | Mean center in: |
| SPATIAL | median center | Country where median center is located | Median center in: |
| center of SD ellipse | Country where centre point of Standard Deviational Ellipse is located | Ellipse centroid in: | |
| center of SD circle | Country where centre point of Standard Distance Circle is located | Circle centroid in: | |
| clustering | Country where centre point of most significant cluster is located | DBSCAN: | |
| TEMPORAL | max visit length | Country which has longest stay time between last – first post date | MaxTimedelta in: |
| frequency by months | Country with max frequency by active months. If two or more countries have equal frequency, then country with most posts is chosen | MaxMonths in: | |
| frequency by weeks | Country with max frequency by active weeks. If two or more countries have equal frequency, then country with most posts is chosen | MaxWeeks in: | |
| frequency by days | Country with max frequency by active days. If two or more countries have equal frequency, then country with most posts is chosen | MaxDays in: |
Result files used in the final analysis in valid_results -folder:
- results_combined_by_user.csv
- origin_assesment_expert_1_expert_2.csv
- f1-scores-micro_macro.csv
- spearman_stats.csv
Results based on the demo data can be found in folder demo_results
Jupyter notebooks for plotting the result tables and figures:
Note, all input data for running these notebooks is not readily available in this demo repository.