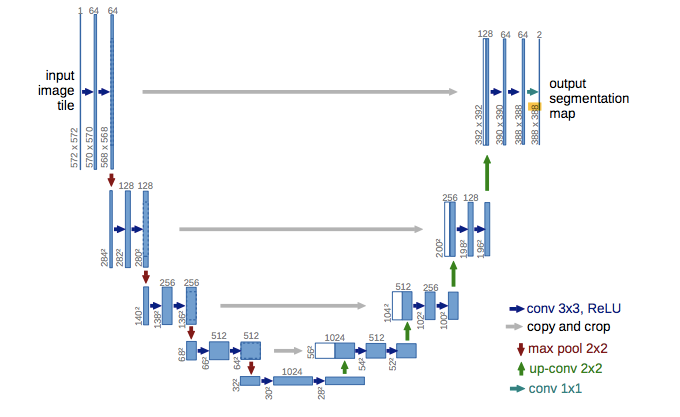
predicting depth from single rgb images using u-net architecture
Pytorch implementation of single image depth predicion using u-net architecture Diksha Meghwal, Imran Ali
For more details:
paper
This code was developed using Python 2.7.15, Pytorch 0.4.1, CUDA, tensorboard logger to plot graphs.
You can try our model on an image by using the script testRun.py. It will take as input a file with suitable extension(.png, .jpg) and save the output in a file called output.png.
python testRun --path <image file path> model.pth
This model requires images with rgb images paired with its corresponding depth map. The images should be such that there is a valid depth value for each pixel.
Hence we use the NYU depth dataset. The NYU depth dataset is divided into 3 parts. We use the labeled dataset part.
We train the model using images of size 64 x 64 pixels. The model's dataloader expects a matlab file containing the labeled dataset of RGB images along with their depth maps. The training scripts runs on CUDA with a batch size of 1 and takes 200 epochs to converge. It takes about 20 minutes for the whole process to complete.
You can monitor the learning process using tensorboard and pointing it to your the log directory location. The validation part of the script validates the performance of the model using a bunch of evaluation metrics each plotted in a separate graph. We save the model generated at each step to a sub-folder named "model" in a file named containing the model tag as the suffix.
python main.py <model_tag> --epochs=200 --batch-size=1
Post training we evaluate the model on a part of NYU labeled depth dataset. We evaluate with a batch size of 8 and plot the output depth map along with the original RGB images and the target depth map and save these plots in a folder names "plots". We can also customize the no of the generated model which we wish to use with the help of the flag as shown below.
python evaluate.py <model_tag> --model_no=200
You can download our model from the file model.pth.

