A dedicated performance counter for Cortex-M Systick. It shares the SysTick with users' original SysTick function(s) without interfering with it. This library will bring new functionalities, such as performance counter, delay_us and clock() service defined in time.h.
-
Measure CPU cycles for specified code segment
-
Add Coremark 1.0
-
Provide Timer Service for EventRecorder automatically.
-
Enhanced measurement services for RTOS
- Measures RAW / True cycles used for specified code segment inside a thread, i.e. scheduling cost are removed.
- Measure RAW/True cycles used for a data-process-path across multiple threads.
-
Easy to use
- Helper macros:
__cycleof__(),__super_loop_monitor__()etc. - Helper functions:
start_cycle_counter(),stop_cycle_counter()etc.
- Helper macros:
-
Support ALL Cortex-M processors
- Including Cortex-M85 and Star-MC1
-
Provide Free Services
- Do NOT interfer with existing SysTick based applications
-
Support ALL arm compilers
- Arm Compiler 5 (armcc), Arm Compiler 6 (armclang)
- arm gcc
- LLVM
- IAR
-
Simplified Deployment
- Drag-and-Drop deployment for Arm Compiler 5 and Arm Compiler 6.
- CMSIS-Pack is available
- RT-Thread package is avaialble
-
Time based services
delay_us()anddelay_ms()- Provides Timestamp services via
get_system_ticks(),get_system_usandget_system_ms().
-
Support both RTOS and bare-metal environments
- Support SysTick Reconfiguration
- Support changing System Frequency
-
Utilities for C language enhancement
- Macros to detect compilers, e.g.
__IS_COMPILER_ARM_COMPILER_6__,__IS_COMPILER_LLVM__etc. - Macro to create atomicity for specified code block, i.e.
__IRQ_SAFE{...} - Helper macros for C language extension:
- VB like
with() foreach(), dimof(),CONNECT()- C# like
using() - simple overload feature of OOPC made out of ANSI-C99,
__PLOOC_VA_NUM_ARGS() - ...
- VB like
- Macros to detect compilers, e.g.
You can measure specified code segment with a macro helper __cycleof__(), it is a wrapper of get_system_ticks().
Syntax:
__cycleof__(<Description String for the target>, [User Code, see ref 1]) {
    //! target code segment of measurement
    ...
}
Here, [ref 1] is a small user code to read the measurement result via a local variable __cycle_count__ for perl lovers, you can also use "_" to read the result. This User Code is optional. If you don't put anything here, the measured result will be shown with a printf().
    __cycleof__() {
        foreach(example_lv0_t, s_tItem, ptItem) {
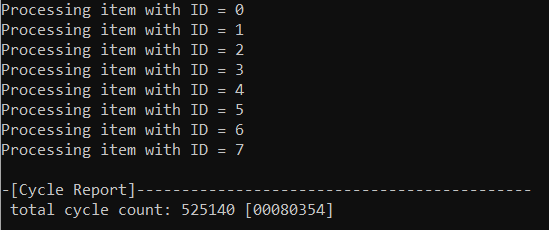
            printf("Processing item with ID = %d\r\n", _->chID);
        }
    }
You will see the measured result in console:
    int32_t iCycleResult = 0;

    /* measure cycles and store it in a dedicated variable without printf */
    __cycleof__("delay_us(1000ul)",
        /* insert code to __cycleof__ body, "{}" can be omitted  */
        {
            iCycleResult = __cycle_count__;   /*< "__cycle_count__" stores the result */
        }) {
        delay_us(1000ul);
    }

    printf("\r\n delay_us(1000ul) takes %d cycles\r\n", (int)iCycleResult);
The result is read out from __cycle_count__and used in other place:
You can get the system timestamp (since the initialization of perf_counter service) via function get_system_ticks() and get_system_ms().
NOTE: The get_system_ms() is NOT a wrapper of the function get_system_ticks().
There are various way to take advantage of those functions.
#include <stdio.h>
#include <stdlib.h>
#include "perf_counter.h"

int main (void)
{
   int i, n;

   n = 5;

   /* Intializes random number generator */
   srand((unsigned) get_system_ticks());

   /* Print 5 random numbers from 0 to 1024 */
   for( i = 0 ; i < n ; i++ ) {
      printf("%d\n", rand() & 0x3FF);
   }

   return(0);
} do {
int64_t tStart = get_system_ticks();
__IRQ_SAFE {
printf("no interrupt \r\n");
}
printf("used clock cycle: %d", (int32_t)(get_system_ticks() - tStart));
} while(0);This example shows how to use the delta value of get_system_ticks() to measure the CPU cycles used by specified code segment. In fact, the __cycleof__() is implemented in the same way:
#define __cycleof__(__STR, ...)                                                 \
            using(int64_t _ = get_system_ticks(), __cycle_count__ = _,          \
                _=_, {                                                          \
                _ = get_system_ticks() - _;                                     \
                __cycle_count__ = _;                                            \
                if (__PLOOC_VA_NUM_ARGS(__VA_ARGS__) == 0) {                    \
                    printf("\r\n");                                             \
                    printf("-[Cycle Report]");                                  \
                    printf("--------------------------------------------\r\n"); \
                    printf(__STR " total cycle count: %d [%08x]\r\n",           \
                            (int)_, (int)_);                                    \
                } else {                                                        \
                    __VA_ARGS__                                                 \
                };                                                              \
})perf_counter provides the basic timer services for delaying a given period of time and polling-for-timeout. For example:
delay_ms(1000);   /* block the program for 1000ms */
delay_us(50);	  /* block the program for 50us */

while(1) {
    /* return true every 1000 ms */
    if (perfc_is_time_out_ms(1000)) {
        /* print hello world every 1000 ms */
        printf("\r\nHello world\r\n");
    }
}If you are using EventRecorder in MDK, once you deployed the perf_counter, it will provide the timer service for EventRecorder by implenting the following functions: EventRecorderTimerSetup(), EventRecorderTimerGetFreq() and EventRecorderTimerGetCount().
If you have not modify anything in EventRecorderConf.h, you don't have to, and please keep the default configuration. If you see warnings like this:
Invalid Time Stamp Source selected in EventRecorderConf.h!
Please set the macro EVENT_TIMESTAMP_SOURCE to 3 to suppress it.
IMPORTANT: Please always make sure the macro EVENT_TIMESTAMP_FREQ is 0
By using perf_counter as the reference clock, EventRecorder can have the highest clock resolution on the target system without worring about the presence of DWT or any conflicting usage of SysTick.
If you want to change the System Frequency, after the change, make sure:
-
The
SystemCoreClockhas been updated with the new system frequency. Usually, the HAL will update theSystemCoreClockautomatically, but in some rare cases whereSystemCoreClockis updated accordingly, you should do it yourself. -
please call
update_perf_counter()to notify perf_counter.
Some systems (e.g. FreeRTOS) might reconfigure the systick timer to fulfil the requirement of their feature. To support this:
-
Before the reconfiguration, please call function
before_cycle_counter_reconfiguration().NOTE: This function will stop the SysTick, clear the pending bit, and set the Load register and the Current Value registers to zero.
-
After the reconfiguration, please call
update_perf_counter()to notify perf_counter the new changes.
- Clone the code to your local with following command lines:
git clone https://github.com/GorgonMeducer/perf_counter.git- Add including path for
perf_counterfolder - Add
perf_counter.cto your compilation - Include
perf_counter.hin corresponding c source file:
#include "perf_counter.h"- Make sure your system contains the CMSIS (with a version 5.7.0 or above) as
perf_counter.hincludescmsis_compiler.h. - Call the function
user_code_insert_to_systick_handler()in yourSysTick_Handler()
void SysTick_Handler(void)
{
    ...
    user_code_insert_to_systick_handler();
    ...
}- Make sure the
SystemCoreClockis updated with the same value as CPU frequency. - IMPORTANT: Make sure the
SysTick_CTRL_CLKSOURCE_Mskbit ( bit 2) ofSysTick->CTRLregister is1that means SysTick runs with the same clock source as the target Cortex-M processor. - Initialize the perf_counter with boolean value that indicates whether the user applications and/or RTOS have already occupied the SysTick.
void main(void)
{
    //! setup system clock

    /*! \brief Update SystemCoreClock with the latest CPU frequency
     *!        If the function doesn't exist or doesn't work correctly,
     *!        Please update SystemCoreClock directly with the correct
     *!        system frequency in Hz.
     *!
     *!        extern volatile uint32_t SystemCoreClock;
     */
    SystemCoreClockUpdate();

    /*! \brief initialize perf_counter() and pass true if SysTick is
     *!        occupied by user applications or RTOS, otherwise pass
     *!        false.
     */
    init_cycle_counter(true);

    ...
    while(1) {
        ...
    }
}- IMPORTANT: Please enable GNU extension in your compiler. For GCC and CLANG, it is
--std=gnu99or--std=gnu11, and for other compilers, please check the user manual first. Failed to do so, you will not only trigger the warning inperf_counter.h, but also lose the function correctness of__cycleof__()and__super_loop_monitor__(), because__PLOOC_VA_NUM_ARGS()isn't report0when passed with no argument.
#if __PLOOC_VA_NUM_ARGS() != 0
#warning Please enable GNC extensions, it is required by __cycleof__() and \
__super_loop_monitor__()
#endif- It is nice to add macro definition
__PERF_COUNTER__to your project GLOBALLY. It helps other module to detect the existence of perf_counter. For Example, LVGLlv_conf_cmsis.huse this macro to detect perf_counter and usesget_system_ms()to implementlv_tick_get().
Enjoy !
-
Download the cmsis-pack from the
cmsis-packfolder. It is a file with nameGorgonMeducer.perf_counter.<version>.pack, for exampleGorgonMeducer.perf_counter.2.2.0.pack -
Double click it to install this cmsis-pack. Once finished, you can find it in your Pack-Installer:
In the future, you can pull the latest version of perf_counter from the menu
Packs->Check For Updatesas shown below: -
Open the RTE management window, find the Utilities and select the Core inside perf_counter as shown below:
- Include
perf_counter.hin corresponding c source file:
#include "perf_counter.h"- Make sure your system contains the CMSIS (with a version 5.7.0 or above) as
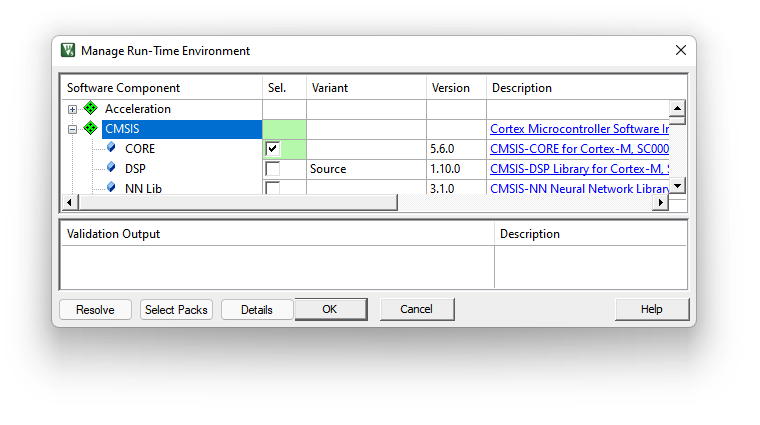
perf_counter.hincludescmsis_compiler.h. Usually, you should do this with RTE as shown below:
- Make sure the
SystemCoreClockis updated with the same value as CPU frequency. - IMPORTANT: Make sure the
SysTick_CTRL_CLKSOURCE_Mskbit ( bit 2) ofSysTick->CTRLregister is1that means SysTick runs with the same clock source as the target Cortex-M processor. - Initialize the perf_counter with boolean value that indicates whether the user applications and/or RTOS have already occupied the SysTick.
void main(void)
{
    //! setup system clock

    /*! \brief Update SystemCoreClock with the latest CPU frequency
     *!        If the function doesn't exist or doesn't work correctly,
     *!        Please update SystemCoreClock directly with the correct
     *!        system frequency in Hz.
     *!
     *!        extern volatile uint32_t SystemCoreClock;
     */
    SystemCoreClockUpdate();

    /*! \brief initialize perf_counter() and pass true if SysTick is
     *!        occupied by user applications or RTOS, otherwise pass
     *!        false.
     */
    init_cycle_counter(true);

    ...
    while(1) {
        ...
    }
}-
IMPORTANT: Please enable GNU extension in your compiler.
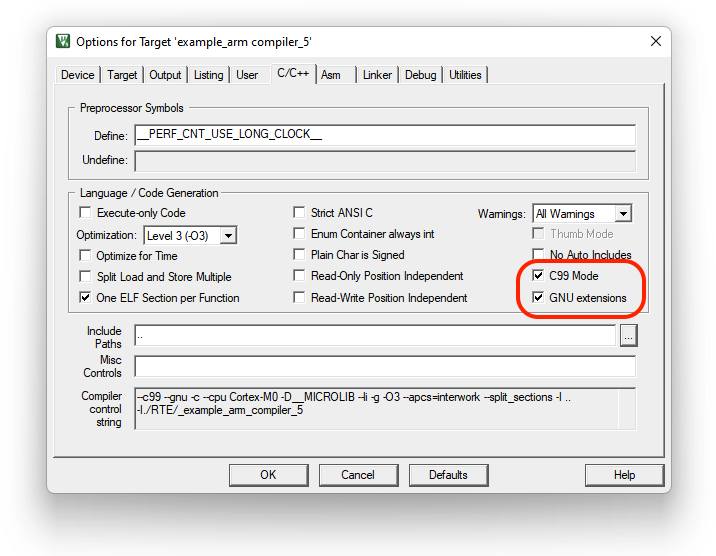
For Arm Compiler 5, please select both C99 mode and GNU extensions in the Option for target dialog as shown below:
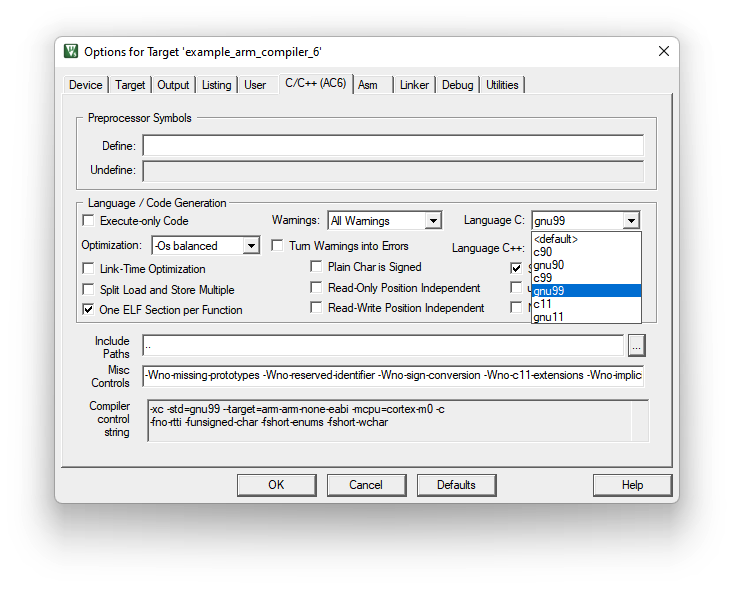
For Arm Compiler 6, please select gnu99 or gnu11 in Language C drop-list as shown below:
Failed to do so, you will not only trigger the warning in perf_counter.h, but also lose the function correctness of __cycleof__() and __super_loop_monitor__(), because __PLOOC_VA_NUM_ARGS() isn't report 0 when passed with no argument.
#if __PLOOC_VA_NUM_ARGS() != 0
#warning Please enable GNC extensions, it is required by __cycleof__() and \
__super_loop_monitor__()
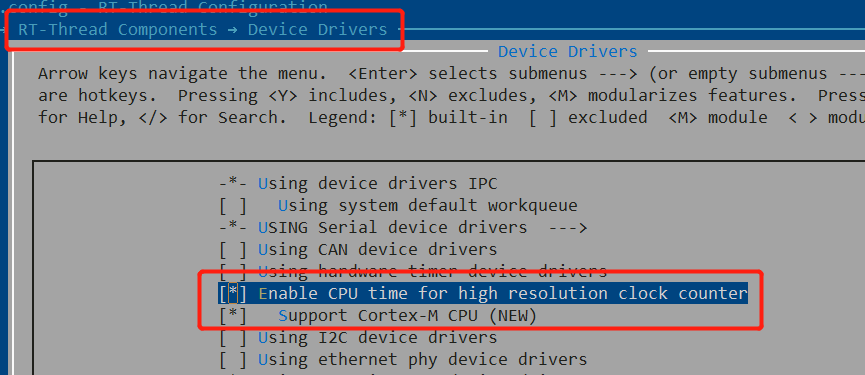
#endifperf_counter has registered as one of the RT-Thread software packages, which locats in system category. In ENV or RT-Thread Studio, you just need to simply enable cputime framework. RT-Thread will automatically enable perf_counter if you are using Cortex-M architecture.
Enjoy !
This error usually pops up in Arm Compiler 5 and Arm Compiler 6. It is because you haven't implemented any non-weak SysTick_Handler(). Please provide an EMPTY one in any c source file to solve this problem:
void SysTick_Handler(void)
{
}NOTE: If you deploy perf_counter using cmsis-pack and encounter this issue, please DO NOT call function user_code_insert_to_systick_handler() in this should-be-empty SysTick_Handler().
Since version v2.1.0 I removed the unnecessary bundle feature from the cmsis-pack. If you have used the older version, you will encounter this issue. To solve this problem:
- please unselect ALL the performance components in RTE, press OK and close the uVision.
- reopen the mdk project and select the perf_counter components in RTE
Sorry about this.
Performance Counter for Cortex-M, a.k.a. perf_counter is under Apache 2.0 license.
