Go-Concurrency-Visualizer
Improvements to Ivan Danyliuk's visualization tool gotrace
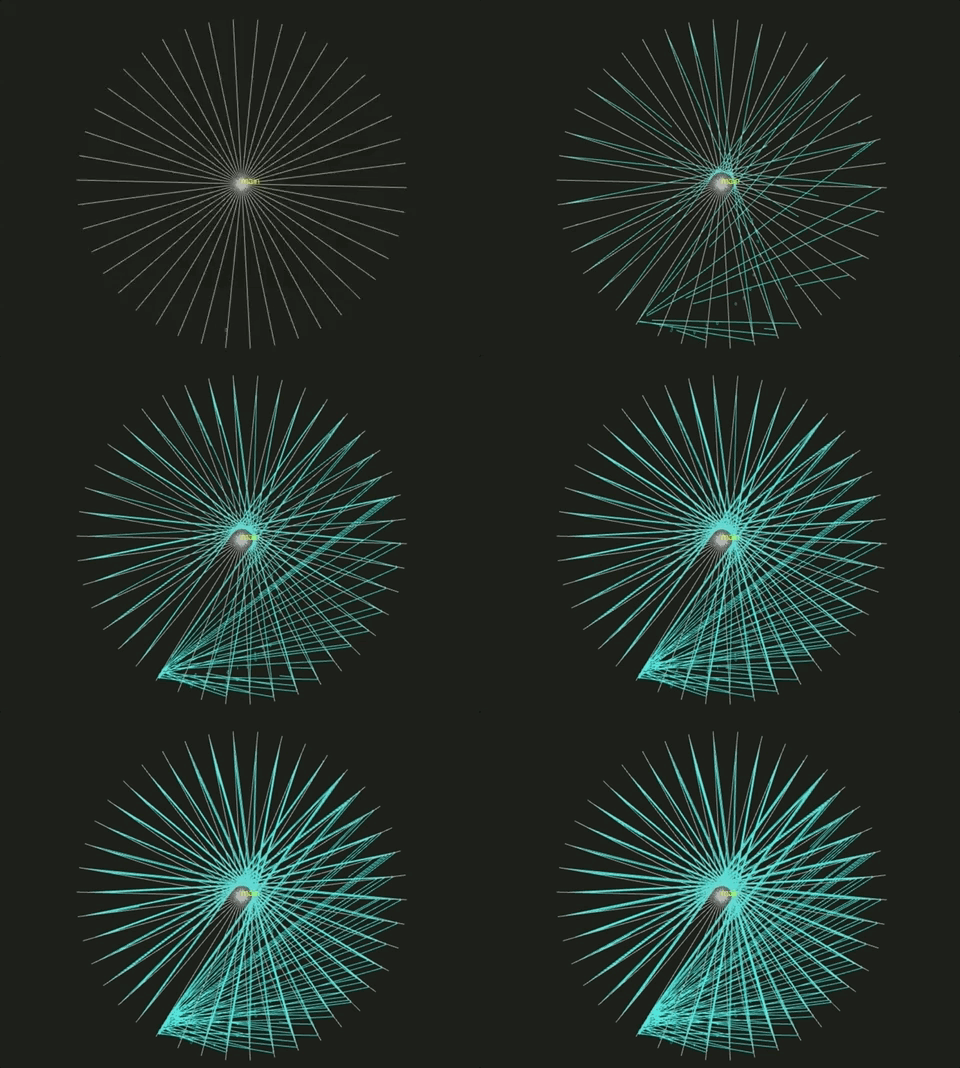
Above is a visualization of the common fan-in concurrency pattern.
Note the goroutine towards the bottom left receiving the aggregate merged results from many channels.
The source code for this particular program is under /examples/fanIn/fanIn.go
Usage
Copy a go source file into the root directory of this project, such as hello.go.
Type ./visualize hello.go
The first time you run this tool, a docker image will be built from source, which may take a few minutes. Subsequent visualizations will be significantly faster.
Press s to slow the visualization, and f to speed it up. Pressing r will restart the visualization.
About
This tool is built on top of the gotrace tool created by Ivan Danyliuk. The tool developed by Ivan is wonderful. However, the original gotrace suffered from many usability issues, lack of useful error message outpout, and appears to now be unmaintained.
Original tool: https://github.com/divan/gotrace
This wrapper on top of gotrace aims to make the tool more accessible to those seeking to visualize concurrency in Go, and is usable out of the box.
Understanding The Program's Output
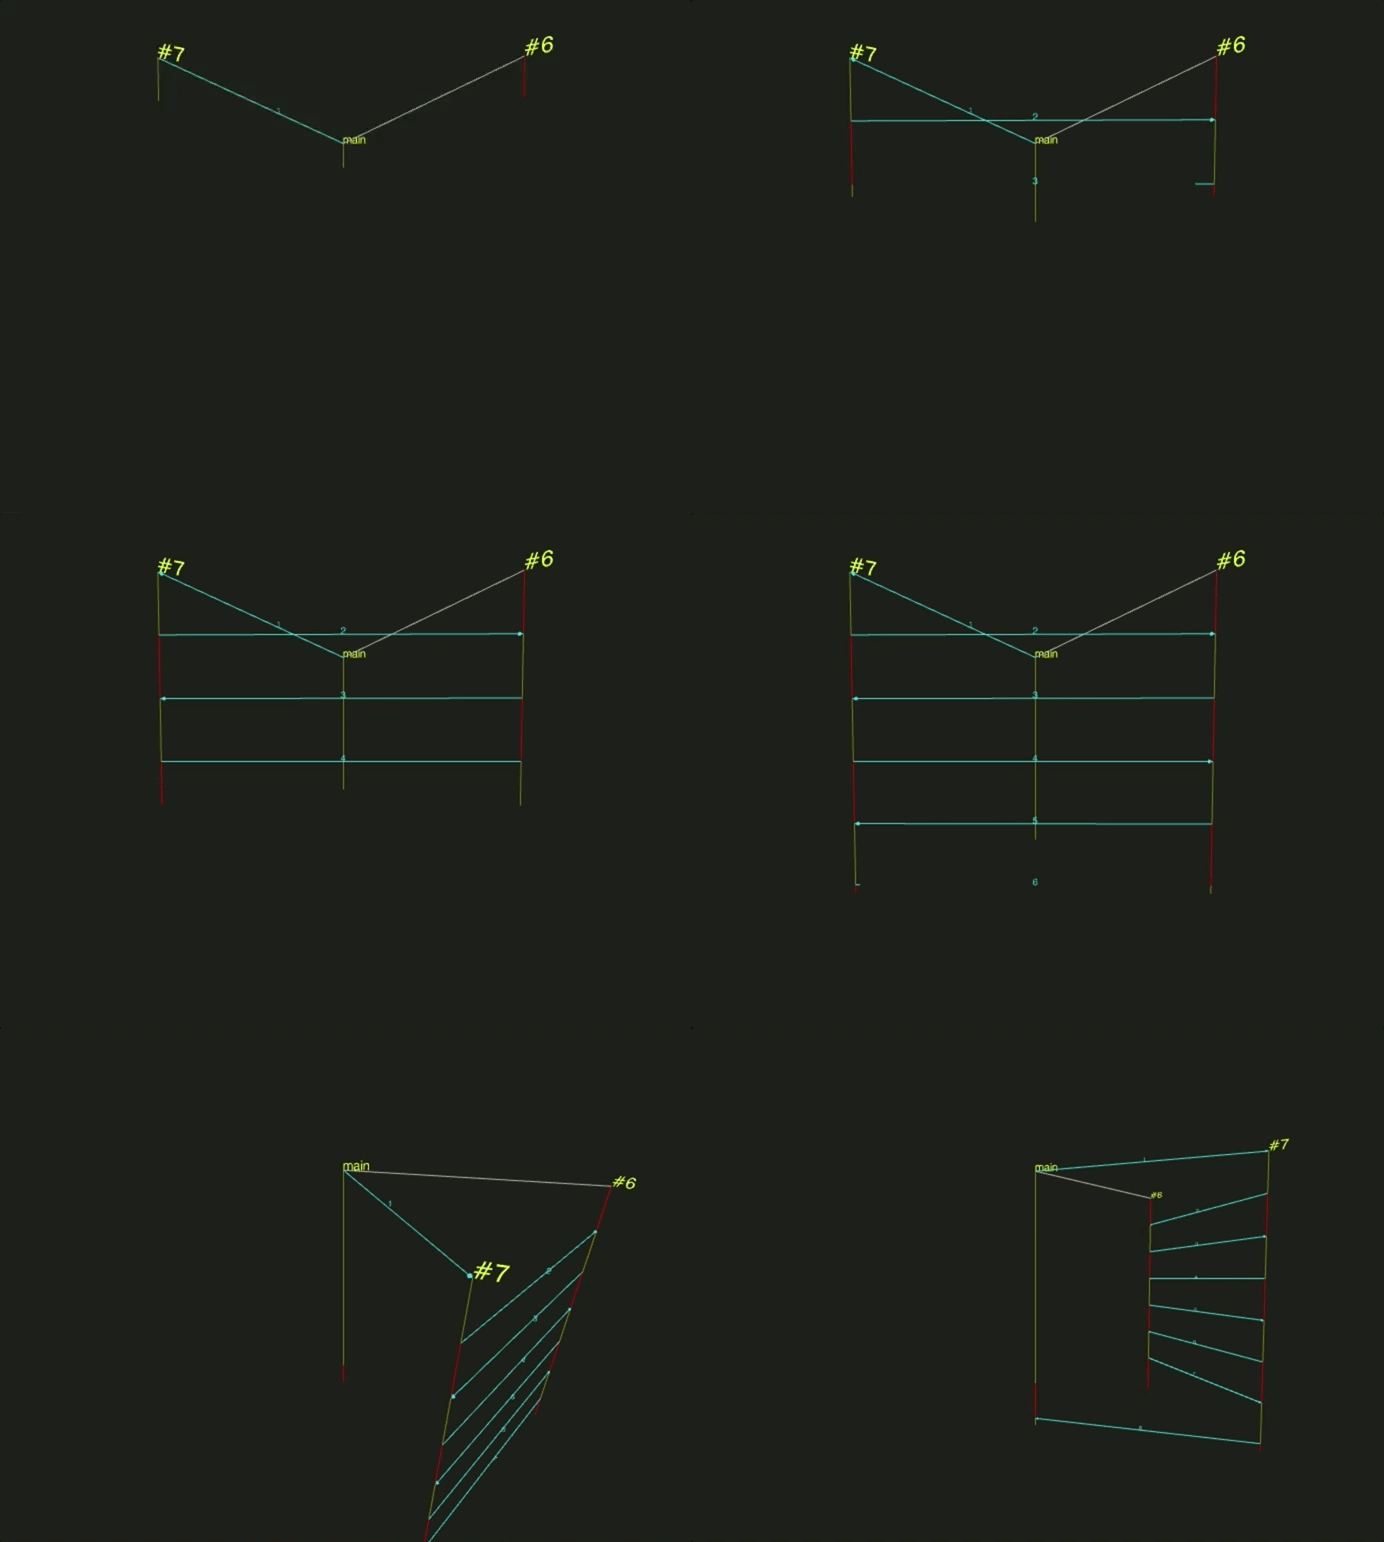
Vertical lines represent goroutines. The length of these lines is a function of time. The more time has gone by, the longer the lines will be.
A red vertical line indicates a goroutine is in a blocked state (waiting on some other goroutine). A green vertical line indicates a goroutine is unblocked and working.
Blue horizontal lines represent communication across a channel from one goroutine to another. Grey horizontal lines represent a goroutine spawning, or being terminated.
A ping pong match between two goroutines!

Future Work
I don't like having to recompile and rerun the program each time, I'll see if I can add some form of caching for unchanged binaries.
